ORH_wxman
-
Posts
93,092 -
Joined
-
Last visited
Content Type
Profiles
Blogs
Forums
American Weather
Media Demo
Store
Gallery
Everything posted by ORH_wxman
-
That’s actually almost a norlun look on reggie. The developing low extends back an IVT which prolongs the precip and you see the 850 flow go almost calm and you already have the very steep lapse rates.
-
Lol reggie gone wild. That’s almost low end warning snows for ORH maybe even to my area.
-
NAM was pretty good in CT
-
NAM even colder. Nice NE flow at 925…already -1 in your hood by 15z. Maybe a surprise there?
-
925 collapses SE as that little mesolow develops. RAP showed the same thing.
-
That’s solid advisory for N CT right up into most of MA and S NH
-
Little mesolow tries to form tomorrow too with that potent vortmax. If that develops a little quicker and backs the winds more N, that will help out the lower areas near the coast…even 2F can make a big difference.
-
Yeah the sig is really strong on ensembles. People need to ignore the OP runs for now as hard as that is. It’s 9 days out and has a great chance of not amounting to anything too. But for this lead time, it’s all you can really ask for realistically.
-
Wonder if someone can pick up 4 or 5 inches in the high terrain tomorrow. Like ORH county to berks. But even down lower could be interesting. Nice soundings.
-
NNE should def start making up some ground in the next 10 days. Esp those upslope areas…a lot of these little disturbances embedded in the flow will be good for 4-6” moose fart events and anything synoptic in these marginal airmasses will be fine up there. I wouldn’t be too nervous yet if I was Tblizz. If they are still looking bleak a week to 10 days from now, then I’d be worried.
-
BDL and ORH didn’t move them. They just didn’t report them. They often reported in individual events but not all the time. Esp the smaller ones. We were able to reconstruct ORH data pretty accurately and they now have it on the nws site (after like 15 years! Woohoo!). But BDL was never been pieced back together. I tried with BDL for some years but I wasn’t able to do all of them. I think PVD may have had a few missing years too but not as many as ORH and BDL. I think those two were missing 7 full winters and parts of another.
-
They don’t get the tag unless they provide proof (or in some cases, we might already know them or another met went to school with them)
-
It’s good you finally agree that we’re not dealing with a SE ridge the next week or two.
-
It’s not a good pattern but it’s far from the worst. We don’t have an AK vortex and we have split flow. We’re in the game if those two criteria are met. Hopefully it trends a little better too given the tropical forcing.
-
‘15-16 was an awful winter. It stayed bad. We did get some snow events but it wasn’t enough to revive winter. The mid-Atlantic had the HECS but it only fringed us. You might be thinking of 2014-15.
-
In split flow, we can sometimes get away without it. Jan ‘06 was an example…ditto for periods in the ‘83 Nino and more recently we did ok in late Dec 2012 with that type of look. The first half or 2/3rds of Jan ‘87 was similar as well. I think we were like +3 or +4 the first couple weeks with 3 warning snow events. But you need that split flow with lower heights down south for it to have a chance. Otherwise it’s parakeets and pina coladas.
-
What about 2015-16? We had basically nothing at this point.
-
It’s still a split flow look too. So I think we’ll have chances even if it’s above average. My gut still says we trend colder with that look though as we get closer. Anytime I see the core of positive height anomalies centered from Hudson Bay over to northern Labrador, I’m skeptical of big warmth for us. The tropical forcing still argues for a bit colder than that look but we’ll see. At least it’s active. Nothing worse than pure zonal flow with no systems.
-
18z NAM looks a little colder than 18z RGEM, but pretty similar. Both have the burst of precip. RGEM might be tougher for south of MA/CT border.
-
Def a north-south gradient at 925mb...Kevin is kind of on the line while ORH is like -1C.
-
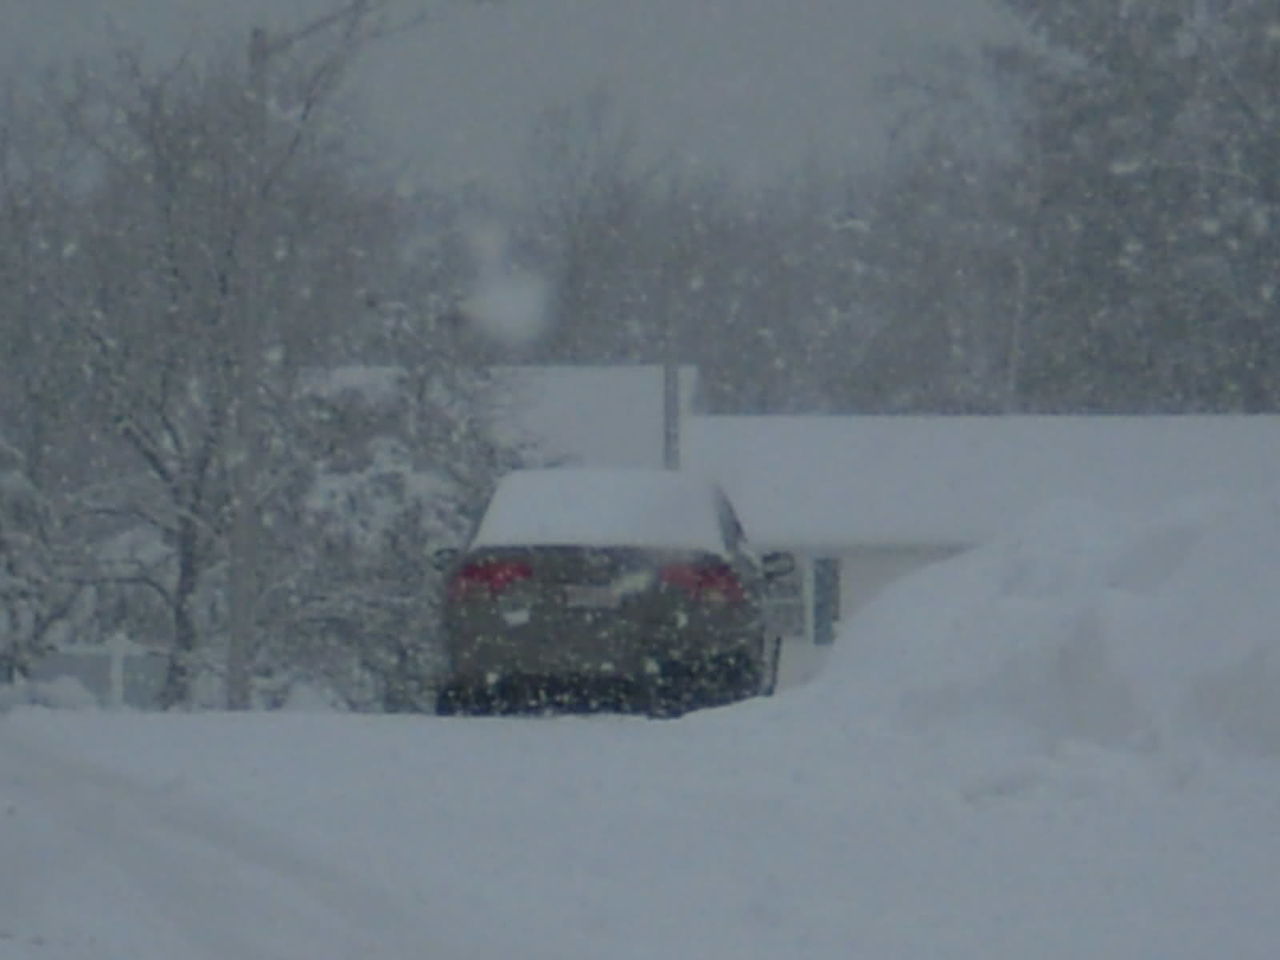
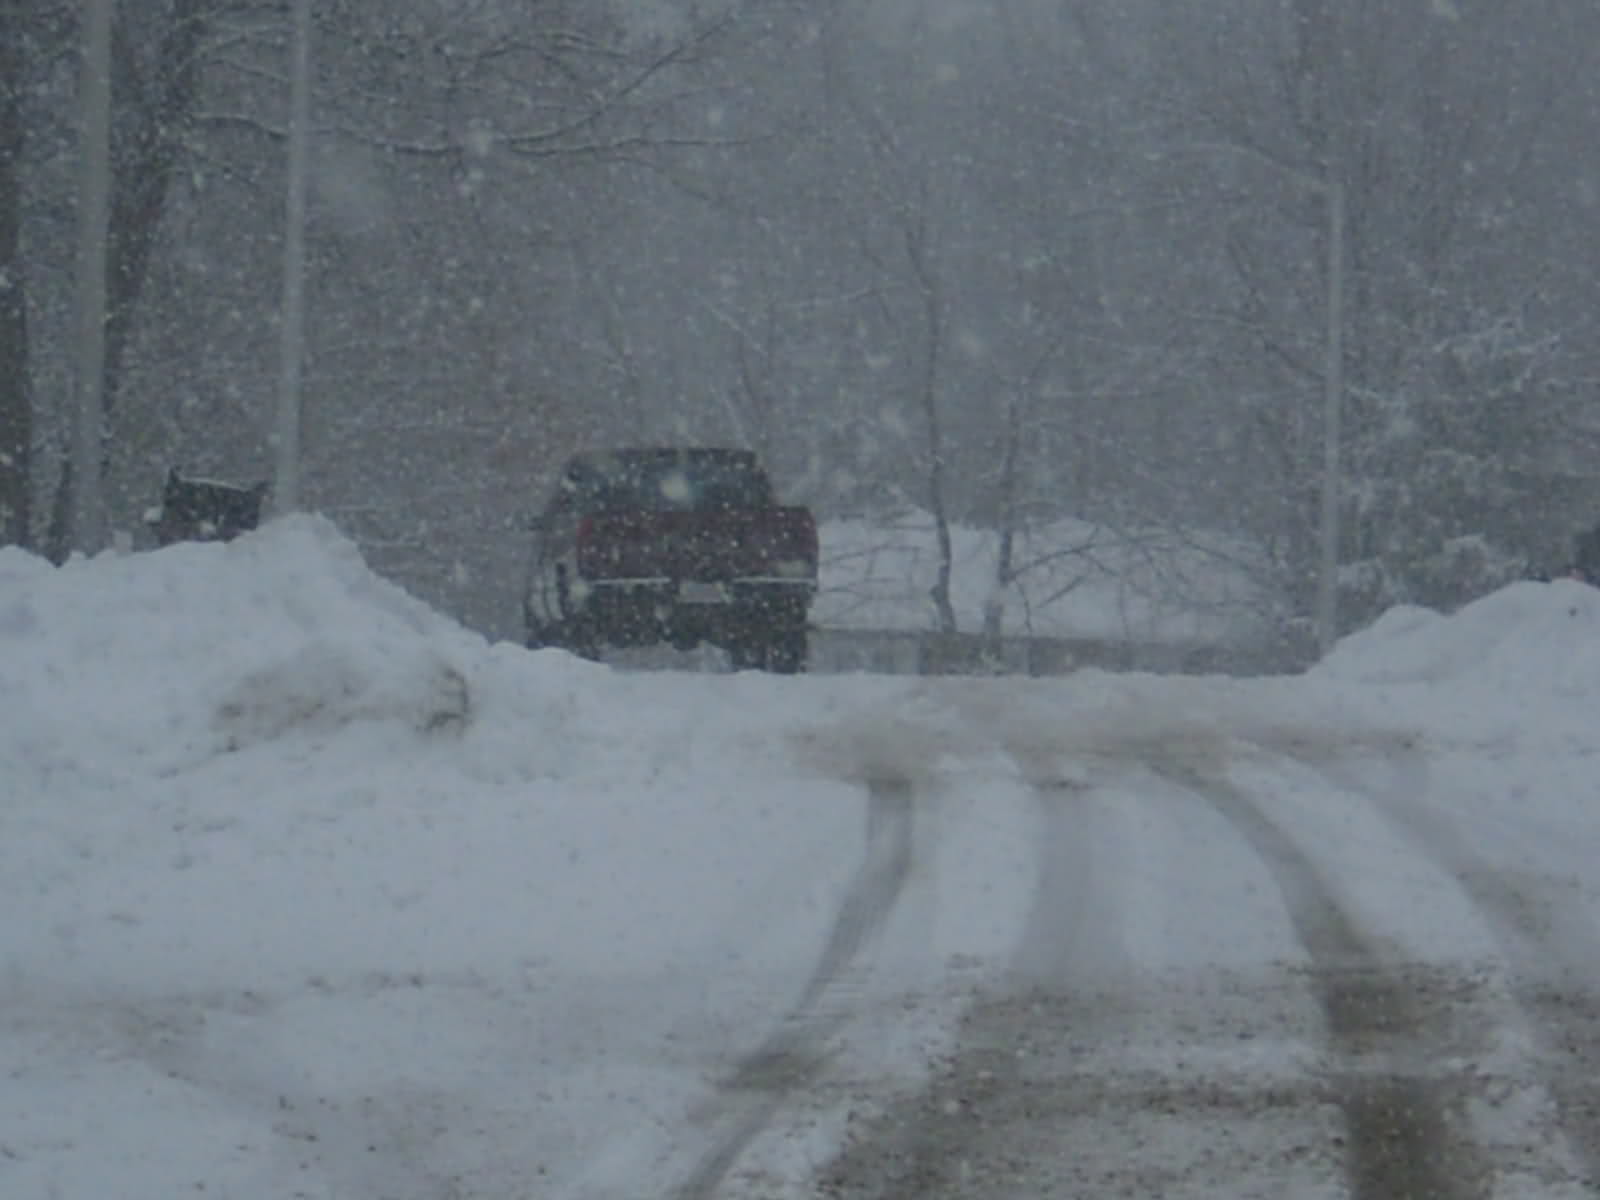
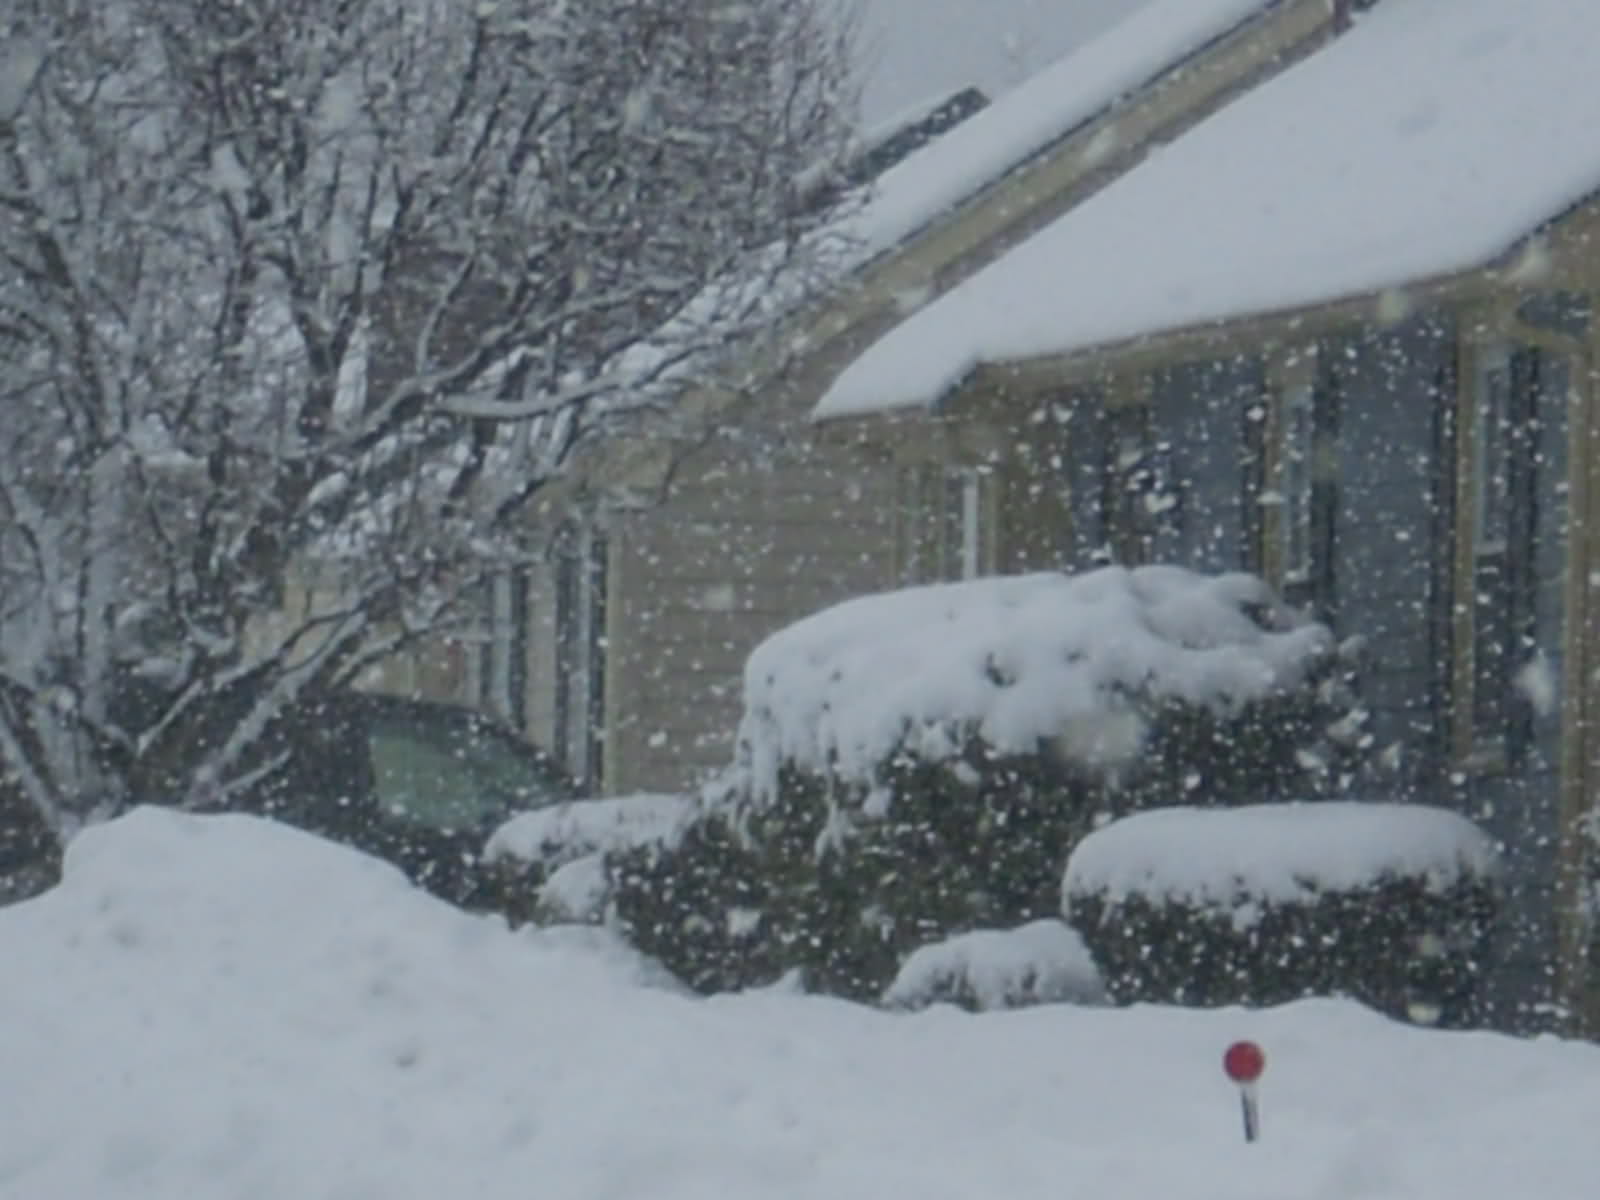
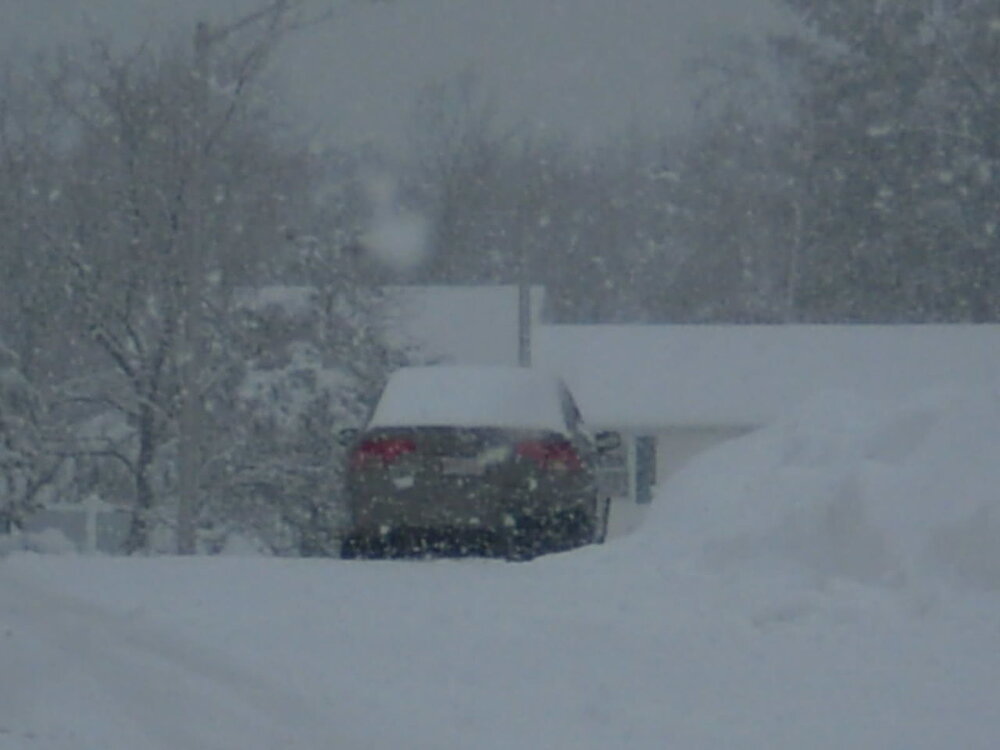
Had something like this the day after the MLK 2010 storm....it was actually the event that put Kevin into his infamous MLK meltdown....he was already teetering on being screwed in the storm a day and half earlier, but this little potent vortmax/ULL swings through but he's slightly too warm in the BL with heavy rain showers while just north over the border, we're pounding quarters with 1/4 mile vis and got a surprise 3-4". I even took 3 pics that day....still have them. Sometimes those events are almost as fun as a bigger storm....because you weren;'t expecting much.

-
Decent crosshair sig on the soundings too...hopefully it happens. These seem to be coin flips though....sometimes you get some nice bands of moderate to heavy snow and other times it's almost nothing. Pretty potent vortmax though, which is what you want to see to try and generate some lift.
-
18z NAM has a good burst of snow Friday. It's been on and off all the models. Just have to watch that one....the only reason it's even semi-interesting is the atmosphere is quite unstable friday. It gets pretty cold aloft with e marginal boundary layer and that can produce some heavier bands if anything materializes.
-
'83 was a super Nino....the pattern is definitely like that for a couple weeks here. About 4 days before the big KU, there was another big storm that hit interior SNE hard, but the coast had a lot of ptype issues.
-
The bolded is a good thing on a scientific forum....people should be exposed to heterodox opinions as long as those opinions are in good faith and backed with evidence. I think when evidence-free claims are made, that's when people perceive it as trolling and they are often correct.