ORH_wxman
-
Posts
93,092 -
Joined
-
Last visited
Content Type
Profiles
Blogs
Forums
American Weather
Media Demo
Store
Gallery
Everything posted by ORH_wxman
-
First flakes for some of the peaks today/tonight and possibly tomorrow. Upslope flow and midlevel temps cool to bring snow down into the highest terrain.
-
The empirical evidence would argue against a death spiral. We would’ve continued to get large declines and instead it’s basically been flat since the nadir 2010-2012 period. The evidence also argues against a rebuilding of multi-year ice to levels seen pre-2007. We seem to be more in a semi-stable period of sea ice the last decade-plus. I suspect we need to warm more in the winters in order to see more record lows consistently. (This is because winters are still cold enough to refreeze the first year ice into its max thickness of roughly 2m) Until that happens, we’d need a big time preconditioning weather pattern to get a new record.
-
Looks like 2.47 may have been the min. Up to 2.58 million sq km as the central CAB low-concentration ice is refreezing now.
-
Area is down to 2.47 million sq km....not sure how much further we can drop given the likely refreezing of the central CAB commencing where there's a lot of low concentration ice right now, but if we can drop below 2.42 million sqkm, then that would beat 2016 for second place.
-
Gonna need that Aleutian ridge to get poleward....if it can, then we get that nice -WPO to a neutral or negative EPO combo....and that will help give the arctic shots some bite to them so the airmasses aren't as stale. In recent winters, aside from the annoying deep western troughs, we've had a lot of +WPO which kind of gives us fake arctic airmasses even when the EPO goes a bit negative or the PNA goes positive. Obviously last year was an El Nino, but the La Nina of 2022-23 had this pattern....despite a -EPO and strong arctic ocean blocking, we had deep troughing over Kamchatka and far eastern Siberia which you don't want to see. You might be able to get away with that if you had a decent PNA, but once you add in the deep west coast trough, it was game over. I know @Typhoon Tip and I have had discussions about the stronger WPO/Bering sea ridges being a good cold signal (and the opposite being a very strong warm signal). I've often talked to @CoastalWxabout the Bering Sea death vortex too....low heights there really suck for us. In those colder La Nina years like '08-'09, '10-'11 and to a lesser extent '07-'08, we had the -WPO present with the big poleward Aleutian ridges....'07-'08 was kind of a hybrid, the meat of the Aleutian ridge was south but there were vestiges north of Bering and into the arctic ocean almost acting a block (esp in Dec 2007).
-
We had a pretty favorable pattern for preconditioning from late May into mid-June but then it got less favorable late in June....you really want to sustain it longer to have a run at 2012. Still, it was enough to put a top 3 melt season in play as the data showed in my July post. 2012 was exceptionally well-preconditioned. It had like a 300k lead at the end of June on SSMI/S area compared to the cluster right behind it in the rankings which is a huge spread.
-
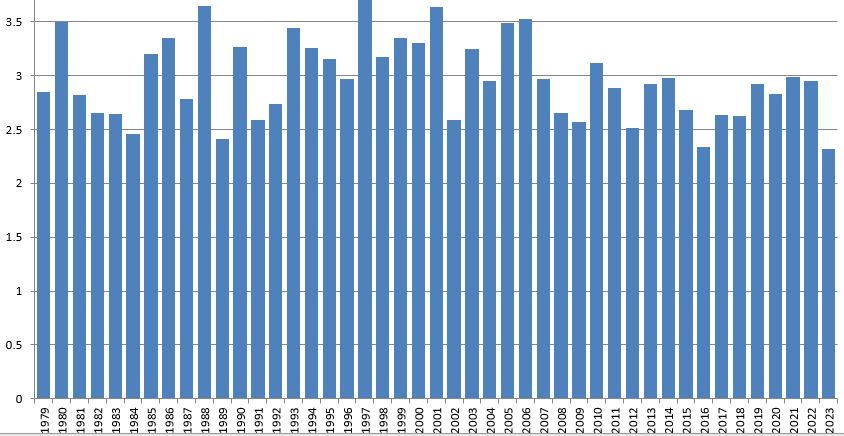
I meant to post this 3 weeks ago, but got very busy....but the prediction for the final NSIDC sea ice area based on June data is below: This graph is what the final NSIDC area would be if you took the NSIDC data from 6/30 and then use each of the below season's melt from 7/1-onwards. This gives us a good range of possible outcomes. For example, if we used the record-breaking post-7/1 melt from 2023, we'd end up at 2.31 million sq km which is 2nd lowest of all time. Note how 2012's post-7/1 melt does not produce a record....the reason is because 2012 was already so low by 6/30 that it did not need record post-7/1 melt to produce the lowest minimum on record. That said, while post 7/1 melting has not seen the type of trend that pre-7/1 melting has, it is still faster than the pre-2007 era. If we took all years in the dataset for our post 7/1 melt, then we'd get a mean of 2.96 million sq km for our min. But if we took only post-2007 years, we'd get a mean of 2.74 million sq km which is where I would concentrate my prediction. July has been a pretty solid loss month, so it might be lower, but I'm going to base this prediction on what the data said on 7/1....which when we round to the nearest 100k, will be 2.7 million km plus or minus 300k. (so a range of 2.4-3.0) Right now, NSIDC area is barely above 2012 and 2020. but they both dive off a cliff pretty good soon. 2012 goes completely nuclear so it will be hard to keep pace...especially since forecasts show a reverse dipole that just set in the past day or two continuing for at least another week. So I'd expect 2024 to start falling behind the pace a bit....but there is still a very realistic chance for a top 3 or 4 season. 3rd place is 2.58 million sq km in 2020....4th place is last year at 2.62 million sq km. If we're gunning for 2nd lowest, it would be 2016 at 2.42 million sq km. I usually like to predict NSIDC extent too though it's a bit harder to do that because compaction plays a big role in extent (but not much for area)....however, given the prediction of 2.7 million sq km for area, I'll go with a minimum NSIDC extent of 4.0 million sq km plus or minus 400k.
-
I could see them revising lower when the June data is in. Def had an acceleration in positive melt pond anomaly in June. I agree that 2012 is still prob out of reach though.
-
One more day until I’ll calculate my final SIA predictions but this year has potential to be a higher end melt season. We’re running close to years like 2020 and 2016 right now but still decently above 2012. Only inhibiting factor might be that the favorable melting pattern that we’ve seen the last 10-12 days or so is flipping to a better retention pattern for the ESS/Chuchki/Beaufort side which is often a key region to have high end melt seasons.
-
I'm always amazed at how much confidence people have in record temps when the prog is like 5+ days out. In this case...an all time monthly high for BGR.
-
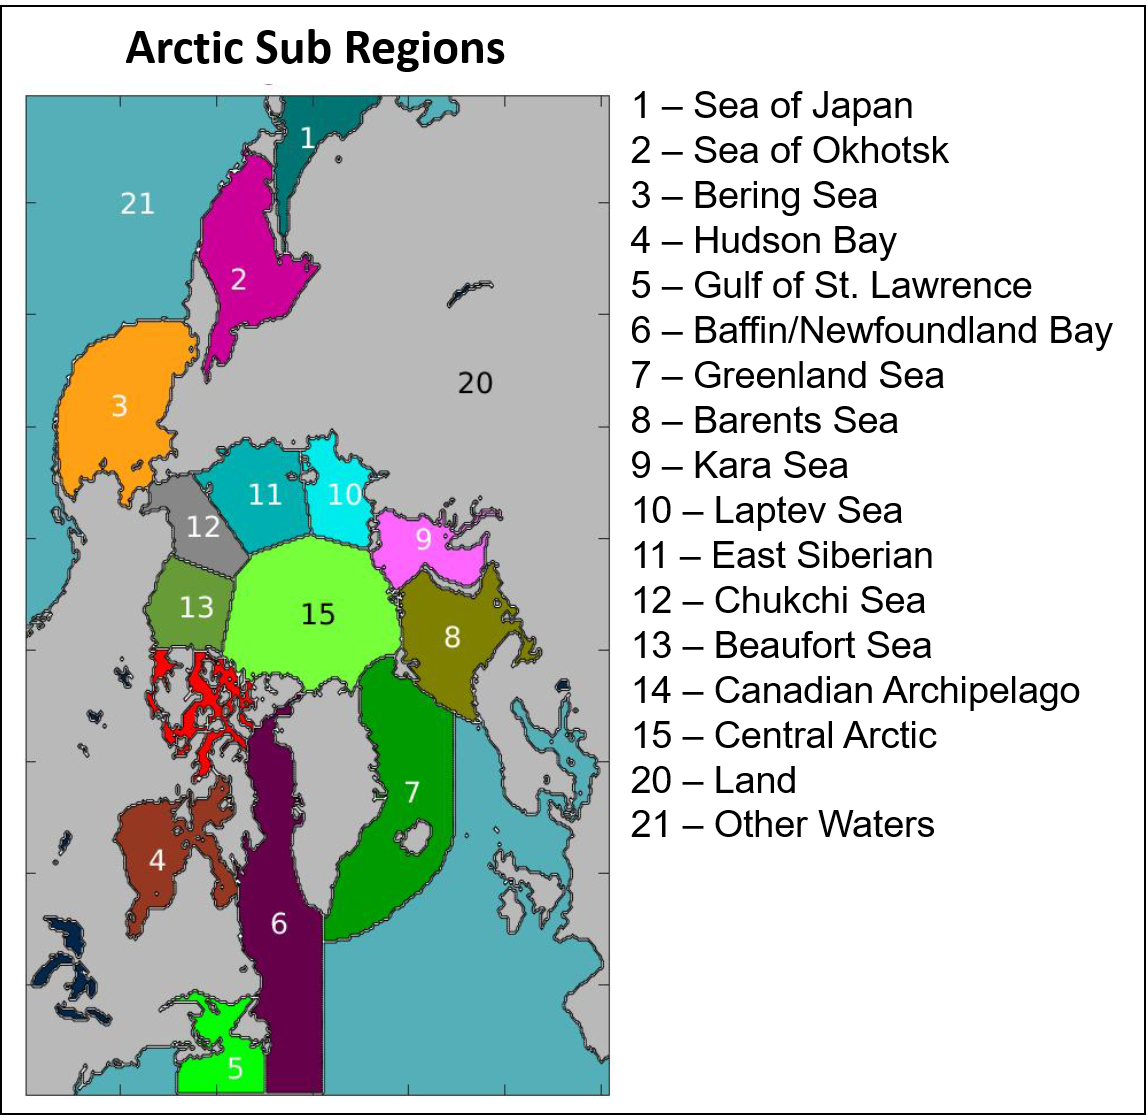
They keep the regions pretty tightly classified. Labrador is pretty much completely melted out....but the adjacent Baffin Region still has a lot of ice.

-
I haven't found a big relationship between the two. Granted, I haven't looked in years but previous studies were negligible. There was some weak (but statistically significant) relationship between the rate of ice gain in the fall and cold outbreaks....I know @Typhoon Tip and I discussed this many years ago.
-
Weird start to the melting season....the Beaufort is getting preconditioned and melting out quickly. It's the lowest since 2020 at this point, and 2020 was a big melt season. The only other two lower in the Beaufort at this point were 2012 and 2016, also huge melt seasons. Though 2008 was fairly close. OTOH, the Chukchi and ESS are the slowest start we've seen post-2007. In fact, both have area higher than the 1980s mean at this point in June. The only other post-2007 years that started even close to that slow in Chukchi/ESS were 2008 and 2014. We'll see how these competing forces behave in the next 2-3 weeks. Overall, ice area is currently 3rd highest in the post-2007 context....only 2009 and 2013 were higher at this point. I wouldn't predict that type of season though yet because of the Beaufort situation. All the slow melt seasons since 2007 had slow early melting in the Beaufort and this year does not. I suspect that is going to help eat into the Chukchi positive anomalies quickly over the next few weeks. 2008 which was mentioned above could give us a good clue. That year had pretty high area in Chukchi/ESS in June but the Beaufort was low. That year ended up close to the middle of the pack in the post-2007 context.
-
Slow start to the season for melt in May so far. The updates will be more interesting as we get into mid-June. The next week looks pretty slow too except up in the Laptev where some warm air could start eating into the pack there and create meltponding. The Beaufort looks a bit vulnerable this year, so if a dipole pattern can set up, then we could see a chance to make up some ground since the Beaufort/CAA region is always crucial for trying to go big in a melt season.
-
Kind of sucks we cleared out near sunset but the numbers don’t look that good. Maybe we’ll spike back up later into the evening but it seems the best might be closer to morning and clouds may be a bigger issue by then.
-
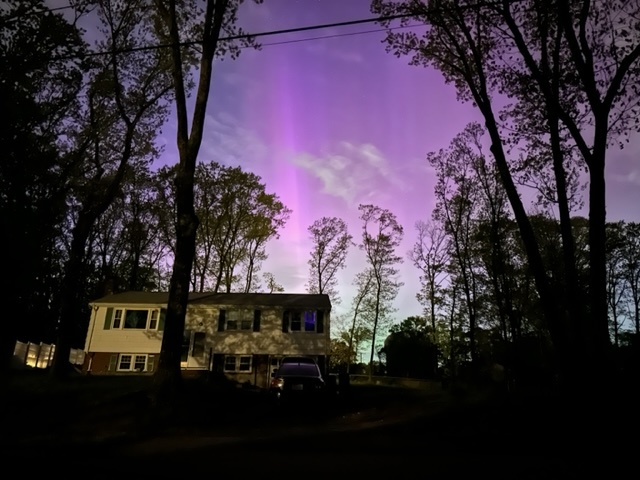
Here’s a pic we got. Obv exposure-enhanced but that pink/purple pillar was very visible with naked eye and the glow around it actually got decently bright for a couple min. The green lower down you couldn’t see with naked eye.
-
Just got back from going to top of the street where there are no street lights. Could see a pillar very clearly. Lasted about 5 min with naked eye before fading.
-
Yeah that was a quick spike. Maybe we can shoot it to a new high if it has some momentum. Bz is down near -45 right now too.
-
I remember in Mar ‘97 when I would go to my cousins’ place in Princeton you could see the tail going almost halfway across the sky. It was awesome. Back down in Worcester the light pollution made it only a very short tail.
-
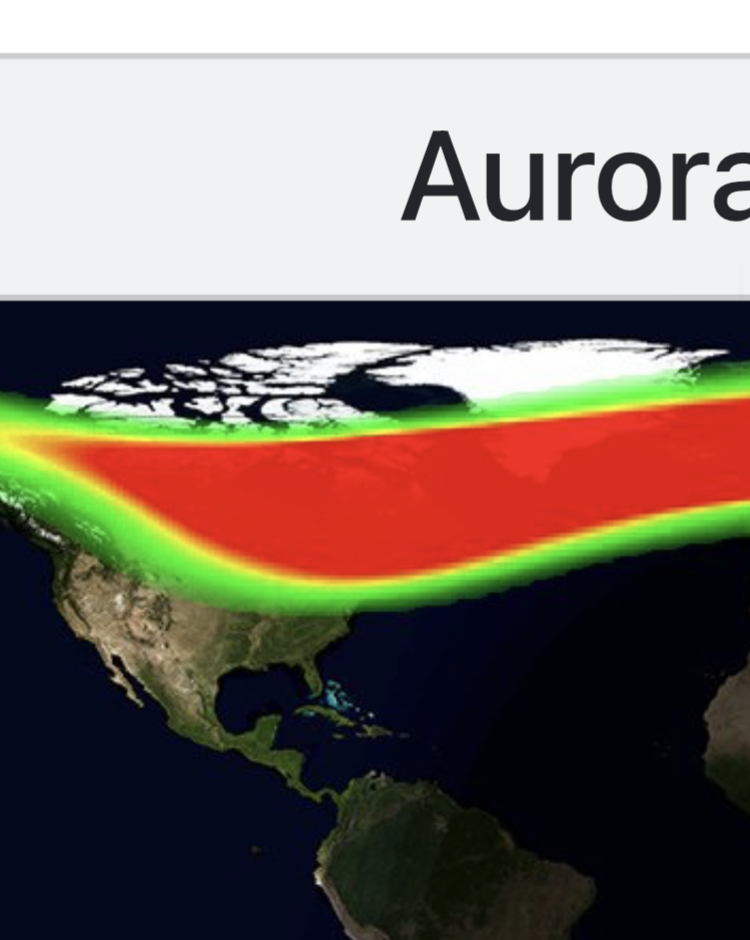
Link I posted earlier updates fairly quickly. https://www.spaceweatherlive.com/en/auroral-activity.html someone may have an even better one. If they do they should post it.
-
Kp index falling quickly again. Hopefully next wave hits once it’s really dark.
-
I feel like it’s gonna be hit or miss for a while. The skies are def looking decent facing northeast right now here but there’s still a lot of crap around in all other directions.
-
Should be able to see it as long as you aren’t in downtown I think and the clouds cooperate. Kp is 9 now with a Bz of -43. I’ve never seen those numbers before since I started following loosely in the early 2000s.
-
These numbers are crazy. Numbers aside, I don’t think I’ve seen the auroral oval this far south on their maps.

-
Not sure I’ve seen these numbers happen at night since October 2003. Did we achieve this in Nov 2006? My memory is hazy from that event but I feel like it was a bit short. I remember not seeing anything in ‘06 but I could see it pretty easily in 2003.