raindancewx
-
Posts
3,953 -
Joined
-
Last visited
Content Type
Profiles
Blogs
Forums
American Weather
Media Demo
Store
Gallery
Everything posted by raindancewx
-
Canadian said super torch for March in the NE again today. Canadian called it last year too nearer to March. We haven't had a wet March where I live since 2007, so I'm begging you people, talk to your weather gods: let New Mexico have our March trough back. We like snow in March out here, it's our best snow pack month. Last March was particularly infuriating with the snow in Guadalajara/Jalisco, the blizzard in Denver and not even a drop of rain here.


-
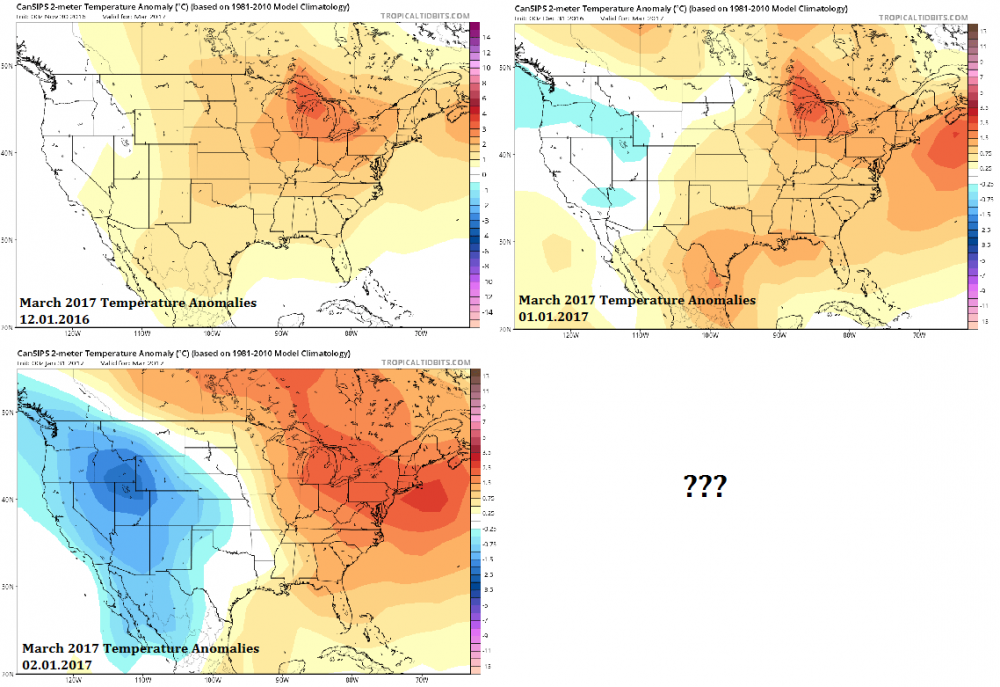
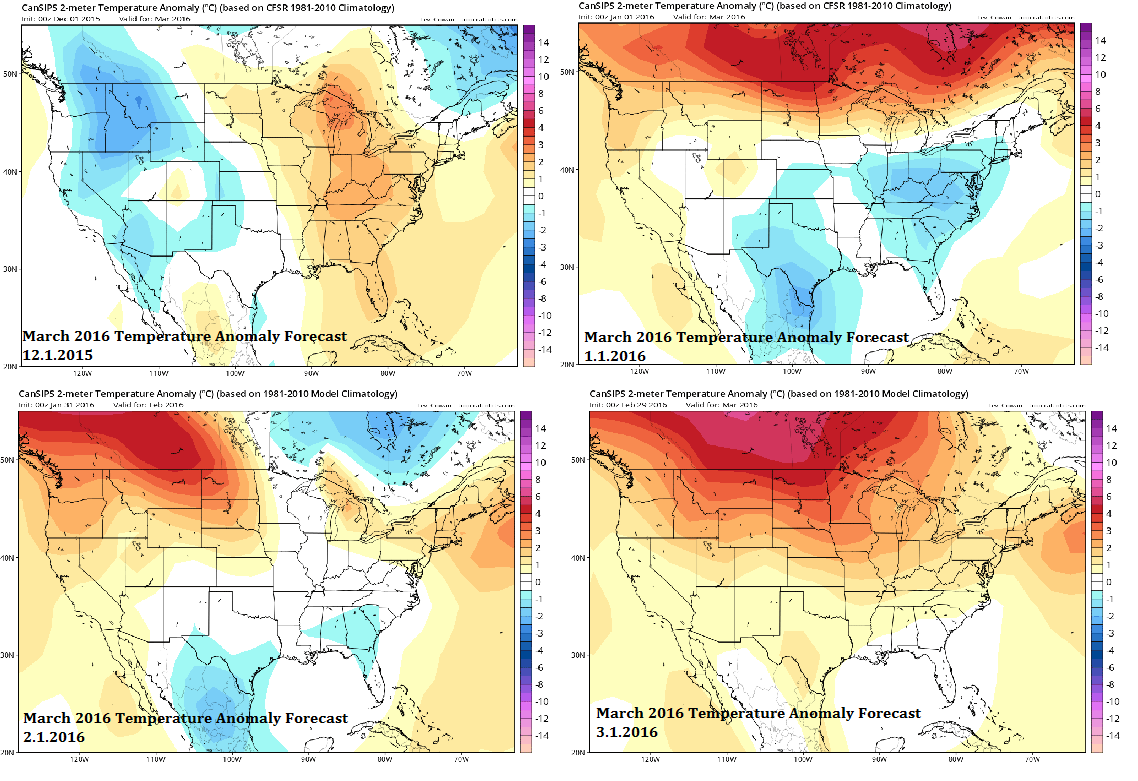
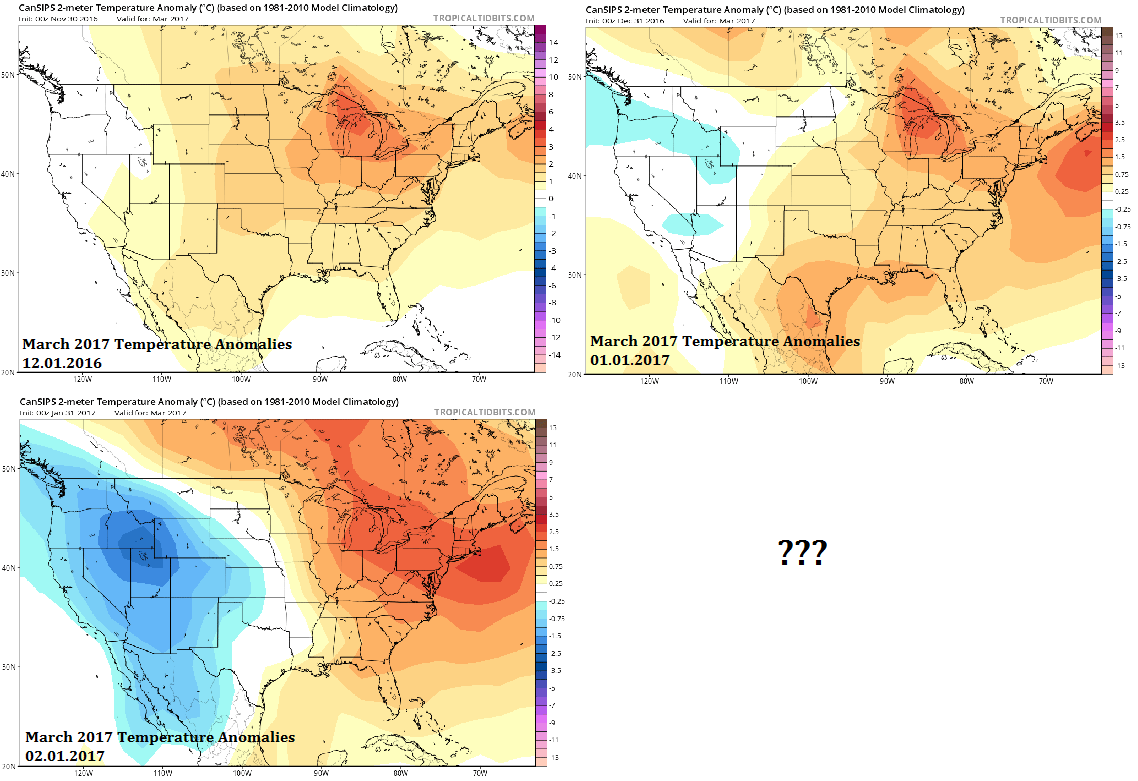
It's interesting looking back at the Canadian last year. Initially (Dec 1 2015) it had the West cold in March, and then it trended warmer each month, until realizing on March 1 that the whole country would blow torch, which happened. This year initially (Dec 1 2016) it had the West warm, and has been trending much colder, with the East warm each run. The Canadian is fairly useless for precipitation, but it does OK with sniffing out the cool/warm split, an area that trends blue/red tends to show up as white initially two months before as it tries to figure out anomalies, and then it tends to fill in as red/blue right before the month.

-
The Canadian came in - trended wetter/drier for New Mexico in February...but interestingly it did trend much colder in March. Has no wet months in the Southwest for six months...which I don't buy.
.thumb.png.399920ef5699b77863a25618bc763d7b.png)
.thumb.png.6739aad8d2126b64c2c37481dcf97c59.png)
-
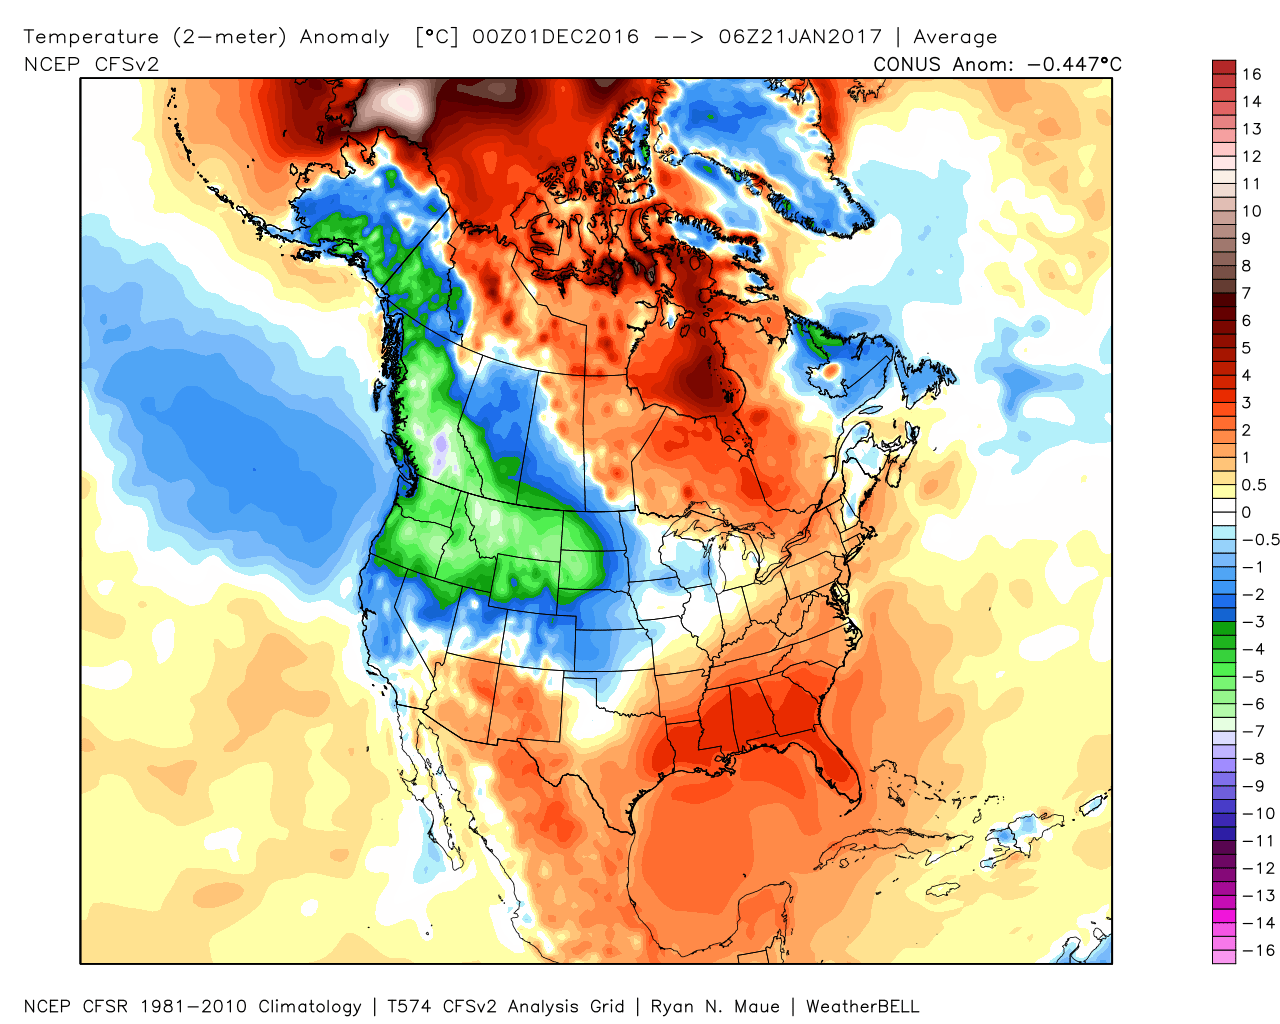
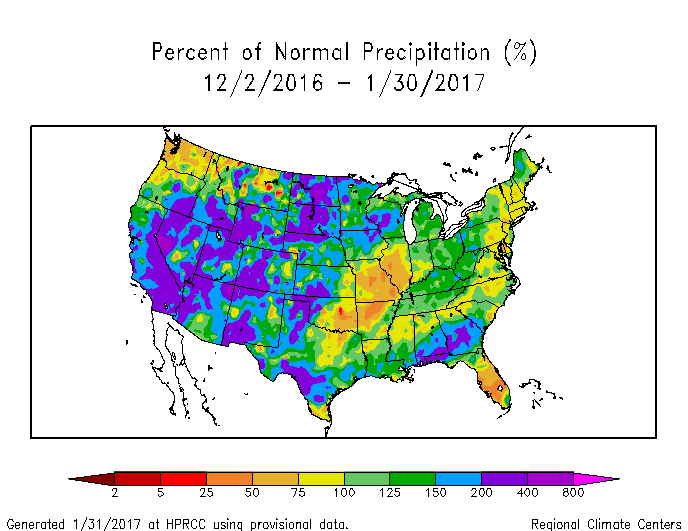
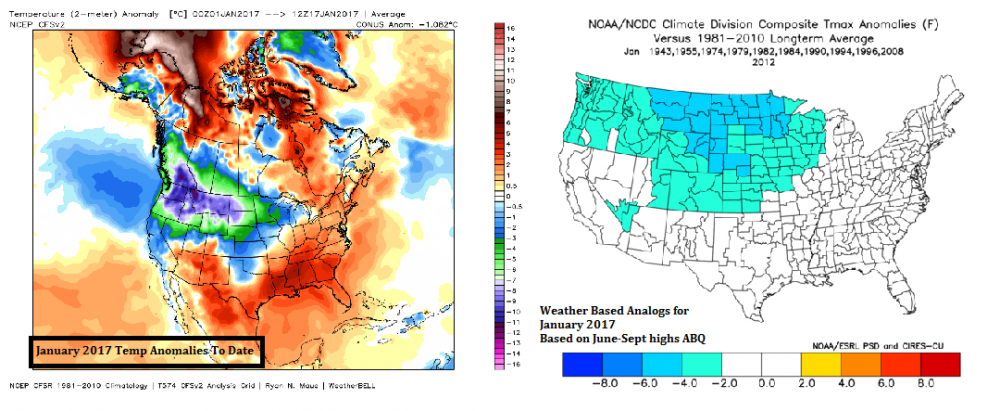
Winter to date - temperature anomalies. I didn't have the cold centered far enough West (pending February of course), but I did have the entire East warm. That looks good. Had the cold centered on eastern Montana not western Montana. I did have California wet, north of Los Angeles, kind of proud of that given all the "warm and dry" forecasts in the SW. The entire West has either been cold (NW & CA) and/or wet (SW). Not the usual doom and gloom La Nina / Cold Neutral winter out here.
-
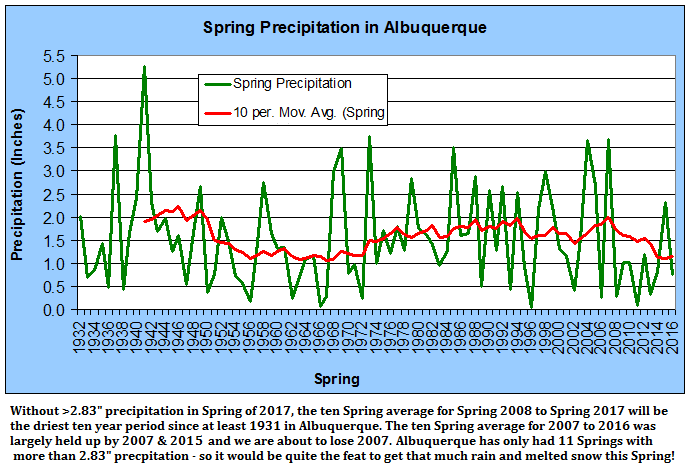
I realized the other day that if Albuquerque and much of the Southwest doesn't get near-record precipitation this Spring, it will be the driest ten-Spring period on record. For Spring 2007 to 2016, we're just above the lowest ten year period on the backs of 2007 and 2015 which were wet Springs. But we're about to lose 2007. So we need >2.83" precipitation in Spring 2017 to avoid having the driest decade of Springs on record. We've had ~7.86" precipitation from Spring 2008 to Spring 2016. Mean is 1.54" per year...so 2.83" would only get us to match the low point over a ten year period, and that level alone is nearly top ten for wetness, and over 80% above the long-term mean. Spring precipitation trends have beens very different from Winter here. Winters are ~25% wetter or so against the beginning of the period of record, while Springs are a bit drier.
-
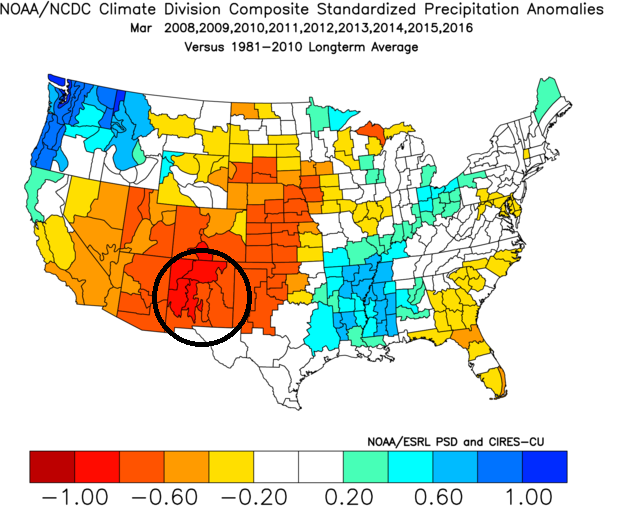
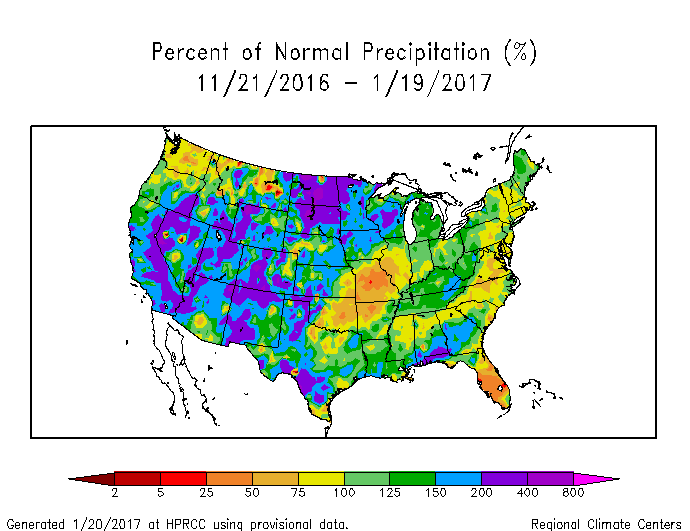
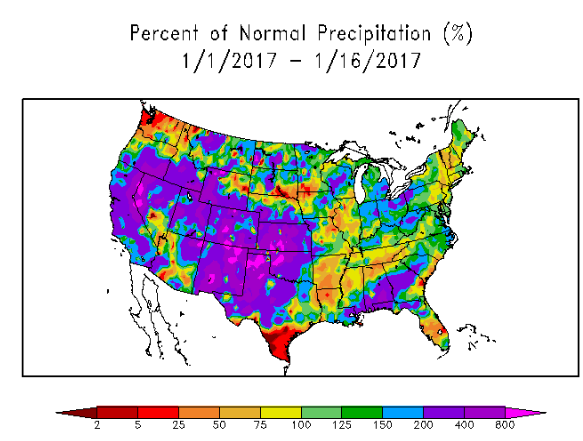
Just for kicks was looking back at precipitation maps in January in the West ~2 years before the solar minimum year and you have a similar pattern. Very wet in Northern California, somewhat wet in much of the West, dry in parts of the Ohio Valley and Southeast. Solar controls the QBO to some extent.
-
The European has had snow for San Angelo since Tuesday guys Don't know the implications for the rest of the country, but expecting it to be wet in the Southwest for at least part of the Spring. March is the wildcard. Probably warm though. Have to say, I'm looking forward to the Canadian update for February, seeing lots of mixed signals for everything. March is probably a split of the Dec/Jan pattern. February might be the Nov pattern though...but with more cold.

-
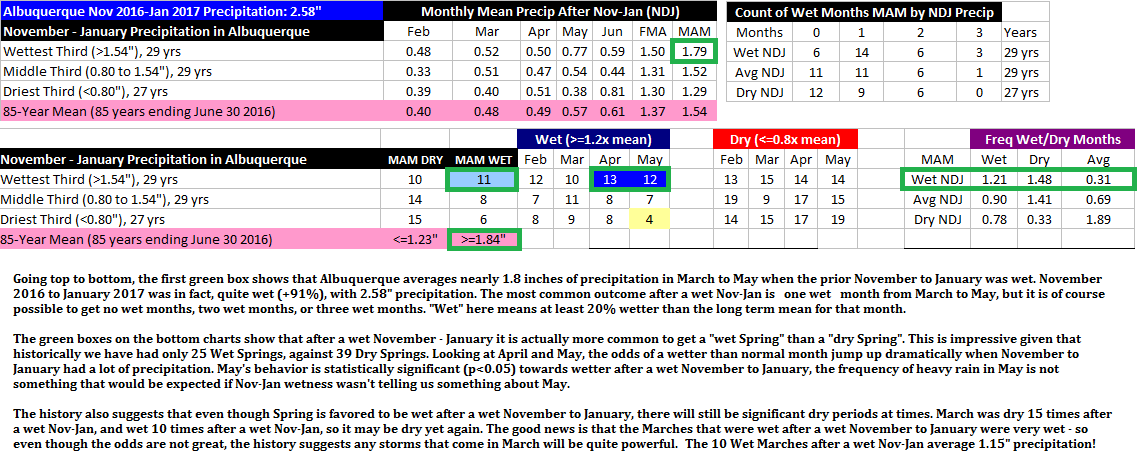
Was doing some research earlier - when Albuquerque has more than 1.54" precipitation from Nov 1 - Jan 31, we are slightly more likely to have a Spring at least 20% wetter than normal than a Spring at least 20% drier than normal. We had 2.58" precip from Nov-Jan, since it won't rain/snow the rest of the month. The least likely outcome is a Spring within 20% of normal. Wet Nov-Jan Wet Spring: 11/29 Dry Spring: 10/29 Moist Spring: 8/29 Believe it or not, the wetness in Nov-Jan offers essentially no clues on Feb-Apr wetness. The seven Nov-Jan periods w/in 10% of the observed wetness Nov 1 2016 to Jan 31 2017 averaged 1.53" precip for Feb-Apr, and 1.87" precip from Mar-May, i.e. a "wet" Spring (>1.2*mean) and a moist Feb-Apr. May after a wet Nov-Jan is almost 70% wetter than May after a dry or near normal Feb-Apr, only month where it made a big difference.
-
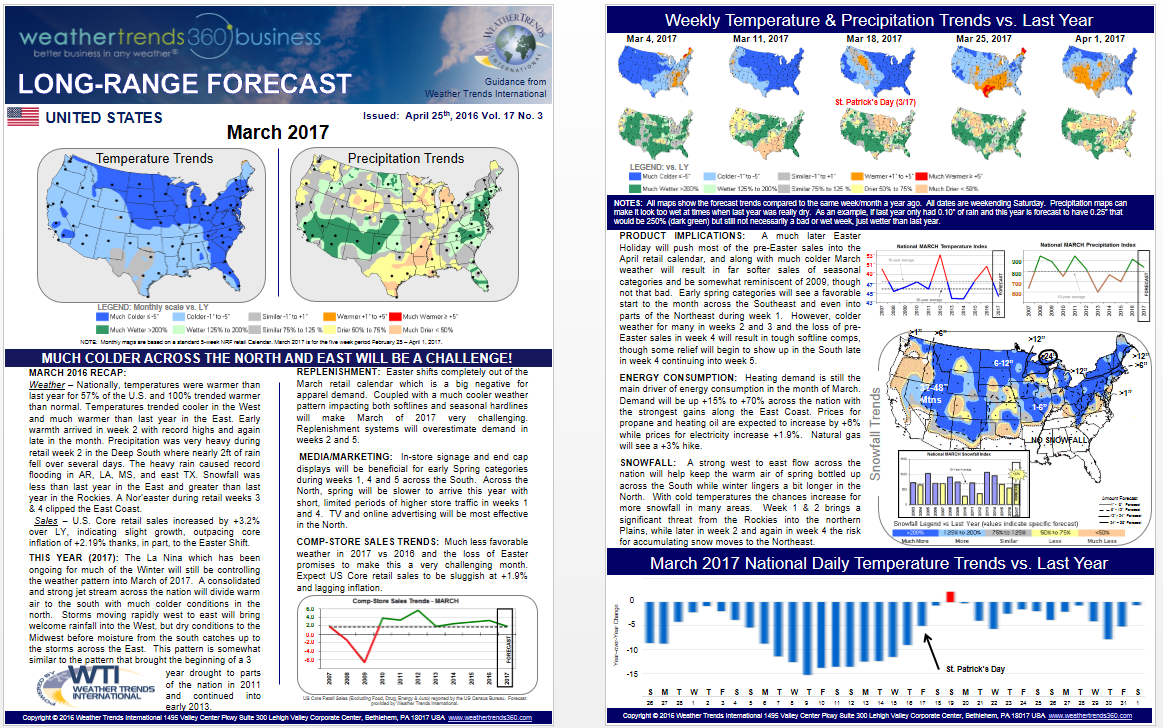
You guys may want to look at WT360 has for March (Jan 23 Captain's Log). Much wetter/colder than last year.
-
Do any of you follow Weather Trends 360? They have a pretty impressive track record for timing long-range precip/temp anomalies. They have 6"+ snow in March in Albuquerque. Almost the entire country 1-5F below last March (when it torched). Texas drier than last March. They have NM >=2x wetter than last year...but that isn't saying much, it basically didn't rain or snow the entire month. I've put the image below. Snowline is into the Texas Panhandle in March.

-
Nice and cold here. My forecast from October had 2-3 major 5-10 day cold snaps of 5-15F below normal in New Mexico after Jan 15th, so far so good. 1/24 to 1/28 is going to be around 10F below normal for most of the state. Will wipe out much of the warm anomaly for the month here.
-
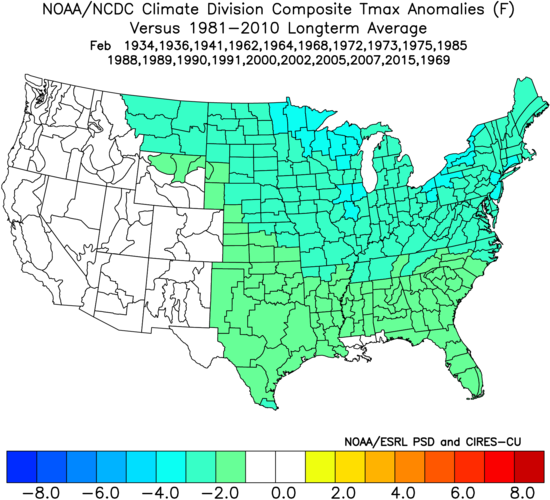
I'm pretty sure February will have some incredible cold shots in the middle of the country. Generally speaking when August is cold here it tends to be very cold in the middle of the US in Feb...and it was cold last August. It tends to be very cold East of the Rockies when Albuquerque is cold in August (see image). For what it is worth, the local NWS agrees with you on the progression, they think it is coming sometime late week one of February with changes in the Gulf of Alaska.
-
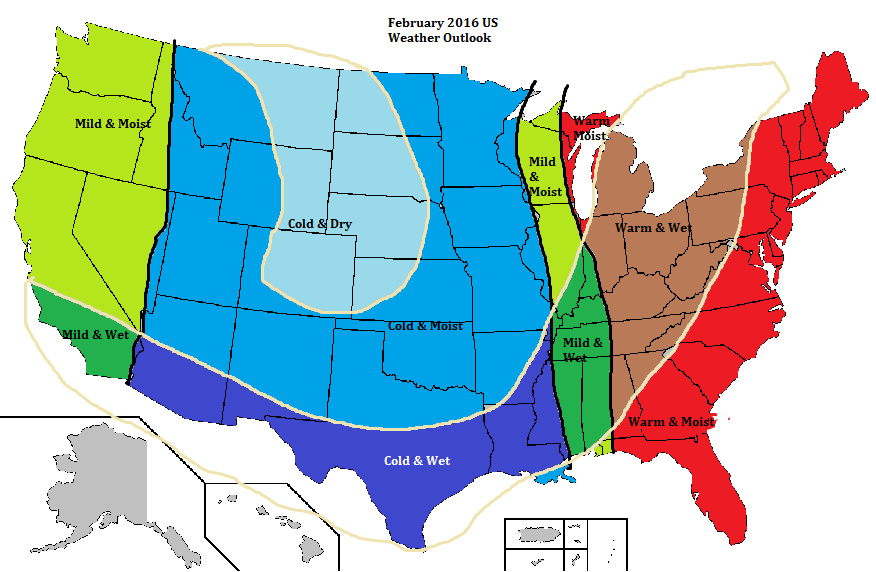
My original idea for February, the first image was for it to be cold in the middle of the country. Still like that, but it's probably centered further north than I had it.
-
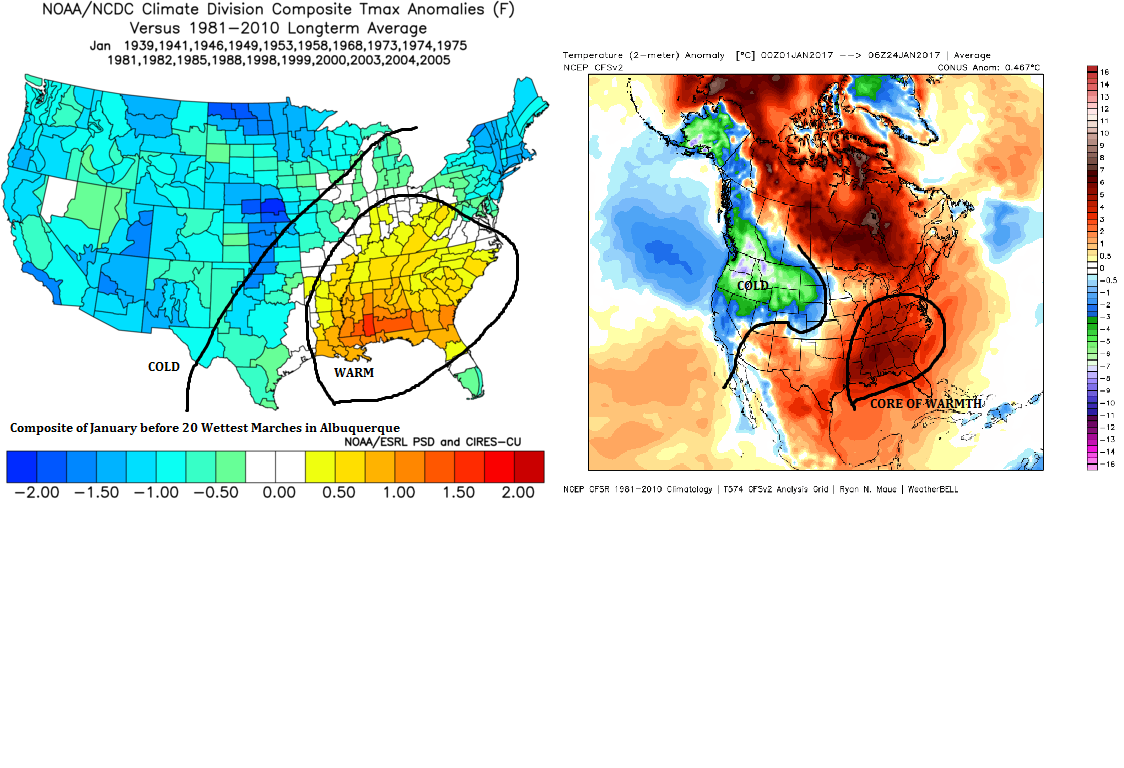
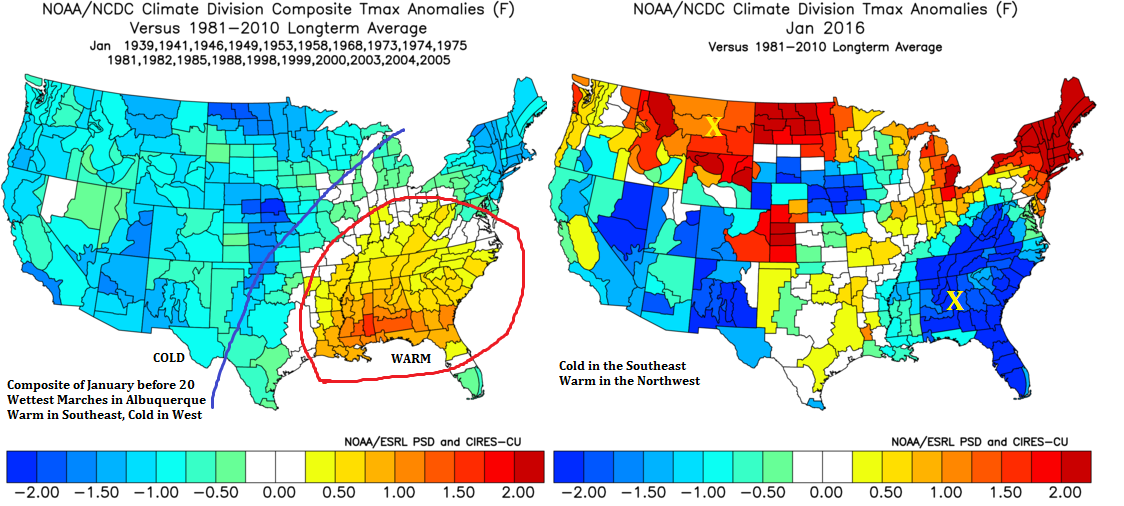
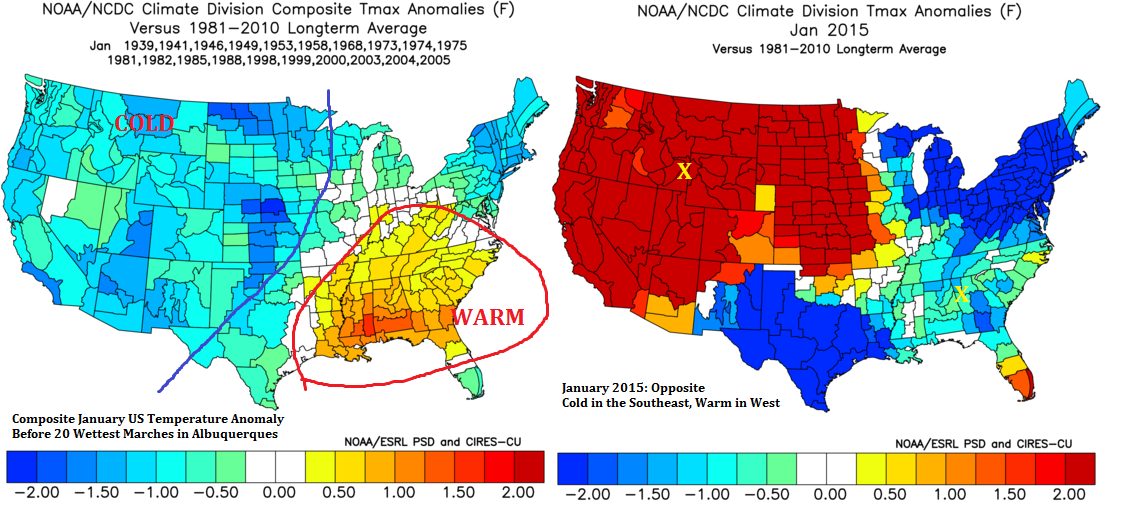
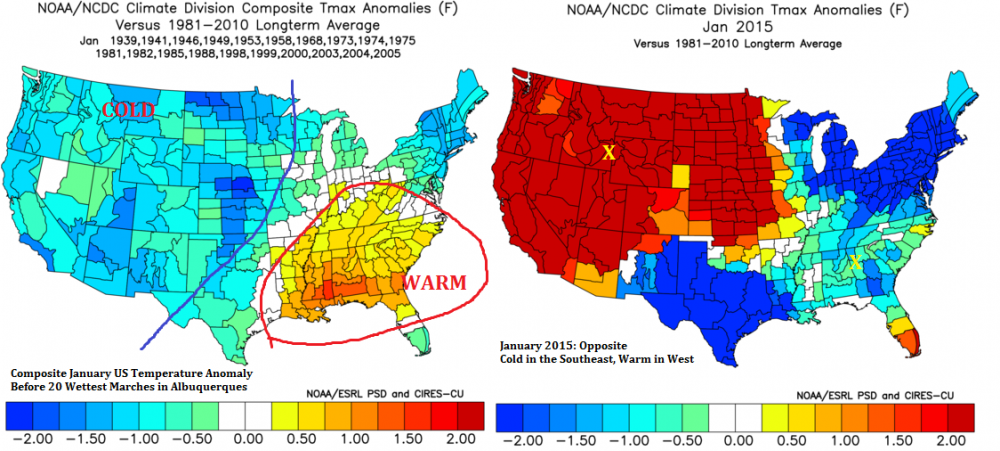
I think this might be the first wet March in New Mexico/Arizona since 2007. Look at January temperature anomalies ahead of the 20 wettest Marches v. the last two years (El Ninos) and then this year. The composite "super warm SE, coolish West" signal is readily apparent in 2017, and that is the signal for a wet March here.


-
I've been trying to figure out what to expect in Spring but the AMO/PDO/ONI configuration doesn't really support any huge areas of anomalous cold/warmth at the moment. Looks fairly wet again in the West, dry in the mid-south, with the exception of maybe April.
-
I have a long standing theory that there is some kind of major storm here around Feb 1 give or take a couple days, but it isn't showing up anywhere on the models, so may be wrong. Santa Fe will likely be in the 40s during the day and pretty cold at night. The mountains will be pretty. Been a top ten January out here for precipitation. There is more snow coming tonight into Tuesday morning. All the ski resorts have a lot of snow right now. Even Ski Cloudcroft which is south of Ski Apache and only 9,100 feet up has a 28 inch base. Ski Santa Fe has 80 inches right now. We seem to be having a bastardized version of the wet & warm weak La Ninas, cold Neutrals out here. Super wet, not really cold. Unfortunately, I think the wetness is going to break for a while in February. I'm starting to think this may be the year we end our decade of dry BS Marches in Albuquerque though.
-
Have you guys seen this? A meter of snow in the Sahara. https://t.co/Kbh5hSeuwz The 1978-79 analog seems to be working...in the Sahara.
-
This was a pretty interesting read from Larry Cosgrove earlier, regarding February. He's been pretty consistent since November in thinking it could be a crazy month. https://groups.google.com/forum/#!topic/weatheramerica/lqwBkN3XVkM Here is what we do know. The hue and cry over La Nina has given way to the realization that ENSO is as neutral as can be. The Madden-Julian Oscillation continues to each ever slowly eastward, now resting in chaotic fashion over the Maritime Continent and western equatorial Pacific Ocean. As long as the MJO is percolating and feeding both the polar and subtropical jet streams, apparent weather in North America will be mostly cold, and quite often stormy. Snow cover is most dense through northern/central Eurasia but is at near normal levels in Canada and the U.S. The January Thaw influence in reducing the continental snowpack has so far been fairly limited, especially over the West Coast and Intermountain Region.Put these trends together, and the weather map for February 2017 looks similar to December, but with the cold dome set a bit more to the south and east. The colder transition occurring during the new week should last until the first day or so of the new month, so January mean temperature anomalies will not look as warm as is the case between January 1 - 20. Precipitation is again a tough call, if only because of the tendency for systems to avoid the West Coast and dig into Baja California before ejecting. In a -EPO scenario, the disturbances would eject through Texas, pass through the Deep South, and ride along the Atlantic shoreline. That more suppressed south and east trajectory will favor more snow at lower latitudes, probably affording the Eastern Seaboard cities their first chance at significant snowfall. The potential for such an event is sooner than you might think.If you accept the CFS series depiction of the 500MB flow, but avoid the warm bias of the 2m temperature anomaly forecast, then the skew of a warm/dry West vs. cold/stormy Central, East alignment is evident. Alaskan blocking signatures occurring in tandem with -EPO or +PNA styled ridging can help to deliver far-flung cold intrusions that can reach Mexico and Florida. A potential for a deep closed 500MB low in western Ontario also allows for an active storm track with the cold air. I can see the possibility for the Old South and Mid-Atlantic states falling under a mild/moist regime around February 4 - 7 with a brief resumption of a subtropical high across Cuba and the Bahamas. But another hammer of cold event should return soon after. The western states, much of the time under ridging, may finally take on a milder and drier pattern. This after a major assault of storminess and cold from disturbances digging south from Alaska.
-
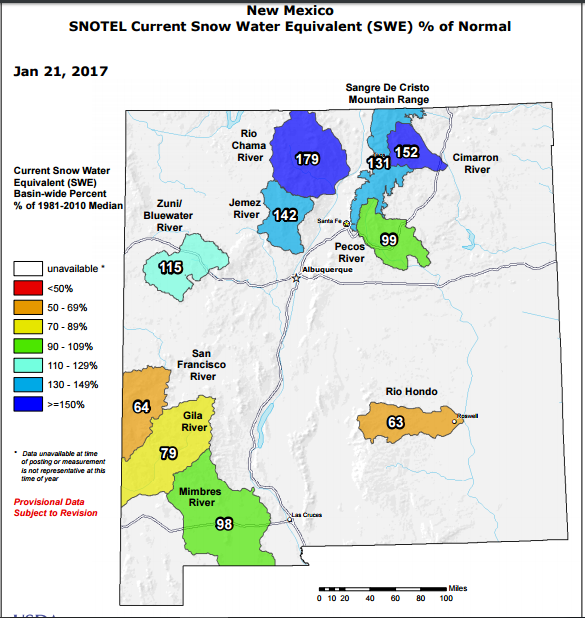
I'm pretty sure this the highest our snowpack has been in a long time - almost all the mountain ranges are near normal to above normal now, and February doesn't exactly look warm here either. A lot of my analogs had the intense cold centered on Montana - that looks pretty good so far. Florida is absolutely roasting this winter.

-
The dryness in the NW to me implies that the battle between the PDO+ (which favors dryness/heat up there) and La Nina (which favors wetness/cold up there) has been pretty even. The entirety of the West seems to be splitting the difference between the PDO+ effects and the La Nina effects. La Nina winters are warm here - and we have been. But they are dry too...and we haven't been dry at all. The PDO+ favors wet...but mild/cool. We've been wet but warm.
-
Been pretty wet these last two months. I had the East Coast dry this winter - not sure if it will work out, they seem like they will have a couple decent storms the next few weeks, but it has been decent the last 60 days. My fear for the Spring is the whole pattern shifts north 200-500 miles and we roast down here. Hopefully it won't happen until April/May though.
-
I was doing some research the other day using a Z-score calculator for a differences in proportions, and if you use an 11-year filter (sunspot/flux cycle), there are definitely clusters of notable weather events near certain parts of solar cycle here in Albuquerque. Used a p value of <=0.05 with the cluster in question compared to all others. In other words, was trying to see if "low probability events" become meaningfully more likely in a given solar year. I defined solar years as x+11, for each year from the 1930s to now, and then compared frequency in the cluster to all others. Most of the stuff I looked at didn't show a meaningful difference but some stuff did. Low sunspots - frequently cold Jan - Apr. My math suggests we are in "year nine" of the solar cycle. Years 11 to 2 - and the cycle is 1-11, with 1 following 11 - tend to be remarkably cold in Jan-Apr at least once. I set 1931-32 (July-June as year one) with 1941-42 (July-June as year eleven). My threshold for cold or warm is mean high 1931-2015 +/-2F - so you're essentially looking to see if something you'd expect to happen 20-30% of the time, given the hypothesis the sun has no impact, instead happens 80-100% of the time in the cluster, and it does in a few cases. Anyway, the sun controlling the NAO/blocking or whatever seems to have notable impact here Jan-Apr for making us cooler. For precipitation the pattern was really interesting here - odds of "meaningfully" different clusters of dry/wet years exist in all periods of what the sun does. The three years heading into the solar maximum, July-Sept are very wet - but it goes in order, July initially (further from the maximum) then August, then September right in the July-June maximum year (i.e. we had 3.97" precip here in Sept 2013, solar peak was Feb 2014). A similar but slower pattern happens in the cold season - November is wet near the solar peak, then January a couple years before the minimum (i.e. now - and sure it's been very wet!) - and then Feb/Mar are very wet at and just before the minimum. September & April tend to be very dry just after the maximum, I think 7 of the 8 Aprils had no precip at all. Also looked at odds of getting 3 inches of snow by month and cluster, to see if there were solar effects. January and April both came out as notably more likely (p<=0.05) to have >=3" snow in year nine here, which is this year. We've had a ton of rain this month, but not much snow yet - still possible though with three little systems coming in the next week. April has only had >=3" snow in six years, so it was cool to see 3/7 in pattern 9...given there are 11 patterns and given that is only snows here in April a quarter of the time! February, which is both cold/wet in pattern 11 (the year before the solar minimum) had a huge snowy cluster (5 of 7 years with 3-11 inches of snow...against 14 of 78 instances of >=3" snow all other years) in pattern 11 - so that should be fun in two years.
-
The Weatherbell guys updated their February forecast on the 17th - they have OK 1-3F below normal in February, with the areas of TX right next to OK around 1F below normal. Rest of TX, other than El Paso area -1F to 1F. They have an area centered around the OH/IN border 5F below normal. Immediate West Coast, Southern NM, Southern AZ all +1F. Probably 80% of the country -5F to 0F below normal. My idea for February was that the cold anomalies would look like August, maybe they center between the Continental Divide and the Mississippi River, but we'll have to see. Been pleased with how my "weather based summer analogs" have handled January so far.
-
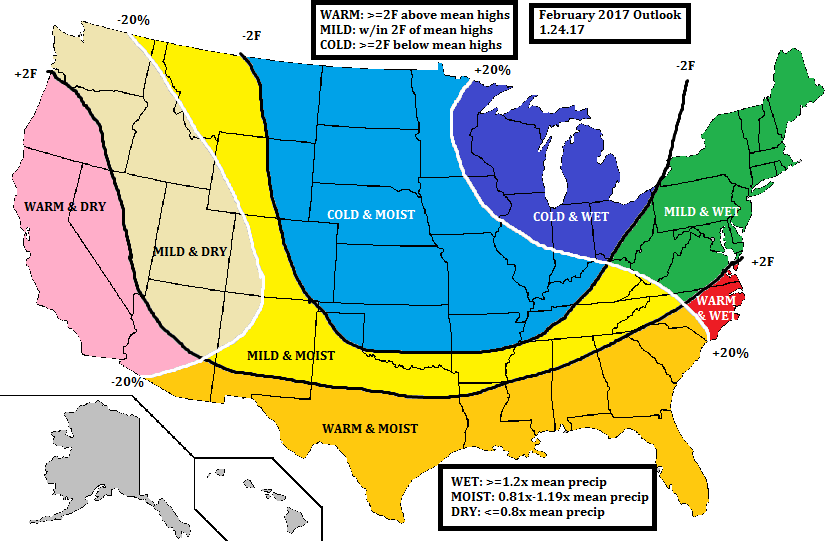
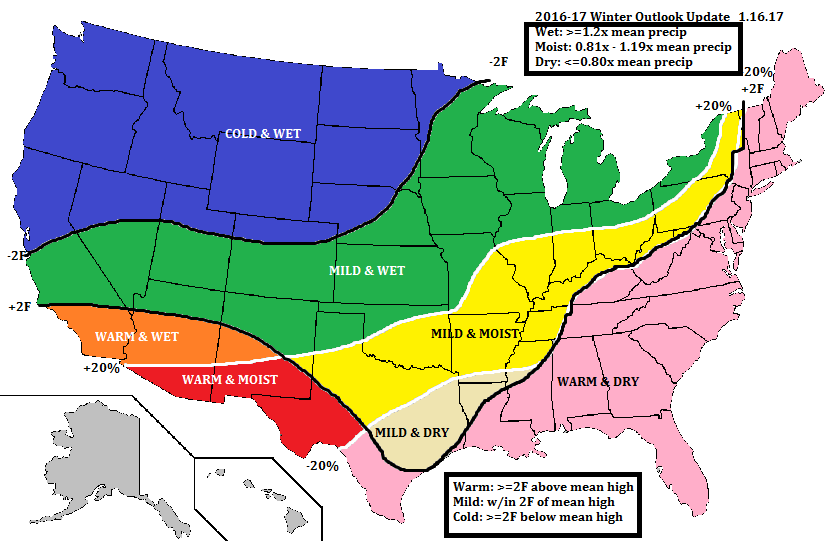
Given the realities of the temperature and precip anomalies so far this winter, I changed my winter outlook map to show a mild/wet winter in the Southwest. Also don't think the cold can be wiped out in Montana, it's been frigid again up there this month. Cold to me is mean highs >=2F below normal, Warm is mean highs >=2F above normal. I don't really look at lows, since most populated places have strong urban heat island effects and will just about always be "warm" against a long term mean. Mild is in between +/-2F Wet is >=1.2x long term mean precip, Dry is <=0.8x long term mean precip. Moist is 0.81-1.19x mean. Unless we get less than 33% of normal precip (<0.6" * 0.33 for ABQ) here in the SW Jan 17 through Feb 28, this is going to be a wet winter. Already too wet to be "dry". Can only be moist or wet at this point.
-
The 1931-32 to 2015-16 mean precipitation in Albuquerque is 0.80" from Dec 1 to Jan 15. We had 1.31" (+64%) this winter, close to a top ten amount...and yet hardly any snow. Been both warm and wet. Suspect it will get much colder in the coming days/weeks though relative to normal. We're actually already guaranteed at least a near average winter here for precip now - 1.31" is just about the Dec-Feb average already. Any rain/snow of any consequence will push us above to well above average for the winter. My view is the La Nina/warm AMO are firmly in charge for warmth here, and this is now fairly likely to be a +1F to +3F winter by mean highs against the 85 year mean, but the PDO+ is fighting the La Nina hard on the moisture side of it. Halfway through the winter we're already wetter than all but nine of the past 26 La Ninas. The 10-mountain basins in New Mexico are actually 3% above normal right now, which is amazing too. Even the Sandias got over a foot of snow with the last system. You can fly into Albuquerque and be at a fully functional resort within 40 minutes.


.png.885a196f6eb85bb490393fda070d48cd.png)
.png.4a39eb747241fae6820b5e6b59221252.png)