
paulythegun
-
Posts
808 -
Joined
-
Last visited
Content Type
Profiles
Blogs
Forums
American Weather
Media Demo
Store
Gallery
Posts posted by paulythegun
-
-
Since I babbled about it a few times on here, figured I'd follow up: almost nothing much fell in Davis, WV. We had some light sleet mixed with rain.. Fringed.
-
 1
1
-
-
Here's the latest update from the Clownmap Weather Authority. 1,000,000 people affected!

-
 1
1
-
-
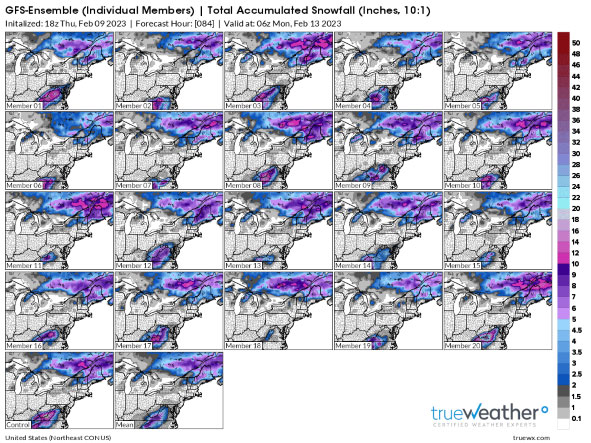
This is mostly ice. Hour 84 GEFS probably....not particularly useful. Still. Some BIG TIME clownmap hits here.
-
 2
2
-
-
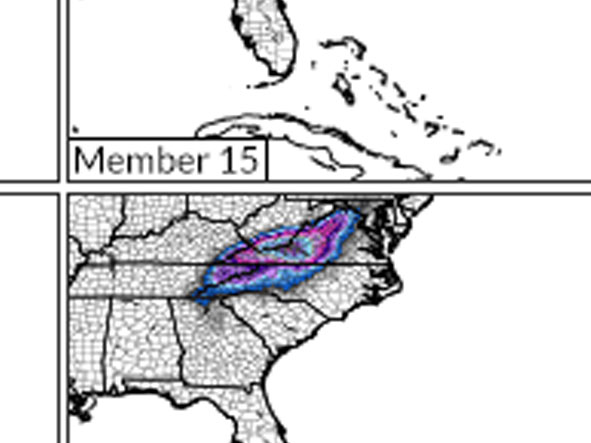
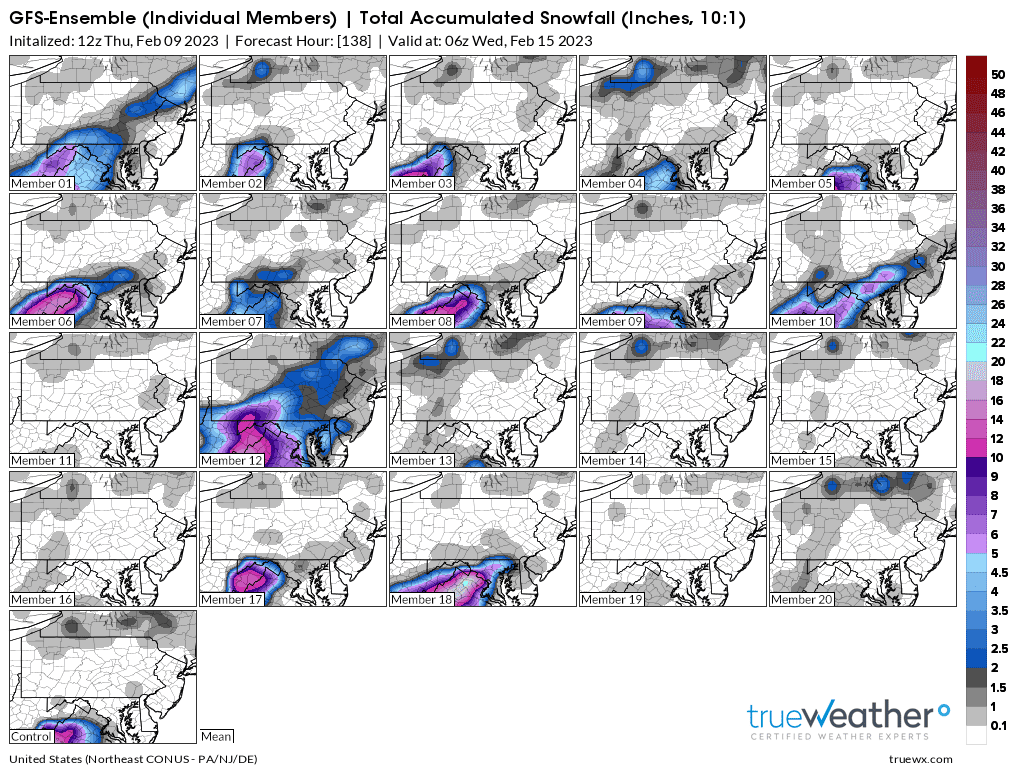
Individual members on GEFS are kinda awesome (this almost doesn't seem real...), though I assume this is a ton of sleet being turned into fake digital snow:
-
2
-
-
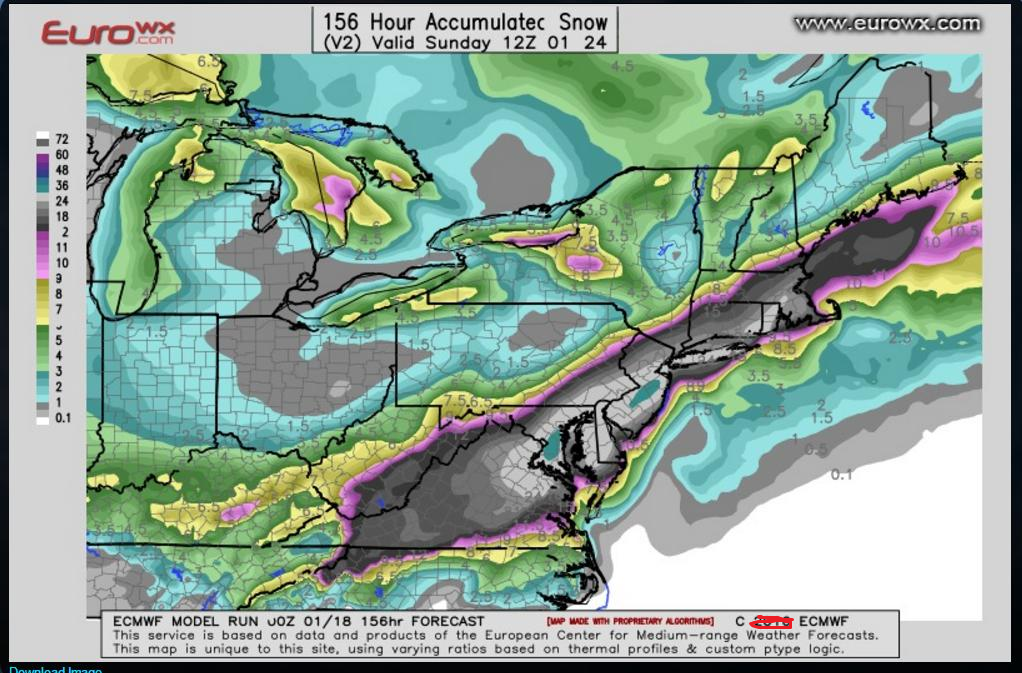
Key points from the 12z Euro for DC:
1) Probabilities (my own):
- 50% chance of soul crushingly awful rain.
- 50% chance of the THREAT of horrific cold rain ruining all social plans and then missing us barely to the south.
2) Zero snow for the mountains or really anywhere outside of SW VA.
3) All hope lost.
4) Might as well jump.
5) Go ahead, jump.
-
2
-
3
-
31 minutes ago, clskinsfan said:
RGEM slightly warmer than the NAM and comes in with a little freezing rain before the flip to 33 and rain. Miserable.

You will never find a more wretched hive of warm air in February.

-
1
-
-
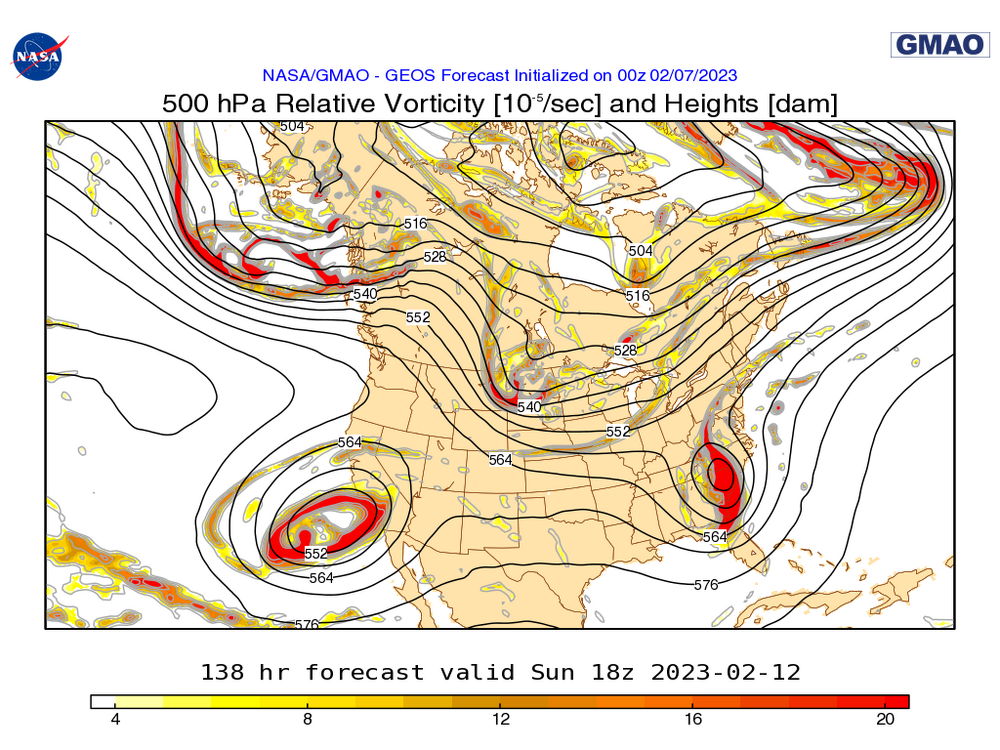
One annoying trend is isobars pushing further and further south from Quebec, squashing the vort after it slowly meanders toward a decent position to our SE. You see this monster amping up on the euro and it kinda falls half apart when it reaches out region. Then the progressive flow behind it shunts it out to sea.
I've seen storms close off, go berserk, mature, and then fall apart on guidance all the time. Long range GFS is a fan of doing that. Usually occlusion is the end result. Particularly late winter. But I don't remember the last time I've seen it happen in real life to our region. Usually it's a new England thing. Maybe I just need more experience tracking closed off systems taking a southern track and then pushing into a warm air mass. This really does feel like a "first week of April" kind of thing.
Am I wrong that this whole progression is kinda unique for February? Late Jan 2011 keeps popping on the analogs, and someone made the point the other day that usually we just ignore perfect track rain storms but I don't remember this situation being a common one..
-
1
-
-
-
18z GFS weaker, slower, further south. The column is BONE DRY sunday night at DCA. nothing even reaches the area.
 LOL
LOL L
L
-
2
-
-
JUST UPGRADED TO "LIMITED THREAT" for Davis, WV!
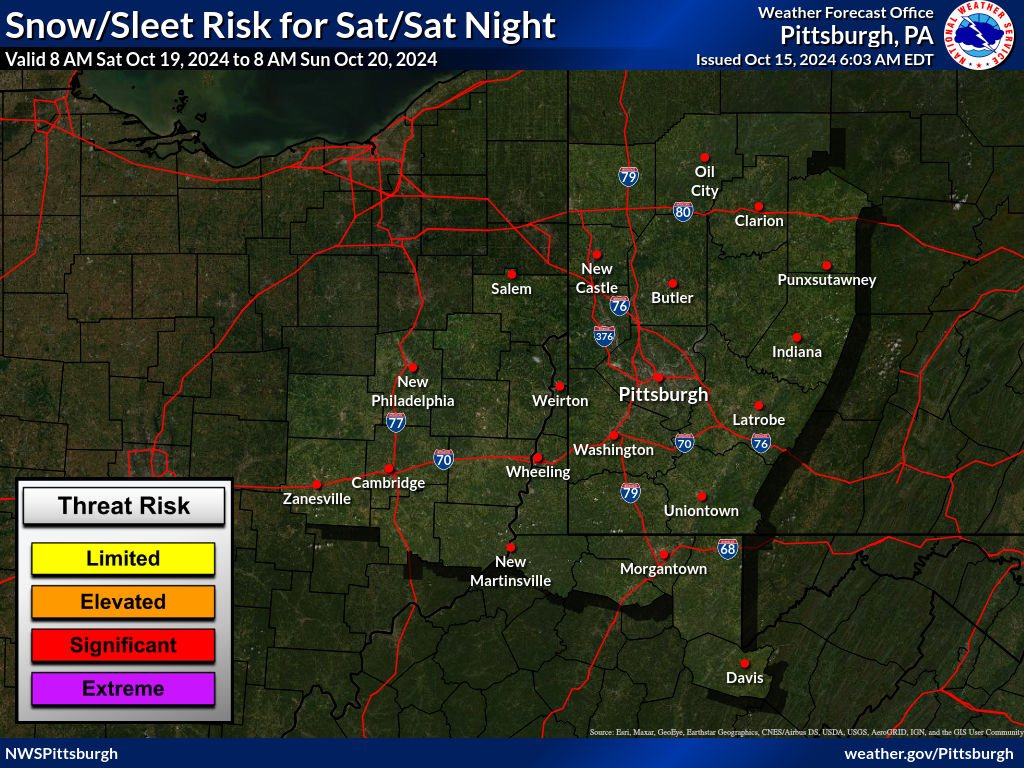
Reminds me of when the Bluth Company was upgraded from "Don't Buy!!" to "Risky!"
-
4
-
-
Most of the amped up solutions deliver an absolute crush job to Canaan Valley - particularly the peaks. While some of the weaker ones have a sharp cutoff of the precip...lots of nasty ice. This forum is allegedly about WV as well, right? I bet a good number of us will be there this weekend (I will).
-
Detroit's latest average went up about 2" as well.
A sub-climo Winter is frustrating to any snow weenie whether they average 5" or 105".
But sucky winters are going to happen, especially after snow records toppled like dominoes 2005-2015). Even since things have tamed down since that stretch, the past 5-7 years have been pretty average snow wise. When you look at the big picture, it's definitely not snowing less than it used to in our region. Which is why I wonder if it really is snowing less in the mid Atlantic or if it's just a bad stretch with no big storms (assuming big storms make up majority of their snow).
Warmer lakes frozen for fewer days = more snow for lake-adjacent areas.
Warmer east coast SST means fewer early season snowstorms for the Mid-Atlantic coastal plains-
1
-
 1
1
-
-
While GFS sniffed this out first, it’s still not a great model. As we get closer, don’t over-credit it for being first. Unless it shows something awesome again. In that case, I’ll delete this.
-
1
-
-
I don't trust the GFS. First it de-gifted snow, then it re-gifted, and now it's trying to use an upper-level trough as a springboard to a Superbowl sleet romp!!!
-
5
-
-
I'm spending the next 12 hours chasing. What am I chasing? I am chasing The Energy. It must be Sampled.
-
3
-
-
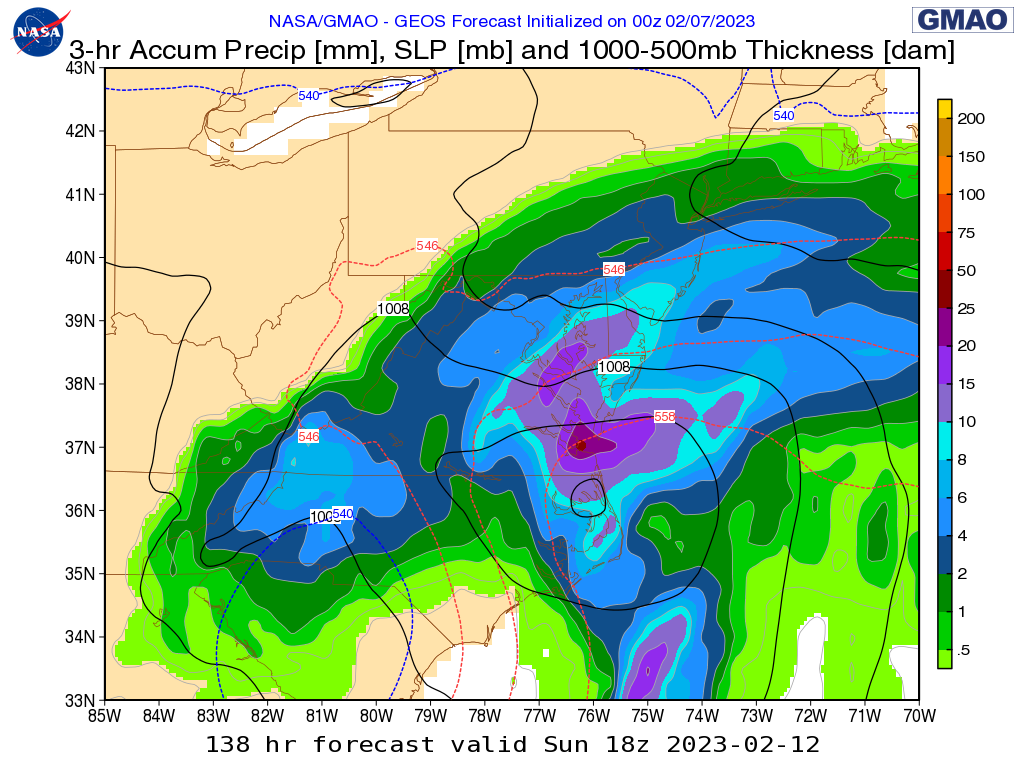
Now we wait for the King of Them All: NASA GEOS-5. Last night's run for comparison purposes:

-
1
-
4
-
7
-
-
-
Most of the other guidance now has a squashed wave to the south. Seems more plausible than this
.gif.e1d60db6e6c067f7047365b9e15f0dde.gif)
-
1
-
-
As it's Super Bowl weekend, my GUESS is that a ton of folks who don't already live there are going to be at the West Virginia ski resorts. I'm going to be in Davis, WV, myself. After total decimation of the snowpack by warm winds Thursday, worth watching the quick hit from the 2nd wave plus some short-lived upslope snow Saturday.
God Bless Lake Erie being melted. slight enhancement of upslope moisture.
-
On 1/18/2023 at 12:23 PM, psuhoffman said:
@Maestrobjwa I can't answer your question. It's hard to say exactly how much the base state has degraded. It's hard to know what a couple degrees would do. It's not as simply as "its 42 and rain so it would be 39 and rain". Changing the equation some could cause the storm to transfer to the coast sooner moving the whole boundary hundreds of miles after. A storm might not develop at all if its a little colder and the boundary doesn't have enough baroclinic instability to initiate the development. This isn't the best example of warming hurting our climo though. We always struggled to get snow from progressive wave patterns. It takes perfect timing for that to work here. The problem I have been alluding to is that recently what used to be a better way for us to get snow in marginal temperature regimes has been failing consistently because marginal temp profiles are now just flat torches. So now we are actually rooting for a pattern that frankly isn't really historically the best way to get a lot of snow here. But it's also a colder pattern and not a total no hope shutout one so people are rooting for this just to have a chance to get some snow. That's my take on all this.
Given that the ocean has absorbed a majority of warming, that's probably where the problem lies, if there is one. In terms of the boundary moving inland - you could see that having a huge impact early in the winter (going forward) before temps cool later in the season.
-
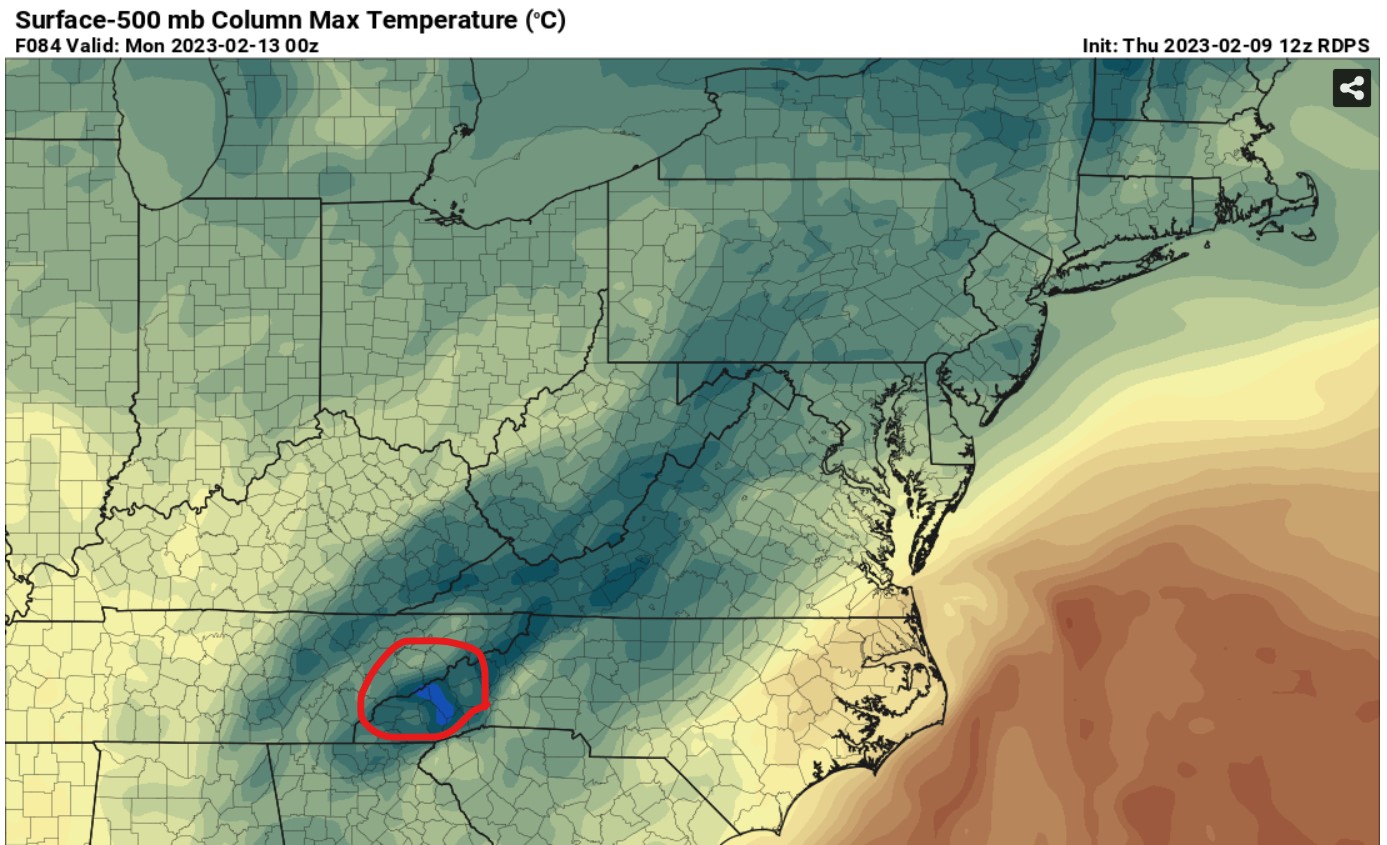
This looks promising!

-
9
-
 3
3
-
1
-
-
50 minutes ago, DarkSharkWX said:
Don't think so, at least in east Pacific, prob should ask someone else with more knowledge on that than me tho lmao
The dark Pacific is largely unknown to us and shrouded in mystery. Strange energy readings emanating from the ocean's surface hint at the possibility of advanced technology or even extraterrestrial life.

-
1
-
2
-
-
extremely light flurries confirmed in downtown dc, though you kinda have to stare at the road from 5 stories up to see them. It could also be dust mites swimming in my vitreous fluid
-
Violent flurries in Silver Spring confirmed by video sent by friend that has cursing and shouting so I won't upload it.
-
1
-
1
-

.gif.481301a9c2f230142a52aca3b250dd53.gif)
Late February will be rocking. February Long range Discussion thread
in Mid Atlantic
Posted