
paulythegun
-
Posts
976 -
Joined
-
Last visited
Content Type
Profiles
Blogs
Forums
American Weather
Media Demo
Store
Gallery
Posts posted by paulythegun
-
-
Generally speaking, you don't want to see the confluence setup OVER WASHINGTON DC
-
 5
5
-
-
Control at 132, this looks like a major storm developing

.
Haha I hope this trends toward the tpv phasing with the trailing energy-
 1
1
-
-
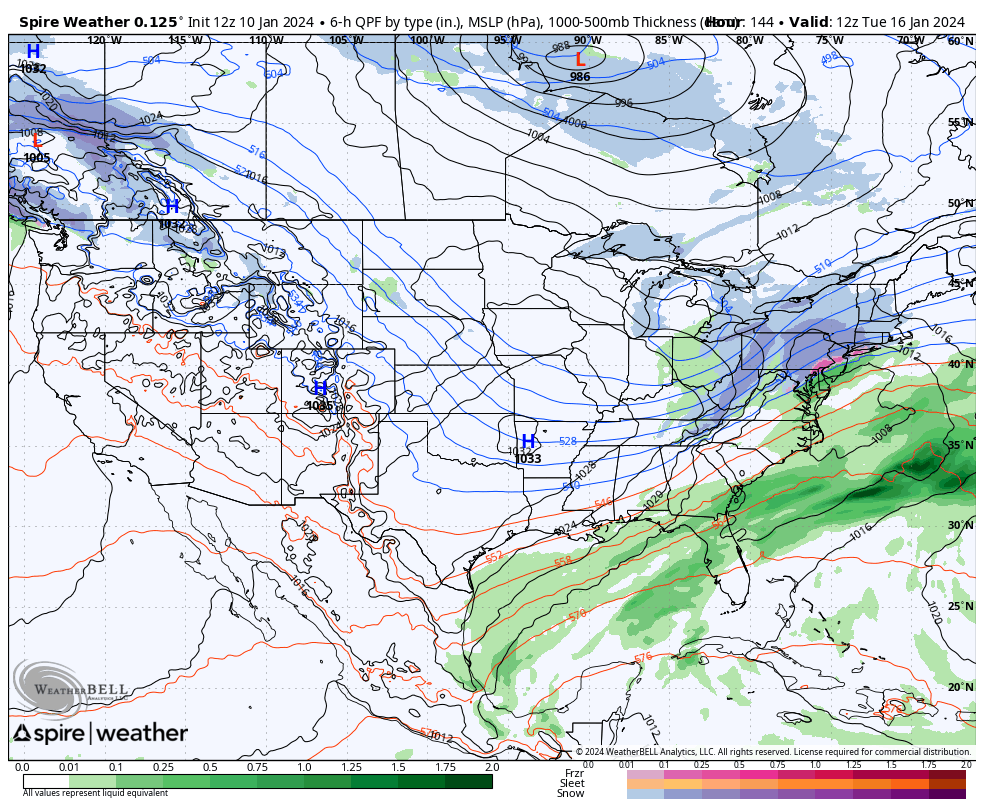
wow, even the SPIRE model is moving our way.
00z:
.thumb.png.48265c4fe9276af7f79c60b65ff25fd6.png)
12z

-
1
-
2
-
 3
3
-
-
4 hours ago, paulythegun said:
RE: January 16th:

reverse jinxed it
-
17 minutes ago, psuhoffman said:
IMO they are in the process of meeting in the middle from where they both were 48 hours ago. That should end up with us getting some pity flakes while just northeast of us gets a blizzard. We haven't had one of those in a while, time to feel that pain again.
I remember these well! before I knew to look at the 500mb stuff (and just stared at surface pressure and precip depictions) these were insanely frustrating. precip would build near the gulf with a low approaching from what appears to be the right angle. then the precip would suddenly disappear at the mountains, leaving DC high and dry....before it EXPLODED back onto the scene when the low bombed off the NJ coast. to a snow weenie with no clue why precip goes where it goes, this is one of the most painful events to witness. please be kind to surface map watchers.
-
1
-
-
RE: January 16th:
-
2
-
1
-
-
uh oh!

-
19 minutes ago, North Balti Zen said:
Growing up in southwestern and then central Ohio I will confirm for you that the same excruciating misses on the margins occurs for midwest cutters as it does for us. So many times in the mid-1980s forecast 6-10 inch snows for me just east of Columbus would end up two counties north. We just don't notice for the reasons you said.
As for whether the presence of cutters in the longer term is more stable, maybe? But there is a huge difference in a cutter at 7 days that is modeled through north dakota and at game time ended up in eastern Ohio - but we don't follow those swings that closely either
TL/DR - WxUSAF is right.great points all. i just wrote all those wobbles off as "different cows being hit by rain or snow" but now i remember that there are cities in the midwest
-
Next weekend's cutter has been well modeled for a while. GFS remarkably consistent. I wonder if it's just easier to model inland storm systems? No messy coastal transfer/redevelopment? Or if there's something else about this setup that's easier for models to resolve? I suppose this just doesn't seem very complex. Just a vort orbiting around a well defined trough.
-
3
-
-
Real question: What good are the weeklies? Isn't that like...impossibly far out?
They have maybe 0.5% more skill than throwing darts. Mostly printing out old El Niño analogs from what I’ve seen -
This seems extreme

-
2
-
-
January is ROCKIN'!!!

-
1
-
1
-
-
38F and light sleet and rain at the base of dc’s mighty Mount Hamilton
-
4
-
-
The 925mb hole setting up over Roanoke

-
1
-
-
Weather wise we are currently seeing unfolding right in front of us the effect of the strong cold high and low dews with unexpected snow to our sw
i continue to doubt this low gets further north than Va/NC border or lower than 1000mb until it’s east-ene of OC
There is considerable to look forward to
YES. radar hallucinations have started!-
1
-
-
For those who didn't get what "convection over the MC" is (me until 60 seconds ago) here's a neat little study where i figured it out:
https://agupubs.onlinelibrary.wiley.com/doi/full/10.1029/2022MS003503
Summary: Large-scale convection associated with the Madden-Julian Oscillation (MJO) initiates over the Indian Ocean and propagates eastward across the Maritime Continent (MC). Over the MC, MJO events are generally weakened due to complex interactions between the large-scale MJO and the MC landmass.
-
 6
6
-
-
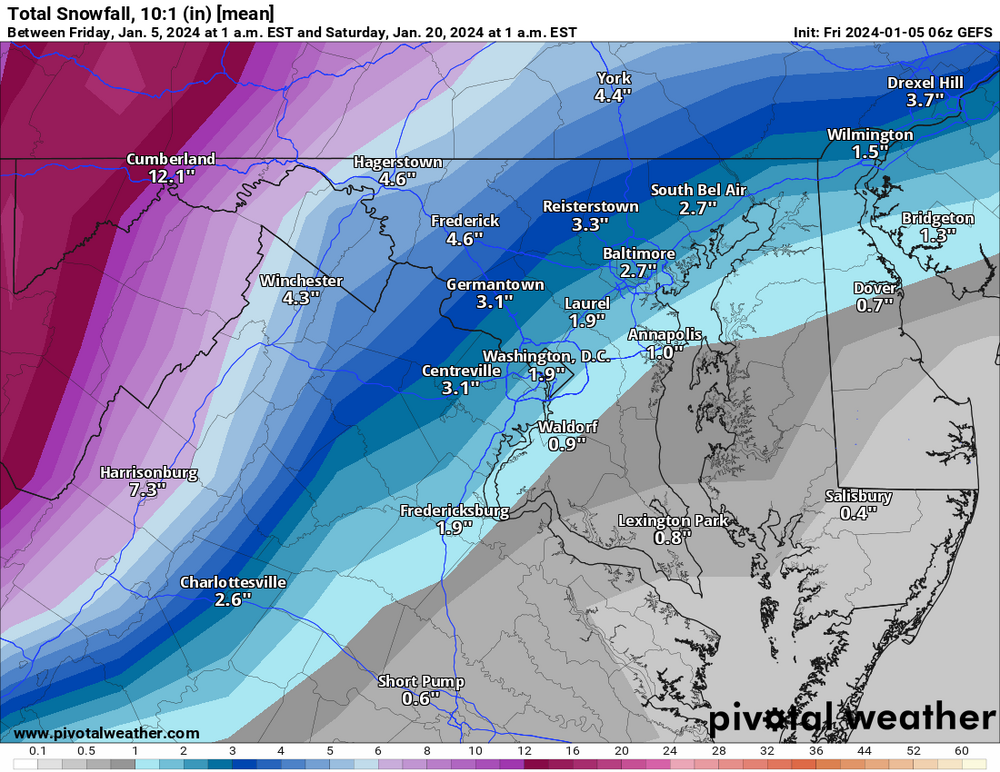
10 to 1! and half of this is from "tomorrow" (!!!)
-
1
-
-
-
Really stinks for Virginia ski resorts if they can't get a nice clean snow to drizzle event.
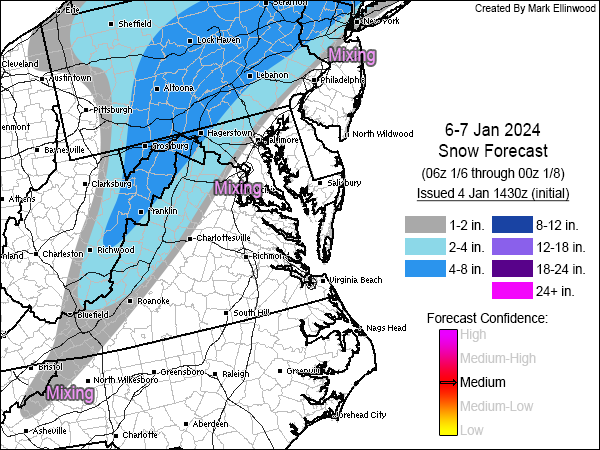
4 minutes ago, Ellinwood said:Been awhile...
I could see some "boom" areas in the far NW burbs of the I-95 corridor if there's heavy rates late Saturday afternoon into Saturday evening, otherwise I'm more pessimistic than optimistic. Lines up fairly well with the NWS at least from Philly southward.
Seems reasonable. Not your focus, but the euro (and to a lesser extent, GFS) had some interaction with that trailing low that provided some hope for NYC/Boston.
-
-
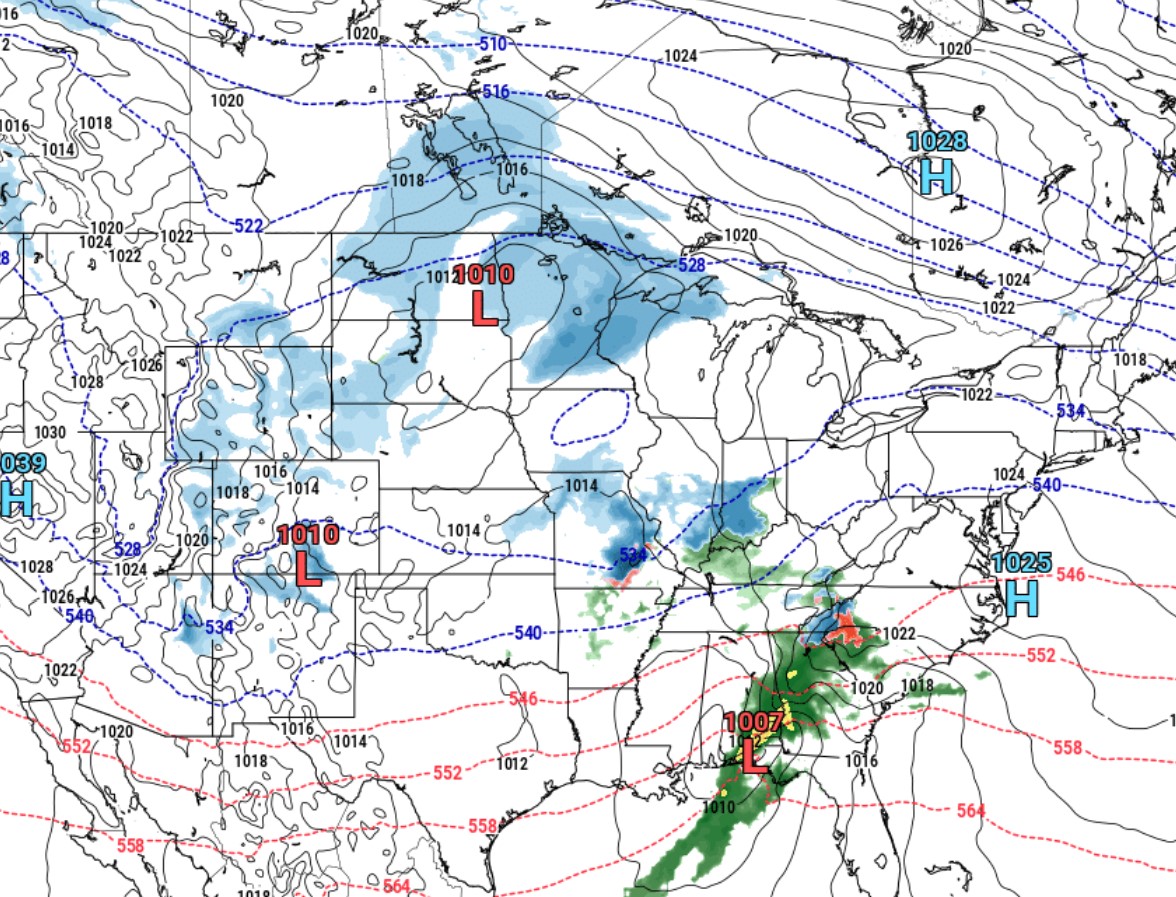
ok this is just funny now.
.thumb.png.ad7d6055012f6e73c5f780e213d006fb.png)
-
7
-
1
-
-
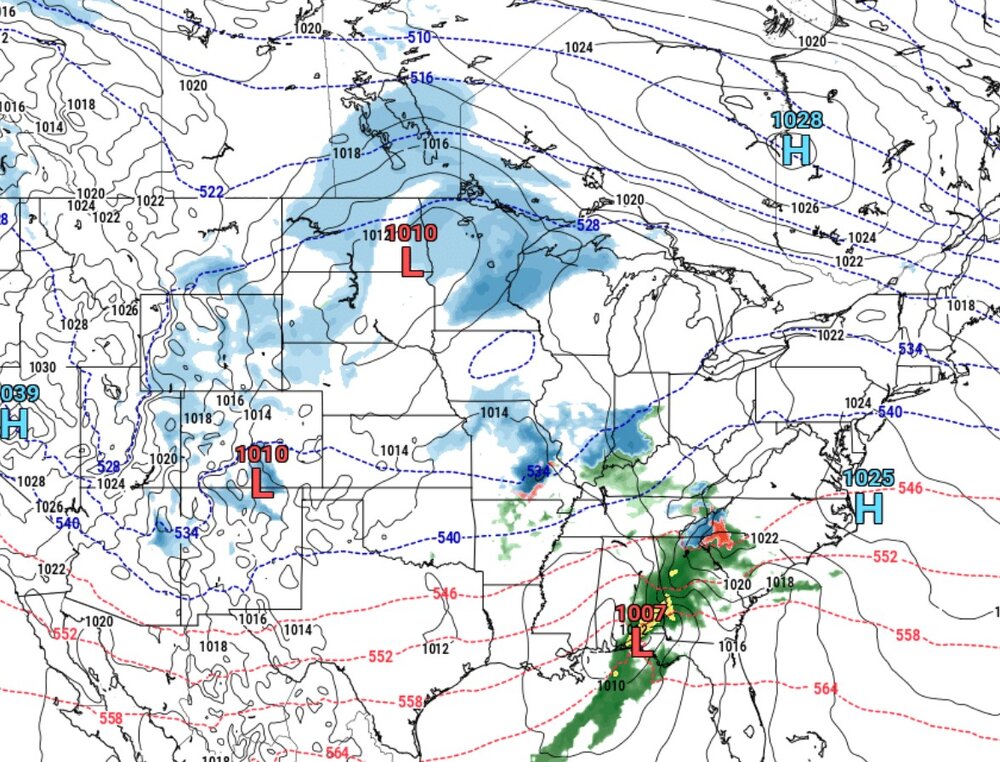
CLASSIC surface level setup for an HECS on NAM. Got your three low pressure systems (triangle defense) chasing two weak highs off the continent
-
5
-
4
-
-
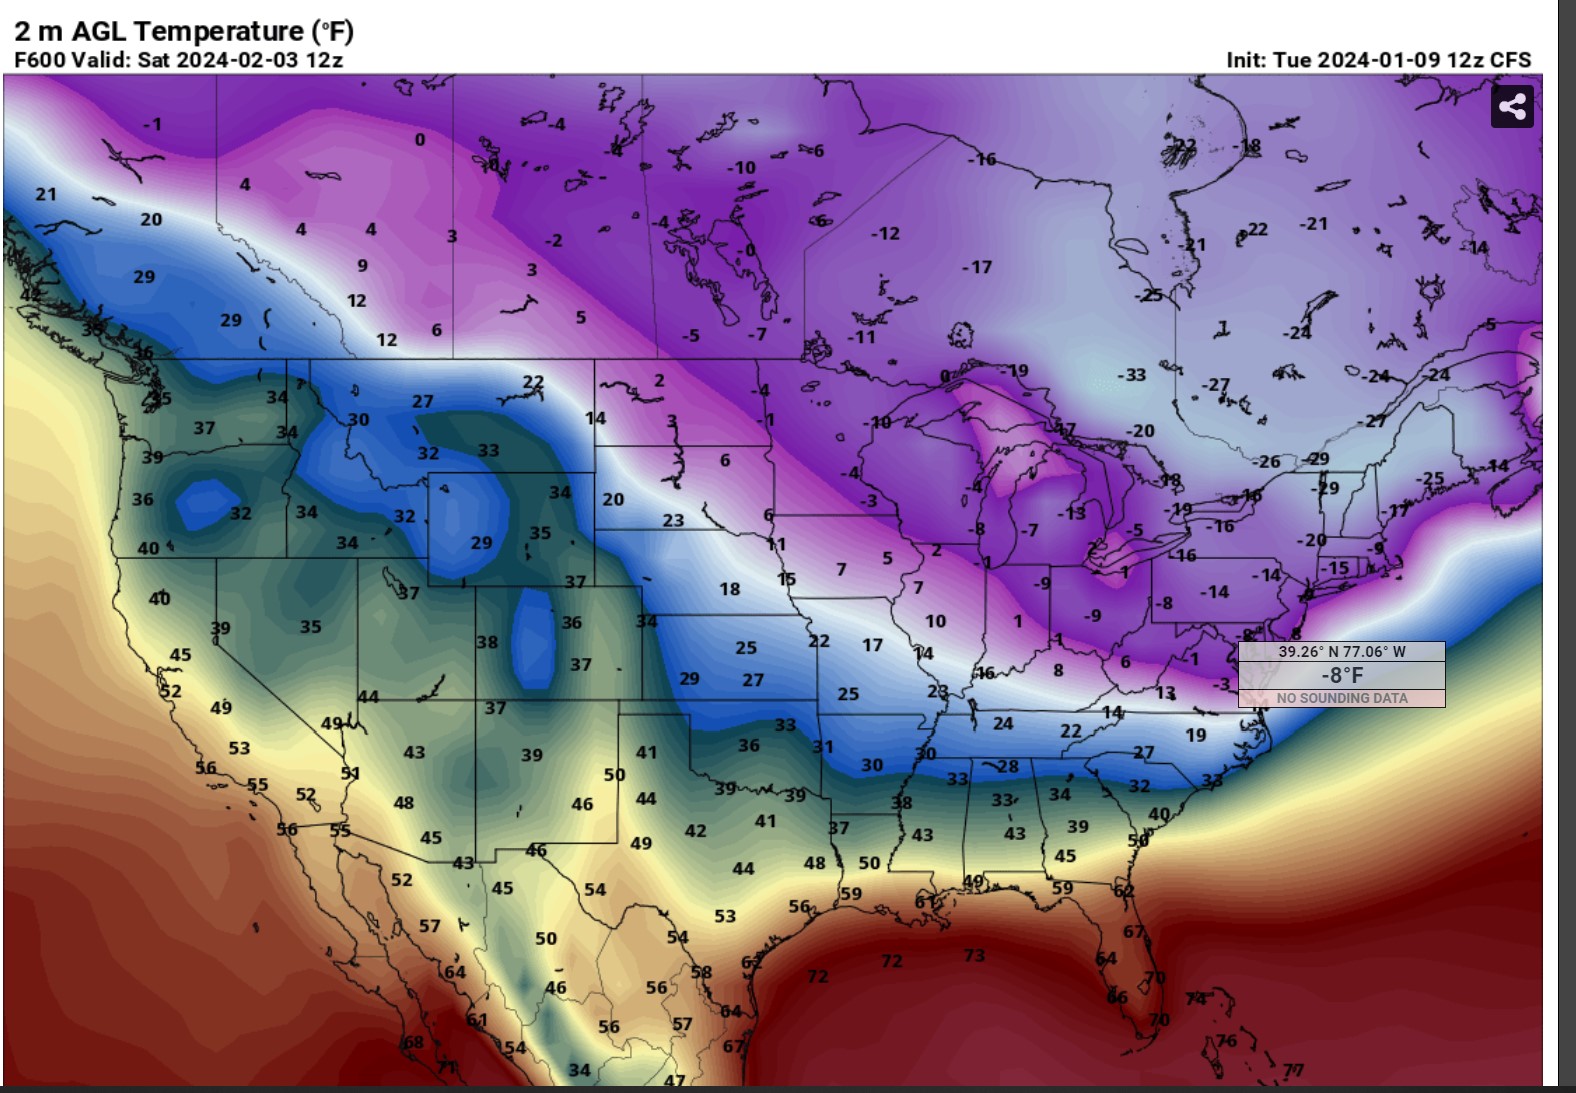
29 minutes ago, clskinsfan said:
Too early to start panicking about next fall?

you beat me to this. whenever someone complains about a long range map, gotta up the ante with some CFS
-
1
-
-
Model trend momentum is accelerating toward some extreme snowmap colors
Models were accelerating in another direction earlier today. But - as we all learned in meteorology class - model trend momentum is moving toward snow now.-
1
-
1
-
.png.a2958a0dfa2c9f64e209770dcffe682f.png)


.png.d6a2ef979ca4da3e99b4085cc90f2536.png)
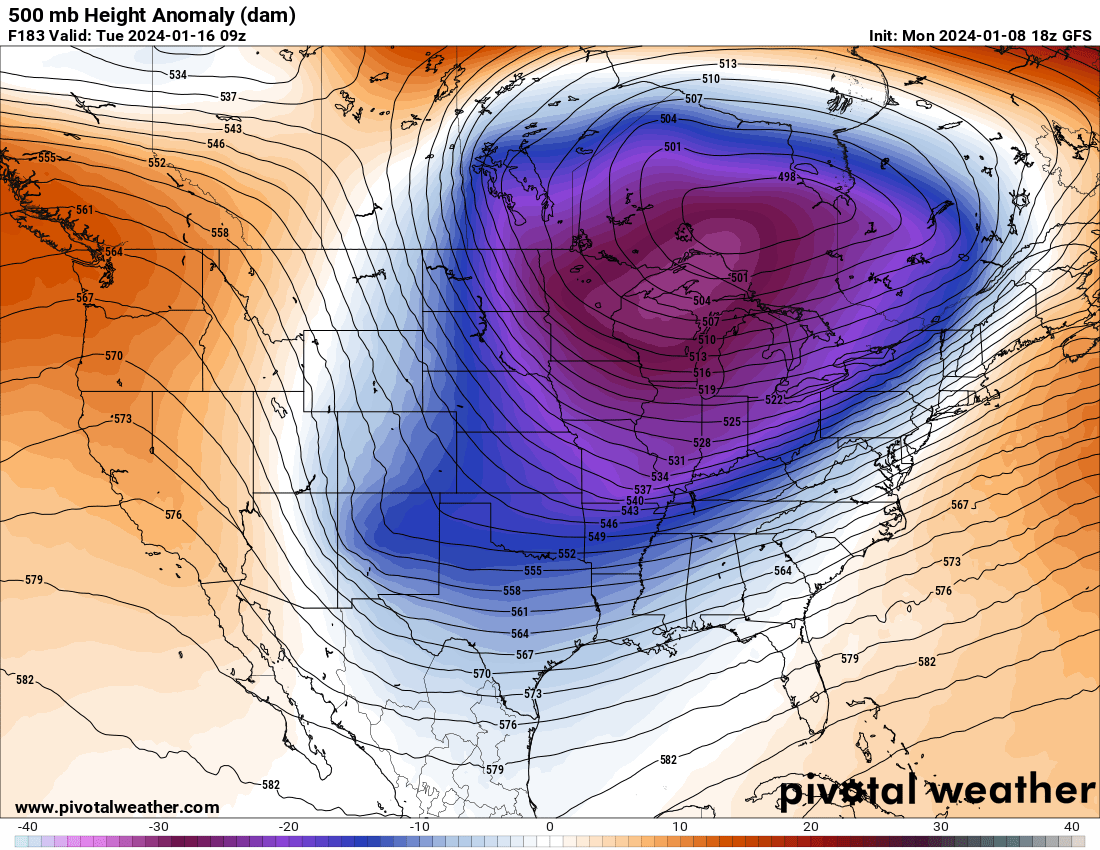
Jan Medium/Long Range Disco 2: Total Obliteration is Coming
in Mid Atlantic
Posted
The TPV lobe is way further north on this run (compared to the bad 12z euro run). Good!