

Bhs1975
-
Posts
242 -
Joined
-
Last visited
Content Type
Profiles
Blogs
Forums
American Weather
Media Demo
Store
Gallery
Posts posted by Bhs1975
-
-
well by transitioning to renewable energy and also finding ways to remove CO2 from the atmosphere we are doing just that, hopefully we quicken the pace, we need to halve fossil fuel consumption by 2030.
We have three Class V worlds in our solar system- Mars, Europa and Enceladus. Tidal forces make the latter two worlds hotter than they would seem by their distance.
Mars has tons of lava tubes that could be sealed off a pressurized for habitation.
-
The issue of the MWP and LIA has already been addressed by several people here at several times. Different proxies examined from different parts of the world show that the MWP and LIA were regional, not global, events.
Three papers and the abstract of another (the full copy of which can be requested from the authors):
http://www.meteo.psu.edu/holocene/public_html/shared/articles/MannetalScience09.pdf
https://advances.sciencemag.org/content/1/11/e1500806
Finally, relying on a single proxy in one particular location to make a continental or global judgment is no different from relying on the temperature record of one location and making a similar judgment. If one wouldn’t make judgments about North America, the Northern Hemisphere or global temperatures based on the temperature record of let’s say only Seattle, why should one make similar judgments strictly from a single ice core measurement?
Cause he’s a dumb ass.
-
The literature cites increasing Arctic solar insolation, often from fluctuations in the earth’s orbit, as one of the natural mechanisms that kicks off the initial warming. As temperatures rise, stored carbon is unlocked and the atmospheric concentration of carbon dioxide increases. In turn, the increased atmospheric concentration of carbon dioxide promotes additional warming. Given the physical properties of carbon dioxide, it should make no difference how the stored carbon dioxide is released. The impact should be the same if the physical properties of CO2 are understood correctly. The observed ongoing warming is consistent with what one would expect when atmospheric carbon dioxide increases.
I said nothing about feedbacks, as one is dealing with the much larger issue of forcings. Additional feedbacks, some of which are non-linear and some of which are still poorly understood, influence how much warming actually takes place. Nevertheless, the general scientific conclusion concerning the role increasing anthropogenic greenhouse gas forcing has played in driving ongoing warm is a very high confidence matter in science. The confidence level will likely be 99%-100% when the IPCC publishes its next assessment (an increase from the current 95% figure).
I strongly disagree that the objectivity of climate scientists has been corrupted by “money, fame, power and egos.” If anything, it is the movement that rejects AGW that faces that problem. It offers no credible empirically-supported alternative to AGW. It increasingly evades the research and publication route by which scientific knowledge is built/expanded/revised, likely because it is trapped by the limits imposed by science itself and it cannot bear subjecting its lack of alternative to rigorous scrutiny. Absent a concrete scientific basis for its positions, it increasingly displays motivated reasoning consistent with its sources of funding (often fossil fuel-related interests).
How many times you gonna rehash this? The SMF ain’t listening.
-
This paper shows that SSTs where cooler in the tropics during that time and changes in ocean circulation not CO2 was in the drivers seat like it is now.
https://web.archive.org/web/20100119135516/http://www.agu.org/pubs/crossref/2002/2001PA000724.shtml
-
 1
1
-
-
There have been a few comprehensive style studies that have been published recently which try to provide the best estimates of critical metrics related to climate change based on the large body of evidence available at the time of publication. I am but an amateur, but it is my belief that these publications are impactful and that they are of the type that may appear prominently in the forthcoming IPCC AR6 report. If anyone has noteworthy or impactful peer-reviewed publications then by all means please post them to this thread. If possible provide a link to an open access (non pay-walled) version of the manuscript.
Temperature Reconstruction
Kaufman 2020: Holocene global mean surface temperature, a multi-method reconstruction approach
Kaufman 2020: A global database of Holocene paleotemperature records
Summary: The rate of warming during the contemporary era is likely unprecedented during the Holocene. The global mean temperature is very likely to be much higher than at any point in the last 2000 years and possibly even exceeding the Holocene Climate Optimum 6000+ years ago.
Climate Sensitivity
Sherwood 2020: An Assessment of Earth's Climate Sensitivity Using Multiple Lines of Evidence
Summary: For 2xCO2 they report 2.6 - 3.9C and 2.3 - 4.7C for 66% and 95% certainty respectively with a value of 3.1C being at the peak of the probability distribution curve. It is noted that the upper bound should be considered more cautiously. It is far easier to constrain the lower bound than the upper bound. Values Earth Energy Imbalance
Schuckmann 2020: Heat stored in the Earth system: where does the energy go?
Summary: The EEI is +0.87 +- 0.12 W/m^2 and is increasing. 1% goes into the atmosphere. 4% goes into the cryosphere. 6% goes into the land. 89% goes into the oceans. To pull the EEI back to 0 would require a change in CO2 concentration from 410 ppm to 353 ppm. For those that don't know EEI is the amount of forcing still needing to be equilibriated via an increase in temperature. It should not be confused with effective radiative forcing (ERF) which is the cumulative forcing after fast feedbacks (like water vapor, etc.) have played out. EEI goes to zero after the climate system fully equilibrates to the ERF. This publication says the following of EEI.."This simple number, EEI, is the most fundamental metric that the scientific community and public must be aware of as the measure of how well the world is doing in the task of bringing climate change under control."
This further confirms that 350ppm CO2 is the max safe limit.
-
1
-
-
Any earth sized planet in the habitable zone that was too cold for our liking. Mars is a bit too small. Earth is on the inside edge of the habitable zone so warming is bad. We should be terraforming by pulling GHG out and stop adding more. The Sun will eventually get too hot for any amount of GHG levels to make Earth habitable and we would have to actually block a lot solar radiation which would be impractical. Then we would have to find another planet. This scenario has been going on in the universe for a very long time. We are speeding up the process.Mars lol? You'd want to add CO2 to its atmosphere of course.-
1
-
-
What would you do if you wanted to terraform a planet to make it warmer and wetter especially at higher latitudes?
-
It’s going to take some extreme intervention to change our course. We are going to have to be forced to act.
-
1
-
-
I know right? WTF is your problem dude?Don has corrected you over and over and over again and I am getting sick of it. STFU with your nonsense.So are you going to stop telling your lies about wind and solar or just ignore this blizzard? Again evidence you are not here in good faith to learn but just spout off your opinions and ignore fact based correction of your mistakes.-
1
-
-
Saw this chart on twitter (PW is petawatts which is estimated by taking forcing per meter squared times surface area of earth). There is a very close relationship between forcing changes and global temperature. Now that data has been updated, can see that the hiatus and subsequent temperature spike are mainly due to short-term forcing changes. Not much room for natural variation.
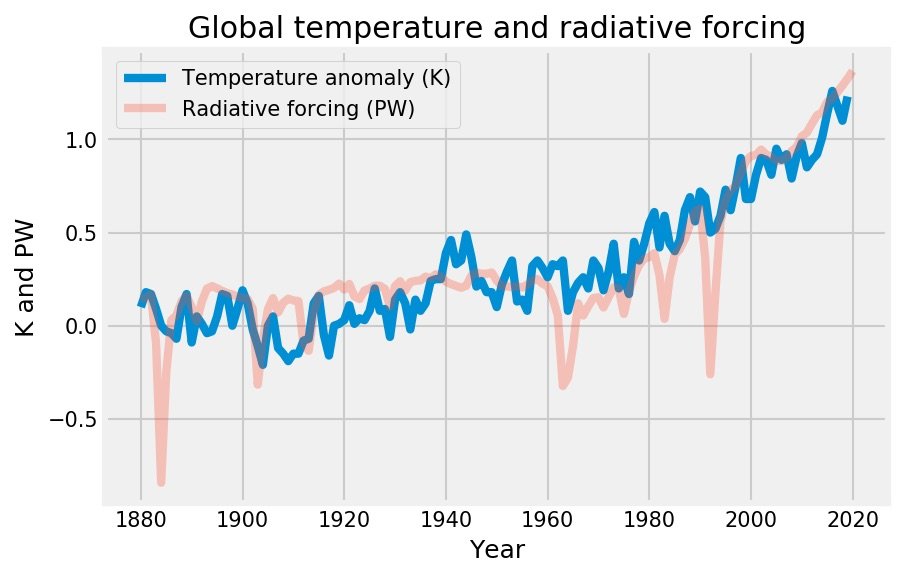
Looking at that chart you can see that 350ppm CO2 is that upper limit before feed backs kick in and set off runaway warming.
-
Seems like with AGW the rich get richer and the poor get poorer with respect to precipitation.
-
1
-
-
Thank you for this paper. Here is the fundamental problem with their results. They are using global precipitable water vapor(PWV). Since water vapor rapidly decreases with height, this metric of water vapor is mostly what is happening in the lower troposphere. Since the oceans have been warming GPW has increased in all datasets (even NCEP). It is the upper troposphere that matters when it comes to the greenhouse effect. More greenhouse gases in the lower troposphere actually cool the layers above them. Similar to how the stratosphere cools above the troposphere with enhanced GHGs (assuming ozone is constant which it is not). So the upper troposphere is where it counts for both CO2 and H2O. These researchers do not seem to understand this. Here is a quote from the paper...
"The increased greenhouse gases reduce the outgoing longwave radiation and contribute to the global warming phenomenon. Studies have shown that the global mean surface temperature has increased by 0.7–0.8°C since the beginning of the twentieth century [Hansen et al., 2001; Smith and Reynolds, 2005; Parker et al., 2007]. Atmospheric water vapor provides the single largest positive feedback on global warming [Dai, 2006; Mieruch et al., 2008; Zhang et al., 2013]. Both climate models and observations suggest that an upward trend in water vapor is expected to appear as a response to the surface temperature increase [Held and Soden, 2006; Santer et al., 2006; Zhang et al., 2013]. Monitoring the variation of atmospheric water vapor is thus significant not only for the detection of climate change but also for a better understanding of water vapor feedback on global warming."
So they understand the role of water vapor as a feedback but use the wrong measurement. They use the whole troposphere. It needs to be upper troposphere. That is why you have to be careful about peer reviewed papers. These authors probably don't understand radiative transfer that well and the reviewers also.
Lol I think you don’t understand.
-
This is another significant paper. It confirms exactly what one would expect from the prior research showing a slowing and more wavy jet stream. It provides a unifying explanation for such events as last summer’s historic heat in Europe and Alaska, this year’s heat in Siberia, the record summer in parts of the Southwest, not to mention slowing forward motion of some recent hurricanes.
It’s also melting more ice by bringing warm moist air all the way to the north pole.
-
1
-
-
Sorry I don't agree. How can something else kick off a global warming event during the last glacial maximum, CO2 remains constant or even falls as it lags this initial forcing and then all of the sudden after several hundred years it becomes a positive feedback? That makes no sense. Obviously it is not the control knob of the climate if it doesn't kick off climate change. How can CO2 be still falling and global warming occurring and vice versa? Then after a lag it all of the sudden becomes a feedback? If that is the case, it is only a feedback to the warming we see today. Warmer oceans outgas CO2 and humans add some too. There is some effect from increasing CO2 but whatever kicked off the warming from the Little Ice Age to present is the dominant forcing. Since CO2 increases have a logarithmic effect radiatively CO2 should have more influence during ice ages and less so now as CO2 has rise to above 400 ppm. There is less warming for each additional ppm of CO2. So even if there is unnatural rises in CO2, the effects are diminishing on the climate system. All told 3.7 w/m2 of extra forcing for doubled CO2 vs OLR of 239 w/m2 is 1-2%. That is very little. There is SOME effect but it is not driving the climate. Climate models are flawed and do not account for natural processes well. They also assume the climate was in stasis in 1850 which it wasn't since we were warming out of the LIA. So climate models don't prove anything.
Why do keep regurgitating the same crap without backing it up with any peer reviewed material?
-
2
-
-
I think he believes much of what he is saying but there are clear instances of him stating things he knows to be false. For example, claiming to have read a particular paper I mentioned when he doesn't know which paper. Or repeating points that were clearly proven false and deliberately ignoring those replies so as to continue repeating the same falsehoods. It would be different if he actually responded to the points directed at him. But by willfully ignoring the responses I believe it is intentionally disingenuous and dishonest. Ignoring evidence contrary to out beliefs is common human behavior. But it is certainly not admirable and is one of the uglier sides of the human psyche. It is pervasive in the AGW denier community.
Most people don't have the time, energy, intellect, background knowledge, or discipline to understand the science. Which is one reason these debates are so often fruitless with one side consistently ignoring the evidence presented.
That’s why we need a technocratic government to turn things around in time to survive. Not looking good for civilization right now.
-
1
-
-
Yeah this is what happens when the world warms. But it easily could be mostly natural too. You can't prove CO2 is the cause for the millionth time.
It’s already been proven over and over.
-
1
-
-
Those are 1 day anomalies. They are not year-to-date anomalies. 2020 is running very warm and could well wind up the 2nd warmest year on record on the major data sets (GISS, HadCru, NOAA, Berkeley).
Below are the year-to-date anomalies:
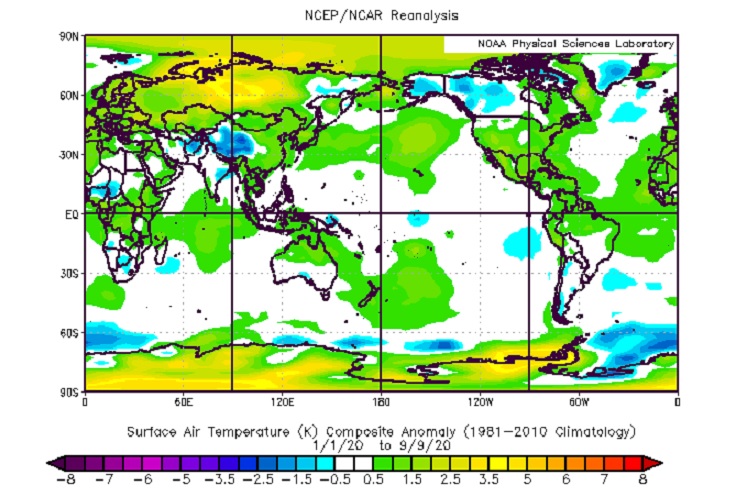
Oh look the poles are warmest to due Arctic amplification which fits perfectly with GHG forcing.
-
3
-
-
From LiveScience.com:
Now, in a new study published today (Sept. 10) in the journal Science, researchers have analyzed the chemical elements in thousands of foram samples to build the most detailed climate record of Earth ever — and it reveals just how dire our current climate situation is...
According to the researchers, the current pace of anthropogenic global warming far exceeds the natural climate fluctuations seen at any other point in the Cenozoic era, and has the potential to hyper-drive our planet out of a long icehouse phase into a searing hothouse state.
"Now that we have succeeded in capturing the natural climate variability, we can see that the projected anthropogenic warming will be much greater than that," study co-author James Zachos, professor of Earth and planetary sciences at the University of California, Santa Cruz, said in a statement. "The Intergovernmental Panel on Climate Change (IPCC) projections for 2300 in the 'business-as-usual' scenario will potentially bring global temperature to a level the planet has not seen in 50 million years."
https://www.livescience.com/oldest-climate-record-ever-cenozoic-era.html
We would never get close to that because civilization would collapse well before that if not in the next decade or two from disaster after disaster.
-
1
-
-
Dude the models suck. They kept trying to kill off Laura and Isias until a couple days before landfall. How did that work out? The real GFS basically shows nothing considering peak is going to be gone soon. Shows yet another struggling storm. It does give more weight to my idea that if there is another major this season it will recurve well east of bermuda. Atlantic still very hostile but i still think sept 20-oct 10 will have a chance of 2 well formed storms at the same time, then the season comes to an end. Even JB isnt tweeting about the atlantic. Wait, JB just tweeted about 2 threats to the US next week. Joe Bastardi 45m Deja Vu all over again? http://Weatherbell.com looking at. 2 features not even x'd that we think could develop over the next 5 days and may impact US next week, Join us on the Raging weatherbull on http://weatherbell.com premium. Unlike Nana and Omar, could impact US
 -
1
-
-
dont waste your time Don, its useless.
He’s just a stubborn old man who won’t change. It’s time to move on stop repeating yourself.
-
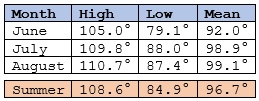
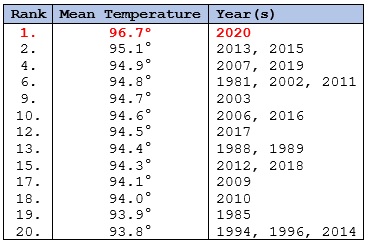
Phoenix concluded, by far, its hottest summer on record. During June-August 2020, Phoenix had a mean temperature of 96.7°. That smashed the old record of 95.1°, which was set in 2013 and tied in 2015.
Table 1: Summer 2020 Average Temperatures
Since 2009, every summer has ranked among the 20 warmest summers on record. In addition, 2015, 2016, 2019 and 2020 have ranked among the 10 warmest summers.
Table 2: 20 Warmest Summers
Monthly Mean Temperatures:
June: 92.0° (21st warmest June on record)
July: 98.9° (warmest July on record; old record: 98.3°, 2009)
August: 99.1° (warmest August on record; old record: 98.3°, 2011)
July 2020 set a new monthly mean temperature. August 2020 surpassed that record.
Just 3 (15%) of the 20 warmest months were recorded prior to 2000. 17 (85%) of the warmest months occurred 2000 or later and 10 (50%) of the warmest months occurred 2010 or later.
There were three cases where both July and August ranked among the 20 warmest months: 2007, 2019 and 2020.
Table 3: 20 Warmest Months
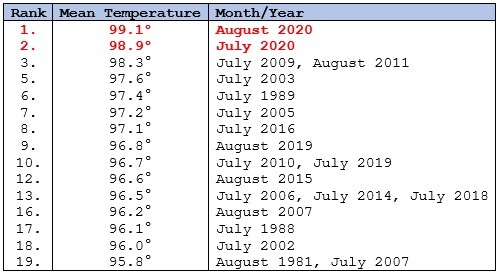
Table 4: Record High Minimum Temperatures
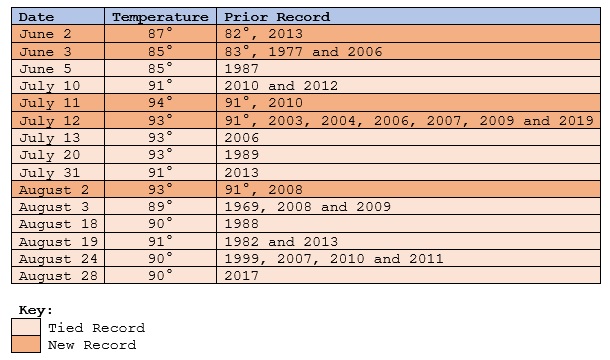
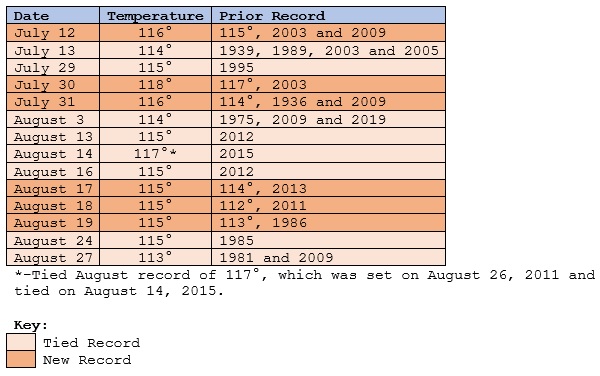
Table 5: Record High Maximum Temperatures
Select Monthly Heat Thresholds:
Highs 110° or above: 22 days, August 2020 (old record: 19 days, July 2020; prior old record: 18 days, June 1974)
Highs 115° or above: 7 days, August 2020 (tied record set in June 1974)
Lows: 90° or above: 16 days, July 2020 (old record: 11 days, July 2006); August 2020 had 12 such days.
Select Summer Heat Thresholds:
Highs 110° or above: 48 days (old record: 31 days, 2007 and 2011)
Highs 115° or above: 13 days (old record: 7 days, 1974)
Lows: 90° or above: 28 days (old record: 15 days, 2003 and 2013)
Climate Change:
Anthropogenic climate change is driving a warming of Phoenix's summers. The warming has accelerated in recent decades. The observed global warming since the 1950s is unequivocal with anthropogenic greenhouse gas emissions being the dominant driver of that warming (IPCC Climate Change Synthesis Report 2014). The warming is a global phenomenon with 98% of the world having experienced its warmest 51 years during the current 2,000 years (Neukom, et al. 2019).
Recent research suggests that Phoenix's climate will resemble that of Baghdad by 2050 (Bastin, et al. 2019). During the summer, Baghdad typically receives no rainfall. Baghdad's average high temperatures (Weather Atlas 2002-2020) during the summer months are:
June: 105.8°
July: 111.2°
August: 109.4°
Summer Average High Temperature: 108.8°
Until summer 2020, the highest mean summer maximum temperature was 107.0°, which was set in 1978 and tied in 1989. The highest monthly summer maximum temperature was 109.8°, which was set in July 1989 and tied in July 2020. August 2020 surpassed that record with an average high temperature of 110.7°.
As recently as 2000, Phoenix's average low temperature during the summer was 79.8°. Since 1999, Phoenix has had no summer with an average low temperature below 80.0°. Prior to 2020, the highest average monthly minimum temperature was 87.5°, which was set in August 2011. July 2020 had an average minimum temperature of 88.0°.
Based on the above research findings, summer 2020 provides a glimpse of what a typical Phoenix summer will be like by 2050.
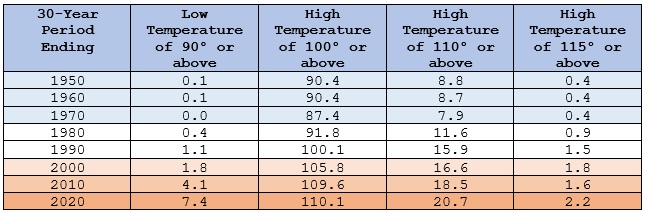
Table 6: Average Summer Temperatures (30-Year Moving Average)

Climate change is also resulting in an increase in the frequency of days on which the low temperature stays at or above 90° and the high temperature reaches 100° or above, 110° or above, and 115° or above.
Table 7: Average Annual Days at Set Thresholds (30-Year Moving Average)
According to the Fourth National Climate Assessment, Phoenix saw 60 to nearly 100 100° days per year at the 5th and 95th percentiles. Under the RCP 4.5 scenario, those figures are projected to increase to 110-141 days per year during the 2070-2099 period. During the 1950-1999 period, 9 (18%) of years saw the number of 100° days fall within the projected RCP 4.5 interval (U.S. Global Change Research Program, 2017). From 2000-2019, 11 (55%) of years fell within that interval. 2020 is all but certain to become the 12th case since 2000 to meet that higher interval. Moreover, through August 31, the 30-year moving average is just above 110 days per year.
During the summer, 48 days saw high temperatures 110° or above. The previous summer record was 31 days, which was set in 2007 and tied in 2011. During 2020, there have been 50 such days vs. the prior record of 33 days, which was set in 2011. There were also 28 days on which the minimum temperature was 90° or above, which eclipsed the previous record of 15, which was set in 2003 and tied in 2013.
In addition, the number of very hot (high temperature of 110° or above) and super hot (high temperature of 115° or above) days has been increasing as a share of the increasing number of 100° days. For the 30-year period ending in 1980, 12.6% of 100° days had high temperatures of 110° or above and 1.0% saw temperatures reach 115° or above. For the 30-year period ending in 2000, those figures increased to 15.7% and 1.7% respectively. For the period ending in 2020 (through August 31), those figures increased further to 18.7% and 2.0% respectively.
Overall, the frequency and intensity of compound summertime hot extremes (events that combine daytime and nighttime heat where such temperatures are above their 90th percentile for their calendar) has been increasing especially in geographic locations that include the U.S. Southwest (Wang 2020). The increase in forcing associated with anthropogenic greenhouse gases is the dominant driver of this outcome. (Wang 2020). During summer 2020, 15 record high minimum temperatures were tied or broken in Phoenix and 14 record high maximum temperatures were tied or broken. On 7 days, both record high minimum and maximum temperatures were tied or broken.
Summary:
Summer 2020 saw Phoenix record its highest summer temperature on record. It also saw Phoenix experience its two hottest months on record. In addition, Phoenix easily surpassed records for most days on which the temperature reached 110° or above and on which minimum temperature was 90° or higher.
Anthropogenic climate change, which has turned hot patterns hotter and increased pattern persistence, is largely responsible for this exceptional warmth. Based on the latest research, the extreme heat of summer 2020 will likely become the "new normal" by 2050.
What will the extreme heat of 2050 be like? 140s? 110s for lows?
-
1
-
-
That’s the best looking wave coming off Africa at this time of year I can remember. If it were peak season I would expect a long track major. It’s just so early.
If this is a climate trend we are in big trouble.
. -
What’s the record for most tropical storm formations before a hurricane in the Atlantic basin?
looks like impacts will be similar to a nor’easter but pretty rare landfall area for a TC
Not gonna be rare anymore with AGW changing the upper air pattern.
. -
Looks like Antarctic ice melt is accelerating too, based on latest research around 3x faster over the past decade than the decade before. Interesting times are ahead ;-)
Yeah a ton of coastal flooding and erosion.
.
Global Warming Makes Weather In Boreal Summer More Persistent
in Climate Change
Posted