

Bhs1975
-
Posts
242 -
Joined
-
Last visited
Content Type
Profiles
Blogs
Forums
American Weather
Media Demo
Store
Gallery
Posts posted by Bhs1975
-
-
Josh said *in his opinion* the eyewall of cat 1 Krathon was more severe than the eyewall of cat 4 Helene
Helene never really closed off completely keeping the winds from mixing down as much.
.-
 1
1
-
-
Would love to be in Cancun right now. Outflow looks excellent now, I think this is about to go full tilt. RI today with some of the best OHC on the planet.
It's not going to have much time to take advantage of it. This will be a huge inland threat though.-
 3
3
-
-
Indeed, I agree that CC/AGW is real and significant. My point to TT was that the UHI portion for large cities like Phoenix and LV shouldn’t be dismissed as insignificant. He said, “I’ve never bought it that the urban he Island is a big enough factor in this thing”. That’s what I was responding to. Perhaps I misinterpreted him. Maybe he just meant that UHI isn’t the dominant metric, which I’d lean toward though I could see it approach 50% in some of the faster growing large metros like LV.
Deserts soak up a lot of heat as it is so I'm not sure there would be much difference compared to the developed areas that has some grass and trees.
.-
 1
1
-
-
Records being broken by several degrees at a time is a pretty obvious sign of extremely rapid warming on a geological timescale.
. -
Phoenix’s record streak of 80-degree lows ended today.
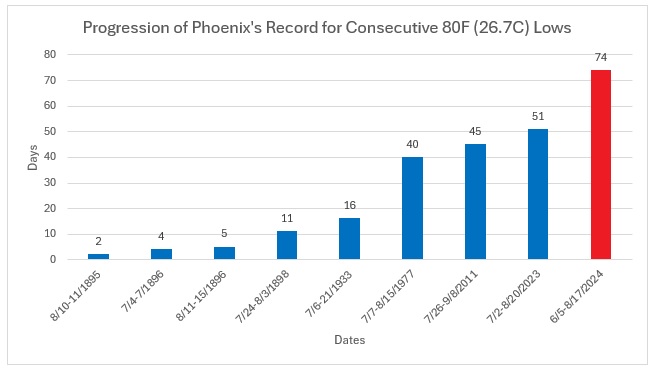
And the highest 3 are in the last 13 years.
.-
 2
2
-
-
Looks like some very hot weather in New Orleans in the wake of Tropical Storm Debby. Current forecast would suggest 3 straight days of around 100F heat.
I would suggest the all-time record could be at jeopardy, but that appears unlike due to last summer reaching 105F. Still only 14 years since 1946 have reached 100 or better at New Orleans.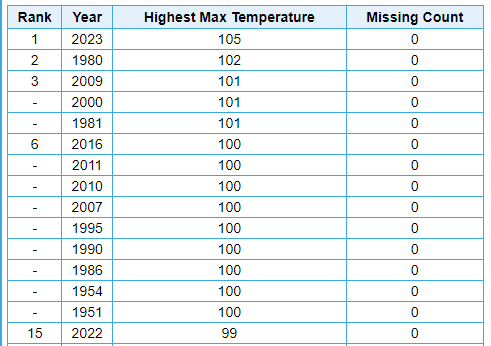
And this is quite shocking. I didn't see much in the news about this. But last summer looks like it was totally insane there. From 1946 to 2022, there were a total of 20 days at or above 100F. Last summer alone had 17!

.-
 1
1
-
-
Out saying that the ice is recovering and it was the highest extent in 20 years, how all "global warmers" were wrong.
Exactly the same shit as '16, right before Antarctic sea ice collapsed.
What a douchebag
. -
Looks like typical Martz BS. Martz chart doesn't match NOAA or UAH6 satellite data (below). He's missing a lot of warming. Even NOAA is underestimating warming since 2012 if UAH6 is right.
Of course there is no info on how Martz calculates the US average temperature. As we've seen with your "county averages", plenty of options for errors or other mischief. Merely averaging the data will skew the results as the US network has shifted in time. Per chart above I doubt that Martz is using a proper station weighting; i.e, 3 stations close together shouldn't get the same weight as one that doesn't have any close neighbors. That will weight populated areas too heavily.
Another reason to discount Martz chart: bias adjustments on modern stations are very small, there shouldn't be a big discrepancy between raw and bias adjusted. Bdgwx has posted charts showing how well the recent US station data lines up with rural stations that are carefully selected to track climate changes.
Our Chester County deep dive has shown that the Chester County bias adjustments are completely justified. The Chesco COOPs were biased warm and the problems could be easily identified by comparing to nearby sites. Stations were moved out of towns to cooler locations, experienced time of day bias, and ran warm at times probably due to shelter/location issues with non-aspirated thermometers.
Finally If Martz has good scientific evidence he should publish in a technical forum. As discussed above I doubt the chart would survive a peer review. In the para above he is using handwaving arguments. His statements on TOBS smack of complete BS. We know that stations experienced TOBS because the observation times are known. The impact of TOBS has already been established in published papers that are linked in this thread. Instead of producing evidence, Martz is using name calling . In short he's following the denier playbook: misleading analysis, faulty logic, no evidence, name calling, etc.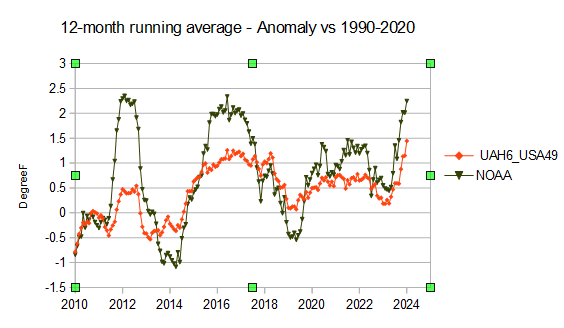
How many times are you going to regurgitate the same info? He doesn't care.
. -
Below is the impact of the altered data for Coatesville 1SW from 1894 thru 1982. The chilling adjustments were consistently applied to the first 71 years (1894 thru 1971) The greatest chilling adjustments were applied to the oldest data with at least 2 degrees F adjustments made from 1897 thru 1922 along with 1931-35 and 1941-45. The end result with the altered data flips what the raw data clearly shows as cooling trend during those years....to now a clear warming trend. The greatest overall chilling adjustments were made to the October thru December months. But 100% of all months for all years were chilled for April through October. February had the least number of months chilled with 75 of the 89 months while January and March both saw chilling adjustments to 78 of the 89 months on record.

That just shows how bad the data is in the early years to need that much of an adjustment as it's obviously not cooling when the planet is warming extremely rapidly.
.-
2
-
1
-
-
Not clear? ALL THE BIAS ADJUSTMENTS ARE MADE TO THE STATION DATA. Stations have adjustments, not counties, not states, not climate divisions, etc..
I showed you how to access the station adjustment information upthread. Not the first time either. Answering a previous question, I posted the Phoenixville chart below about a month ago; and got a very snide response. There are two main periods with Phoenixville adjustments: the warm spike in the mid 20'th century, that we have already identified and a cool period in the 1980s and 90s.
West Chester (also below) appears to be similar to Coatesville, with a likely move-related cooling. The last move to a suburban site occurred in 1970. Since that time bias adjustments have been minimal. The only exception is a big spike around 1990, when the time of observation changed. The bias adjustments that we have investigated are justified and accurate. The past months deep dive into Chesco's climate data has left NOAA smelling like a rose. Thanks for kicking it off:lol:.
https://data.giss.nasa.gov/gistemp/station_data_v4_globe/
.png.082bfd3e2825f51098f251c53b035084.png)

Looks like it's matching the sharp rise in global temps since 1975 to me.
. -
I thought those that he answered were well thought out.....but as always with Don plenty of conjecture and some fearful prognostications (3 meter or more sea level rise over the next 75 years?)
Yeah some colossal chunks of Ice would have to fall in to get 3 meters.
.-
1
-
-
Red Herring = No data
Are you a flat Earther too?
.-
1
-
-
Wow!! Okay I am good to play along with this....so what models that you believe are showing you civilization collapsing?? You are probably part of the group that is convincing young folks today to avoid having children as the future is so bleak....scary indeed!!
Consciousness doesn't end at death so having children is irrelevant.
.-
1
-
-
"coffin" huh....you must be a great conversationalist at parties!!
I sure everyone is dying to hear about AGW not happening in Chesco Co.
. -
Or it could be the massive solar storm before that which would be a welcome reset.
.-
2
-
-
The AMOC collapse will be the nail in the coffin for us.
.-
1
-
-
Why alarmists and doomers are losing the battle of trying so darn hard to convince folks that our current cyclical climate change is so incredibly alarming:
- Alarmists will state that “Weather ≠ climate. One colder than normal week or a snowy than normal season is of course not evidence against the overall long-term trend. Cold extremes can still occur in a warming world.”
- If we show a stat that is only analyzing the US or cough cough Chester County PA we will of course hear “Well you do know that the US covers less than 2% of global surface area. So, your point is ridiculous. Global stats are all that matters. You the "climate denier" are clearly engaging in cherry-picking of data to fit your narrative.”
- But then we just look at our current weather this week which is as we all agree is NOT Climate! , Yet our friends the climate alarmists are blaming Hurricane Beryl and the "unprecedented" SW US heatwave on man's carbon transgressions: Don't you know Paul that “Hurricane Beryl is being fueled by climate related record high sea surface temperatures, which is the result of man's burning of carbons??"
- But wait my alarmist friends , I thought you tell us that “weather ≠ climate”? Doesn't that still apply here? Or, does it only apply when the weather frustratingly doesn't fit your simple narrative? The truth is that of course the alarmists and doomers can't have it both ways no matter how they may try and twist the actual facts vs. what they are feeling.
Oh so instead of no climate change you are now calling the rapid rise in CO2 and temps cyclical climate change? I mean in a way you're right as once civilization collapses and most of us are dead the CO2 will go back down and temps will drop again.
.-
2
- Alarmists will state that “Weather ≠ climate. One colder than normal week or a snowy than normal season is of course not evidence against the overall long-term trend. Cold extremes can still occur in a warming world.”
-
What makes an alarmist or doomer are the folks who continually state that "the climate crisis is an existential threat to the world" They will then usually conflate weather events with climate change and tout these events as "driven or fueled by climate change" "unprecedented heat or floods" but of course when we look back at climate history we find few events have been unprecedented during our current warmer cycle. If our climate warms by 2 more degrees over the next 100 years the earth will handle it.....just as it has always effectively and efficiently handled the past warm and cold cycles.
It's gonna be more like 6 degrees C or more which would be a massive change for life on Earth with a collapse of modern civilization before 2050. Enjoy. But yeah the Earth will be around for billions of years.
.-
1
-
-
I'm thinking that appendage to the NW is from the light upper level shear.
. -
It’s also going to be retired for wrecking the Antilles, Jamaica, Yucatán, and Mexico. This will be a very damaging storm with multiple landfalls. The history it’s already made is merely the cherry on top
You forgot Grand Cayman.
. -
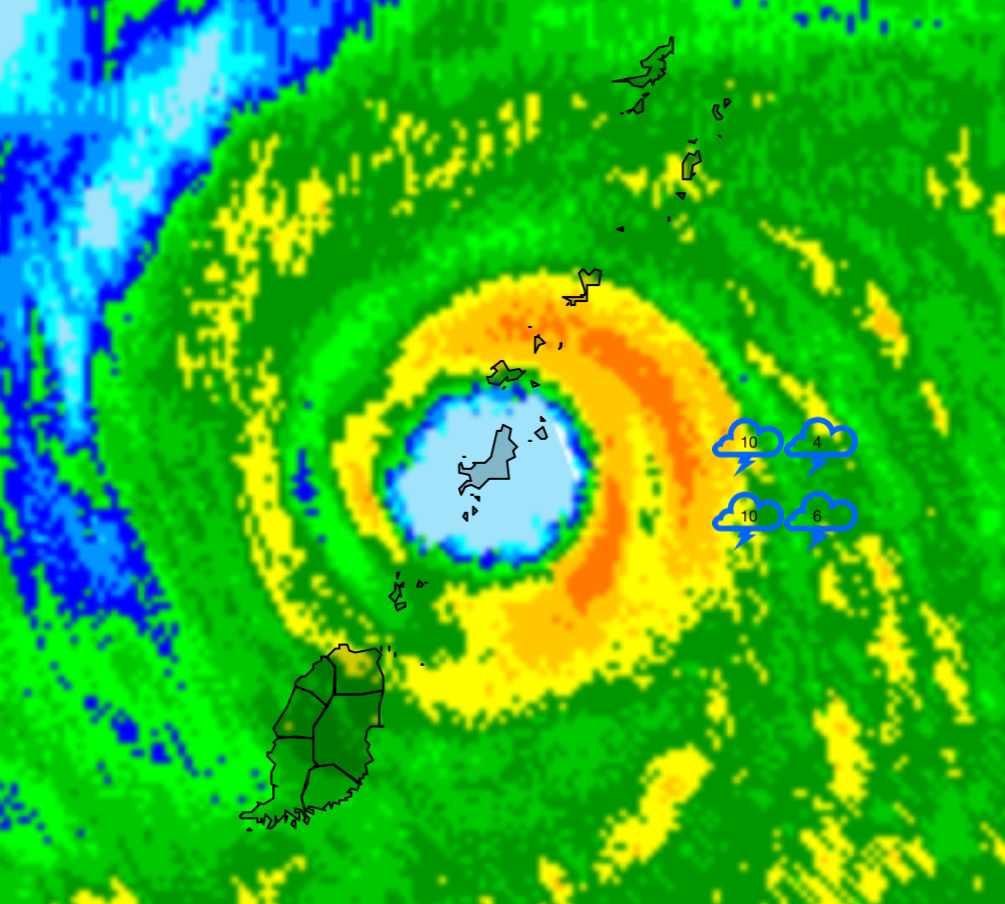
A radar picture to remember this storm by:

Looks like an eye-wall merger.
. -
Man it hit that island dead center.
. -
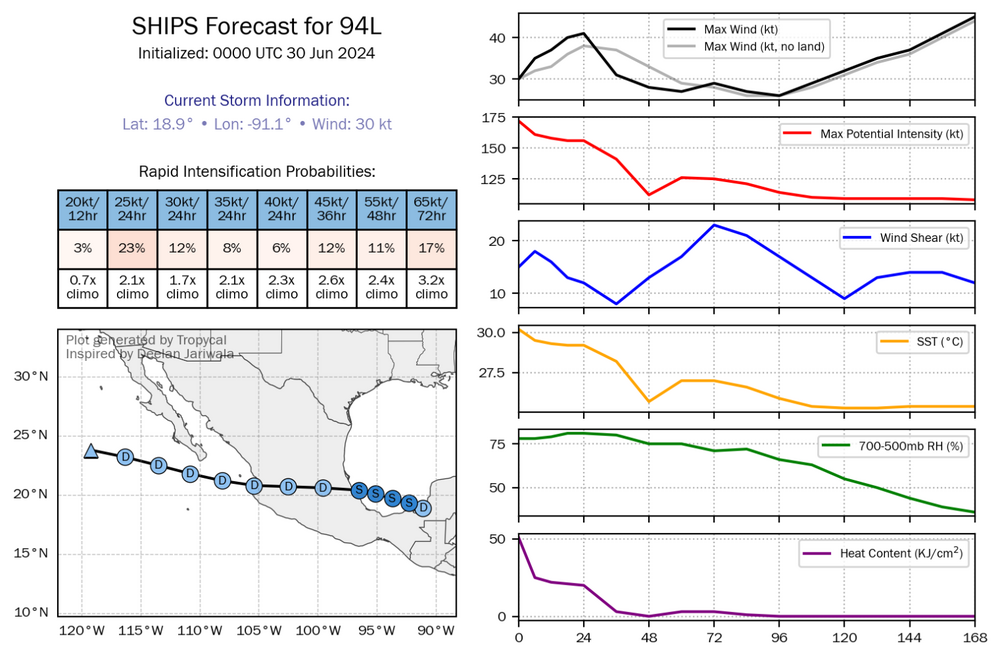 94l might actually luck out jfl
Should help Mexico City with the drought.
.-
1
-
-
You live in a different Chesco than I do. All I see is steady warming just like the rest of the world. Your own data says so.
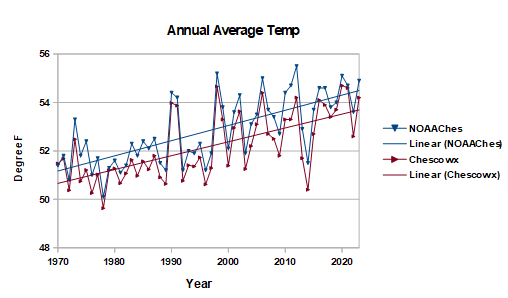
Is Chesco Co on planet Earth? Just checking.
.

Major Hurricane Milton
in Tropical Headquarters
Posted
I think this is our new normal at this point. Houses will have to be way back from the coast and built like bunkers.