


ORH_wxman
-
Posts
93,110 -
Joined
-
Last visited
2 Followers
About ORH_wxman

- Birthday 07/14/1981
-
18"....6" in one hour
-
BTV about 94" and SLK about 133". Of course, the Jan 1998 devastating ice storm was mixed in too that doesn't show up on the snow totals. The snow was crappier further east in NNE.
-
'97-'98 wasn't a horrific winter over interior SNE (ORH had 54.7")....Dec/Jan was actually above avg for snow....it was a horrific February that was the killer....which is ironic in an El Nino.
-
Prob safe to call the extent min now too....about a 130k increase in the last two days as rapid refreezing is occurring in the high central arctic basin. So it looks like the final minimums this year will be 2.711 million sq km on NSIDC area and 4.574 million sqkm on NSIDC extent.
-
Ice was pretty diffuse this year so the extent numbers aren't impressive. Too early to call the min quite yet as we're only about 20k above the 2026 min of 4.574 million sq km....but if that number holds, this would rank 11th lowest for extent minimum. This is for NSIDC (SSMI/S) extent....other sources like AMSR2 or DMI might be a bit different, but looking at them al, it's the same general idea. Extent minimum wasn't very low this year given the ice staying pretty diffuse and not compact.
-
NSIDC area is currently at 2.86 million sq km...which is about 150k above the minimum back on 9/8. I think it is getting fairly safe to say we've reached the minimum. It would be highly unlikely to achieve a loss greater than 150k this late in the season and with lots of easy lower concentration to refreeze near the pole right now. The 2026 minimum of 2.711 million sq km would be 7th lowest (barely staying above 2025's 2.706 million sq km)....so we just barely miss on a top 5. Last 20 years of SSMI/S minimums since 2007's benchmark season: 1 2012 2.228429 2 2016 2.463209 3 2024 2.470035 4 2020 2.5859 5 2023 2.62866 6 2025 2.707455 7 2026 2.71105 8 2019 2.871403 9 2011 2.916451 10 2007 2.954993 11 2017 3.000742 12 2010 3.072129 13 2008 3.079552 14 2015 3.139137 15 2021 3.1658 16 2022 3.20126 17 2018 3.235357 18 2009 3.547109 19 2014 3.576643 20 2013 3.607877
-
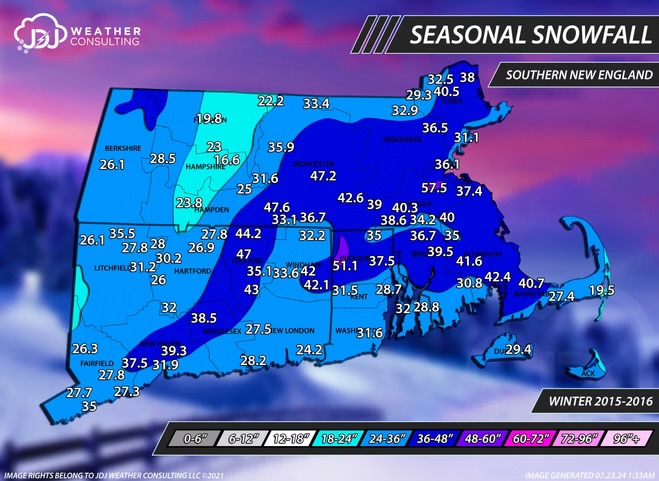
2015-16 wasn’t that bad for snow in southeastern areas…actually kind of impressive considering a near complete shutout in December that season
-
I've said that one way to cheat our way into a good winter is to get something like Dec 1997 pattern (pretty close to normal temps that month) but instead of Feb 1998, we get a more classic Nino Feb.
-
Big GOA low is pretty consistent with super Ninos.....that composite isn't very cold due to that GOA low placement....but the AO/NAO region is good enough that we could def score some chances in that type of pattern. If you want to go gangbusters though, you'd have to retrograde that GOA low about 1000 miles west. I think the way you'd get multiple chances in this type of Nino is to follow that Dec '97 type pattern and then hopefully get something more like Feb '83 instead of Feb '98. But there's no way to know any of that this far out. Dec 1997 had a block in a similar spot to the Roundy plot. Despite the terrible placement of the AK vortex that month, the block there and the east-based NAO blocking gave us enough seasonal temps and synoptic advantage to grab some legit chances in New England. Obviously the big one was 12/23/97 but a lot of people prob forget how close 12/29-30/97 was to being a monster snowstorm....ended up being a decent front ender over interior, but it went up through CT valley. Also had a close miss a couple days earlier that scraped SE areas.
-
If we get some sustained -AO periods, I think we'll have some good chances for big events....I'm def favoring a warm winter, but we know El Ninos can also be really schizophrenic....you could have obscene warmth for 3-4 weeks and then get pummeled for 2-3 weeks too (this happened in the '82-'83 winter). I think the best hope for big snow this winter will be to get into a super juiced Nino pattern while we have a favorable AO....and then you end up cleaning up for a 3 week period.
-
Currently 8th lowest on NSIDC area. (GaWx has been posting AMSR2 area which is good too, but for consistency purposes, I track NSIDC area since methodology is unchanged since 1979.) Chances of top 5 now are getting slimmer by the day. Too much extended cold on the ESS/Beaufort side this season. You usually want a strong start there so that you are eating away at the CAB in late July and early August rather than wasting those few precious final weeks of higher insolation trying to melt out remnant ice in the Chukchi/ESS/Beaufort.
-
NSIDC extent is actually at a record low for today’s date. But due to the factors explained above, it probably won’t sniff a new record this year.
-
See my response above to GaWx…not familiar with climate reanalyzer but it’s probably pretty accurate given that AMSR2 area is very low too. NSIDC area is quite low as well, just not as low as AMSR2 or climate reanalyzer. But we aren’t that interested in getting the most accurate area measurement right now for “seasonal minimum” record purposes. We’re more interested in what can give the most accurate forecast…which I outlined above in that response.
-
AMSR2 area is totally fine as an instant metric. It’s more accurate than NSIDC SSMI/S area….but the key is that SSMI/S area has much more predictive power than AMSR2 area. SSMI/S (what NSIDC uses) gets fooled by melt ponds whereas AMSR2 not nearly as much. But we actually like that SSMI/S gets fooled by melt ponds because melt ponds in June are more predictive of seasonal minimum area than AMSR2 area itself. So we’re basically using SSMI/S as a proxy tool for meltponding. This is why there are some years where we may be flirting with the lowest extent or area late in June and I’ll make a post that says a new seasonal record is almost impossible and many will ask why or in earlier times, call me crazy and a science denier. The reason is that meltponding isn’t prolific enough to sustain huge melting deeper into the summer. The second half of June was quite cold in the Beaufort/Chukchi region which has the highest sea ice area in the post-2007 arctic right now at this point (nearly tied with 2009). That is another bearish sign for a new record. That region is typically where we see huge losses in record or near-record low sea ice years. A lot of the low area numbers are currently being driven by record low sea ice in Hudson Bay, Greenland sea, and Baffin Bay. These are mostly irrelevant to the minimum later in the season. In fact, if you go just by arctic basin (Beaufort/Chukchi/East Siberian Sea/Laptev/Central arctic basin) plus CAA (Canadian Archipelago) composite area, the only post-2007 years that are higher than 2026 are 2009, 2013, and 2014. Those also happen to be the 3 highest minimums post-2007.
-
As of 6/29, 2026 sea ice area is 7.09 million sq km. This is currently 5th lowest: 2012: -380k 2010: -280k 2019: -170k 2024: -40k 2011: +2k 2020: +4k 2025: +10k Still another day or two before I run the numbers but a new record is nearly ruled out. Top 3 is definitely still on the table.


