chubbs
-
Posts
4,096 -
Joined
-
Last visited
About chubbs

-
Chester County PA - Analytical Battle of Actual vs. Altered Climate Data
chubbs replied to ChescoWx's topic in Climate Change
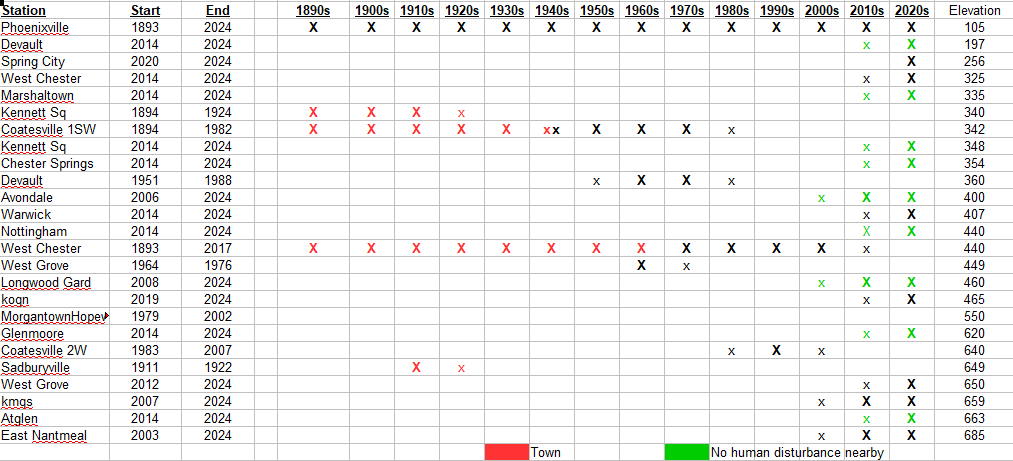
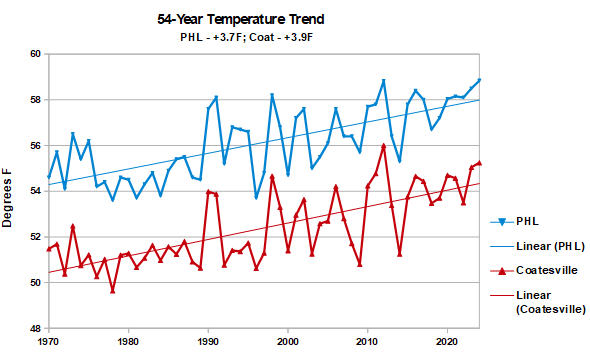
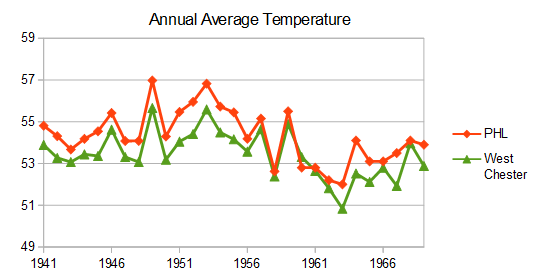
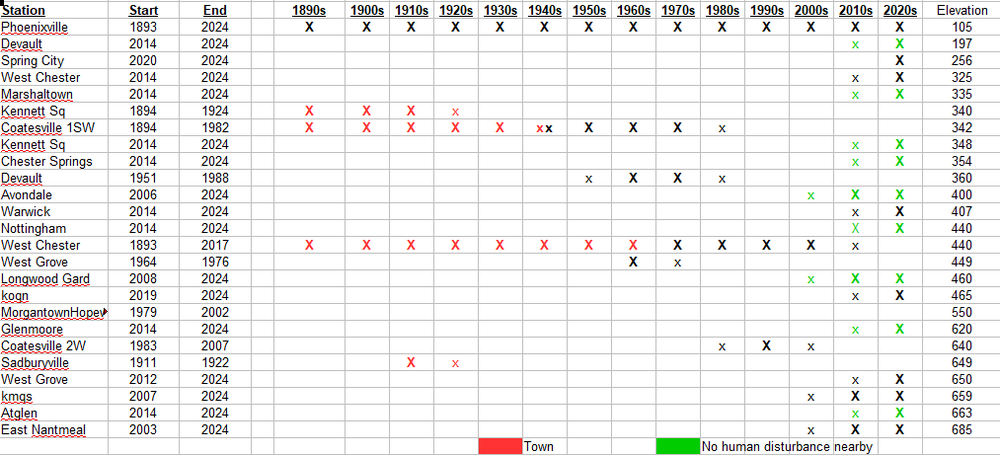
Reposting some of the charts I posted previously. Your line doesn't look anything like the raw data from individual stations. There is no significant difference in warming between individual Chester County stations and the Philadelphia Airport. Of course cooling station moves should be excluded. That's why the West Chester plot ends in 1969. Per the table below, there are big changes in the Chester County station population that you aren't accounting for. In comparison, the Philadelphia airport heat island is mature and isn't changing much from decade to decade. If heat island is important, why ignore the movement of Chester County stations out of towns after World War II?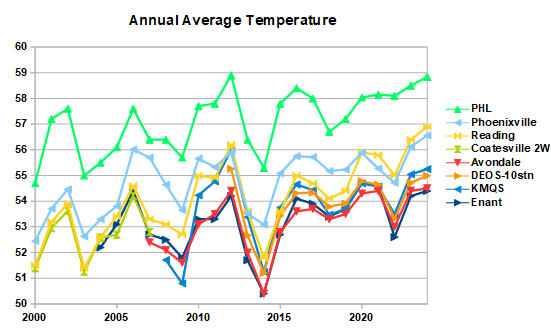
-
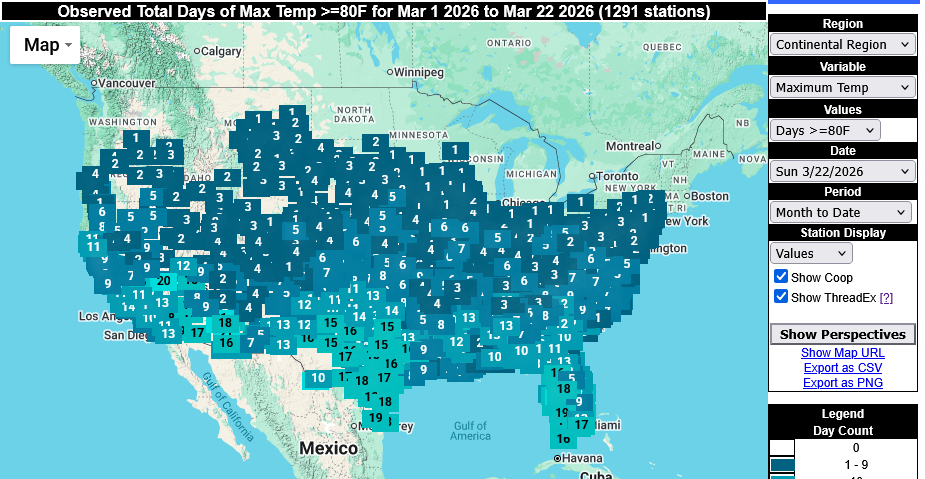
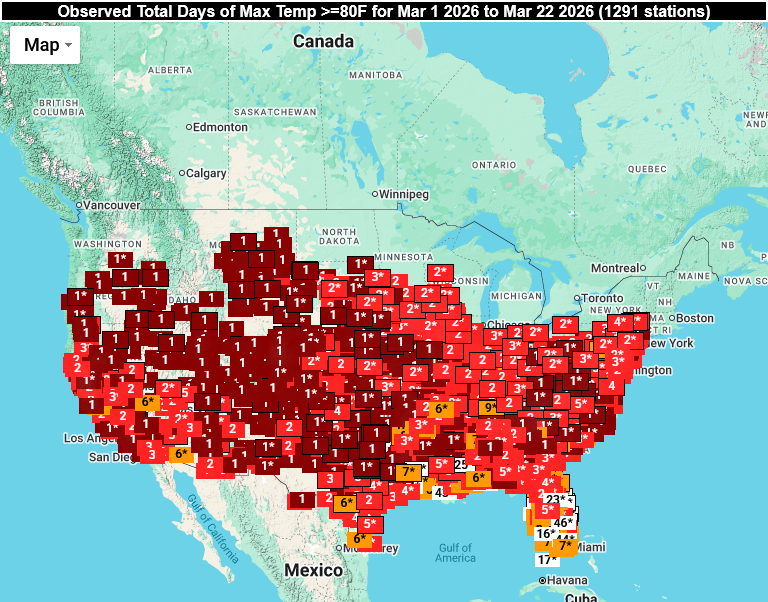
I should have been clearer. The chart I posted is the ranking of the number of days over 80, with #1 being the highest. Below is the number of 80+ days on which the ranking is based.
-
Days hitting 80F, month to date.
-
Thanks for updating, what I posted must have caught the database at a bad time.
-
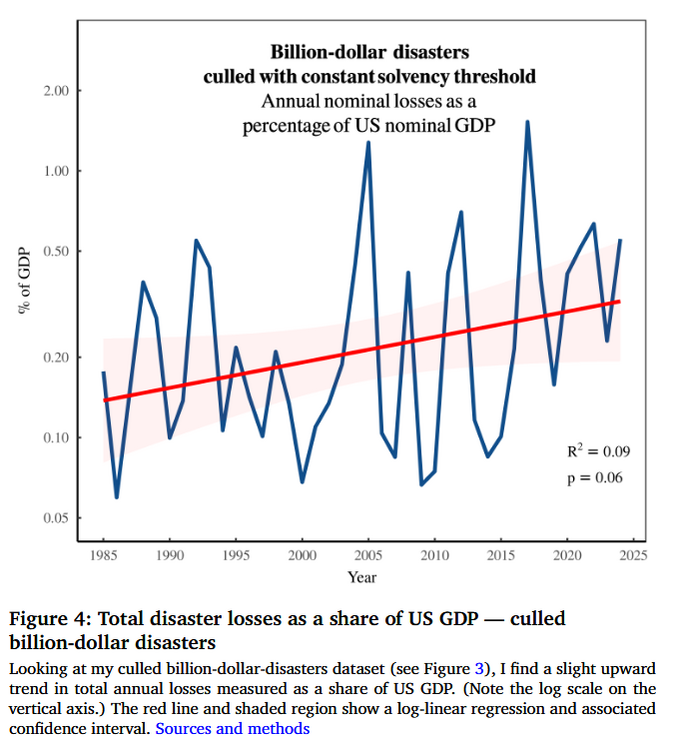
As explained in detail at the link below. Pielke's results have nothing to do with natural disasters. Instead they are an artifact of his analysis method. When the same database is analyzed properly. US disaster costs are increasing as percent of GDP and the number of disasters is increasing. https://www.econstor.eu/bitstream/10419/334359/1/20251026_fix_roger_pielke_jr.pdf
-
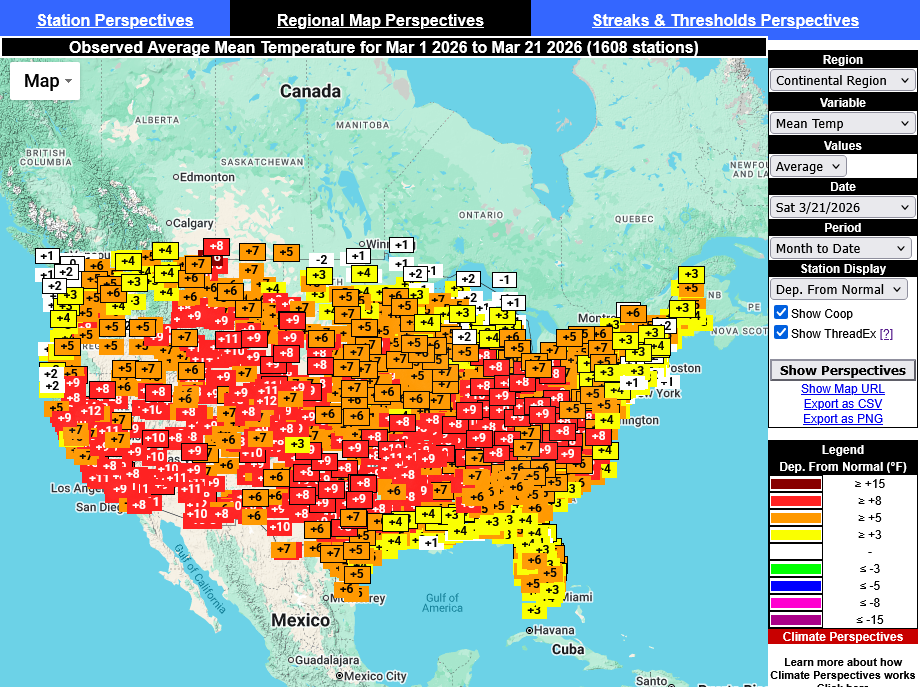
That's what we have seen so far this month, CONUS-wide warmth.
-
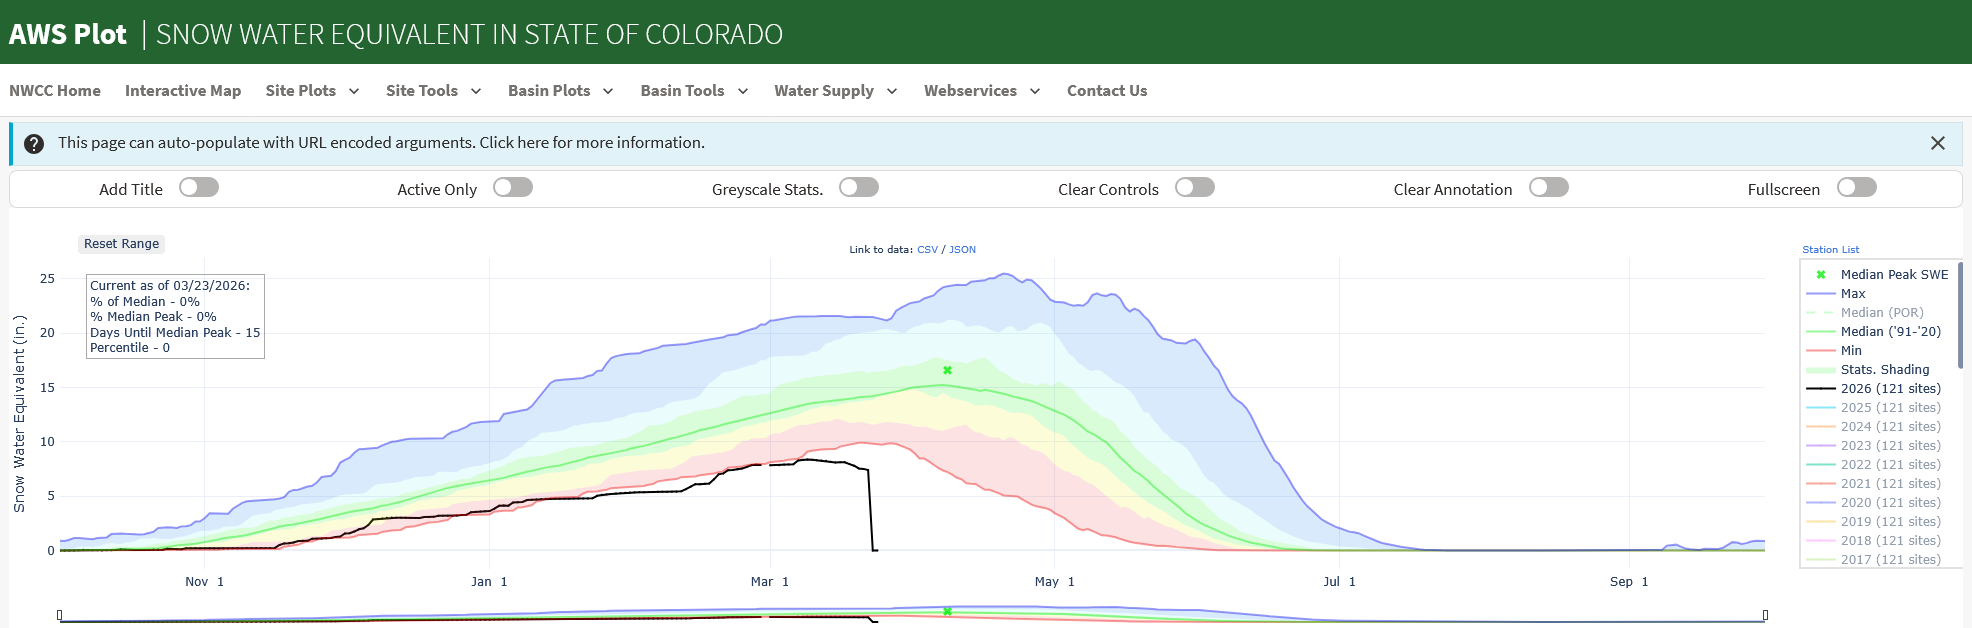
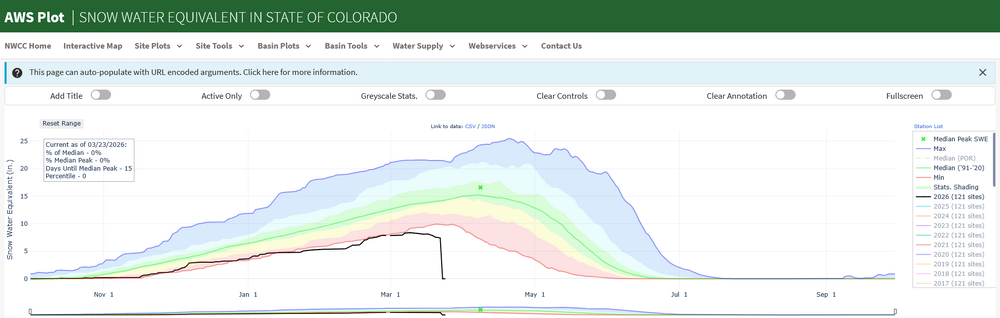
Here's a climate first. The Colorado snowpack is gone 15 days before the typical peak.
-
Animation showing the records tied or broken in the past 24-hours. Pink are March records.
-
A couple of points to add to Don's. The absorption bands of CO2 and H2O are different. There's overlap in some regions, but CO2 also absorbs in regions where H2O doesn't. More importantly H20 has a much higher boiling point than CO2 and is a liquid at atmospheric temperatures while CO2 is a gas. Because of the higher boiling point, the amount of H2O in the atmosphere is controlled by temperature. As Don points out, CO2 is more important relative to H2O in the upper atmosphere where heat is radiated to space and it is too cold to hold much water vapor. Per paper below, CO2 is the earth's thermostat. CO2 controls the amount of H2O in the atmosphere. If there was less CO2 there would be less water vapor and vice versa. As the paper states: Without the radiative forcing supplied by CO2 and the other noncondensing greenhouse gases, the terrestrial greenhouse would collapse, plunging the global climate into an icebound Earth state. https://www.science.org/doi/10.1126/science.1190653
-
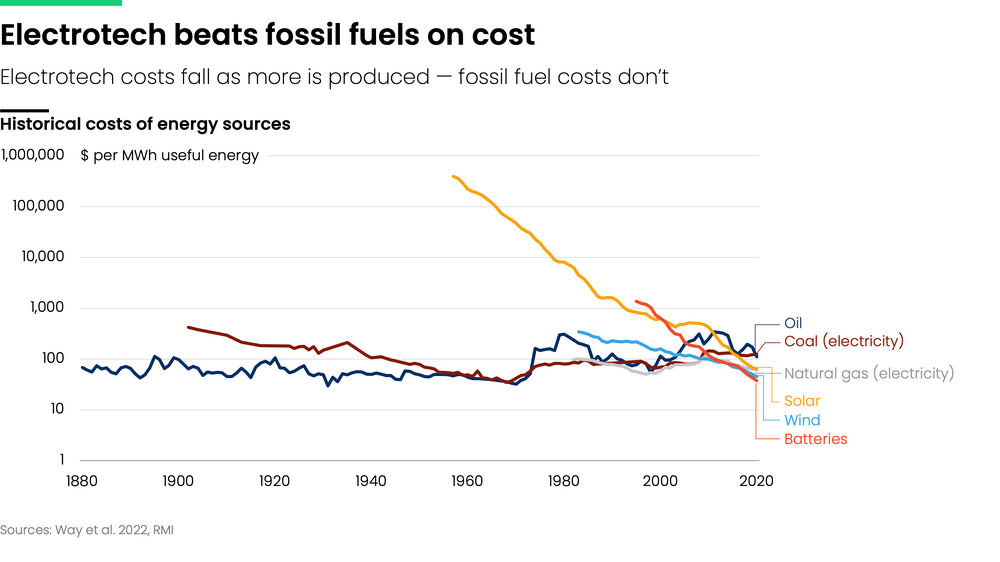
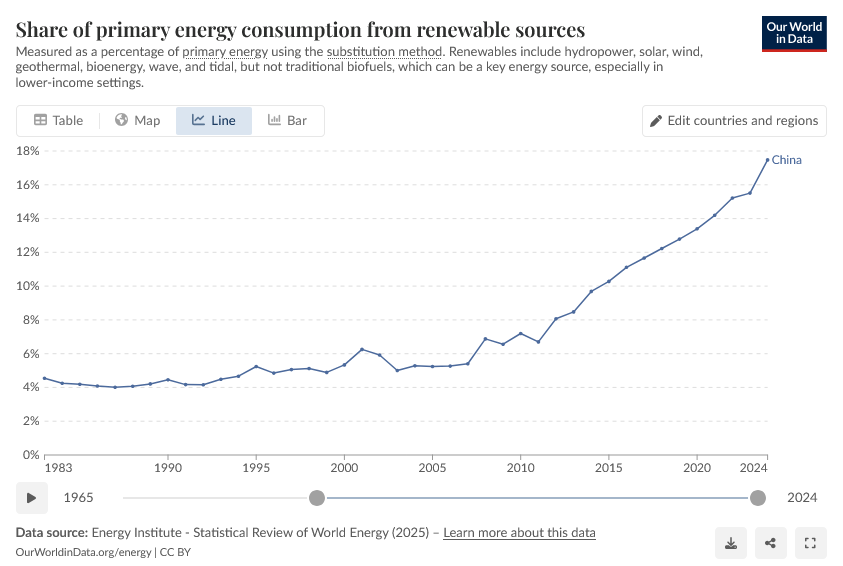
Funny people can take the same data and come to different conclusions. The point you are missing is that energy technologies: solar, wind, batteries, EV etc., are getting better and cheaper on well established technology improvement curves. Until recently these technologies weren't competitive with fossil fuels. However, going forward they are going to have an increasing cost advantage and subsidies will be less and less important. As an example, China is ending their subsidies of electric cars. Yes, China is still building coal plants, but renewable share of electricity generation is still growing rapidly, and coal use in China dropped last year.
-
No the big difference in my EV chart and yours, is the US vs global. The final numbers aren't in yet, but global EV sales grew by roughly 20% last year, held down by slowing sales in the US. The US is a laggard in both EVs and solar with costs higher than the rest of the world due to tariffs and other factors. Expect the global EV ramp to continue in 2026 spurred by the current oil crisis. https://www.instituteforenergyresearch.org/international-issues/ev-sales-grew-20-globally-in-2025/
-
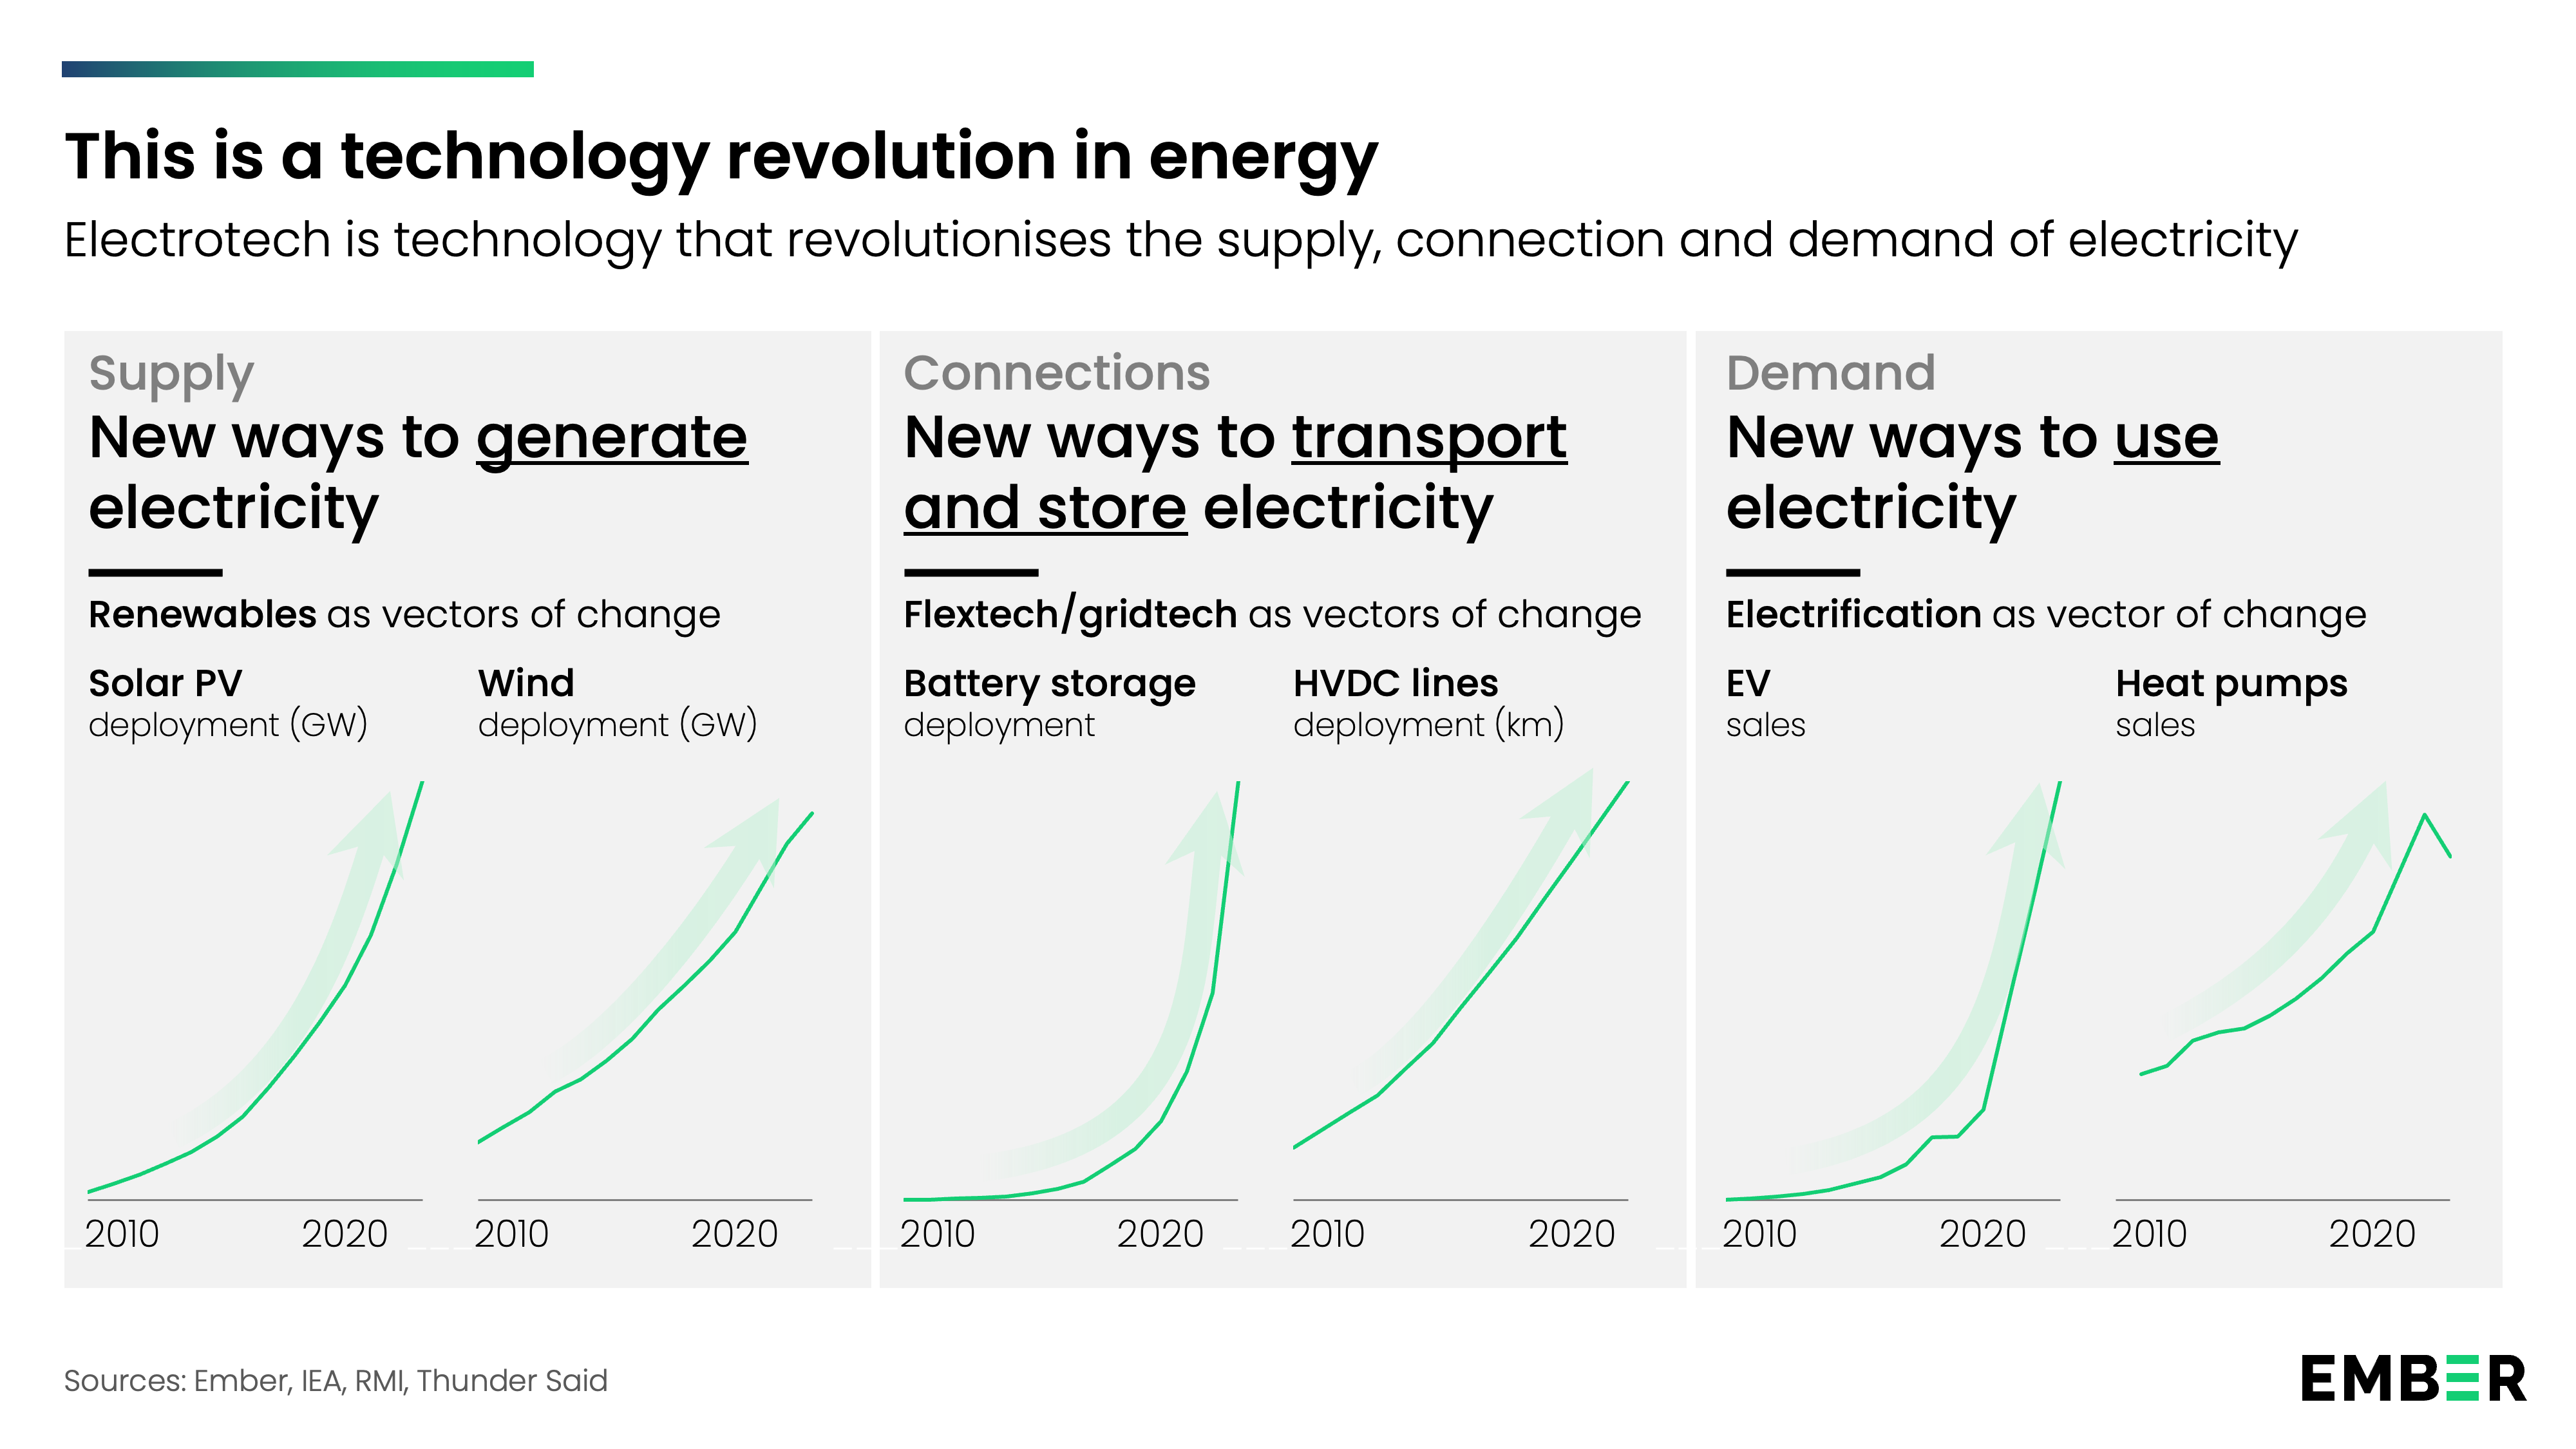
Most of the misleading information I see comes from fossil fuel and utility incumbents. For instance, per top link below, the "expense" of additional baseline power to backstop renewables is a fossil fuel fallacy. Renewables are becoming cheaper. Not everywhere and in every application; but, the long term trend is clear. In the future fossil fuels will be less competitive than they are today. Its not only renewables. A number of key energy technologies are on long-term improvement curves: batteries, EV, heat pumps etc. They work together to make energy generation, storage, transmission and use cheaper and more efficient. Meanwhile fossil fuel use is a mature technology; that uses a diminishing resource; and, that carries geopolitical and climate risk that isn't baked into the price. https://www.electrotech-revolution.com/p/renewables-allow-us-to-pay-less-not https://ourworldindata.org/cheap-renewables-growth https://www.electrotech-revolution.com/p/what-is-electrotech-and-what-will

-
The other problem for nuclear has been CO2 accounting. We'd have much more nuclear with stronger climate policy. I am bullish on nuclear long term reflecting ongoing technical progress; but, it isn't going to contribute much in the US in the next decade or two. We should be on a build everything path, with a cost penalty for CO2.
-
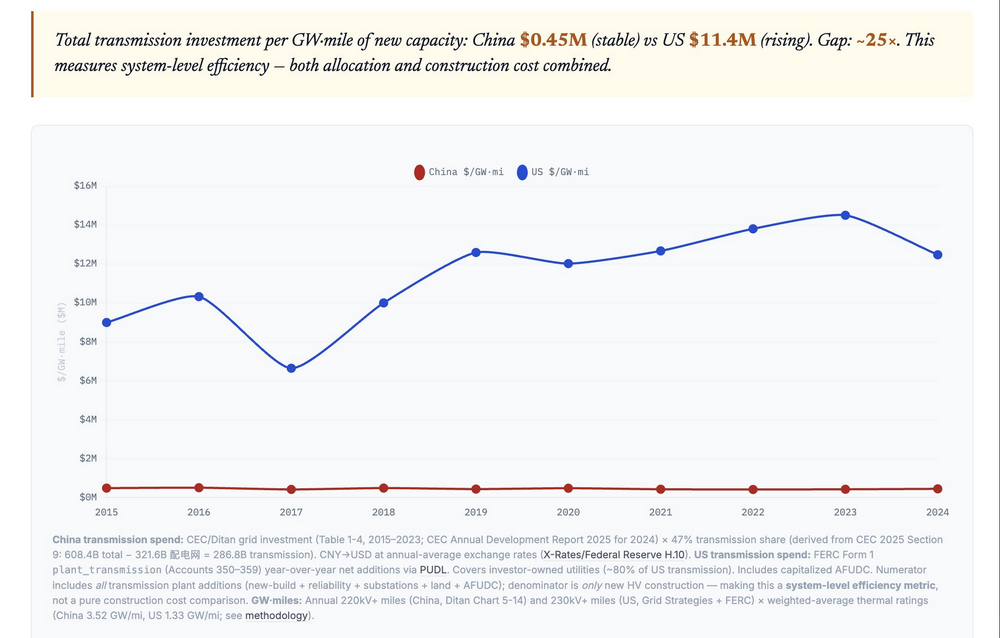
Yes the grid is a big problem in the US. Link below is a long thread on the US vs China grid. We aren't competitive, as an illustration per chart below, China gets 25x the payback from grid investment dollars. The thread doesn't mention batteries, which can mitigate grid investment somewhat. The developing global south, with abundant local solar, may avoid heavy grid investment. https://x.com/NiyerEnergy/status/2032265048723259781
-
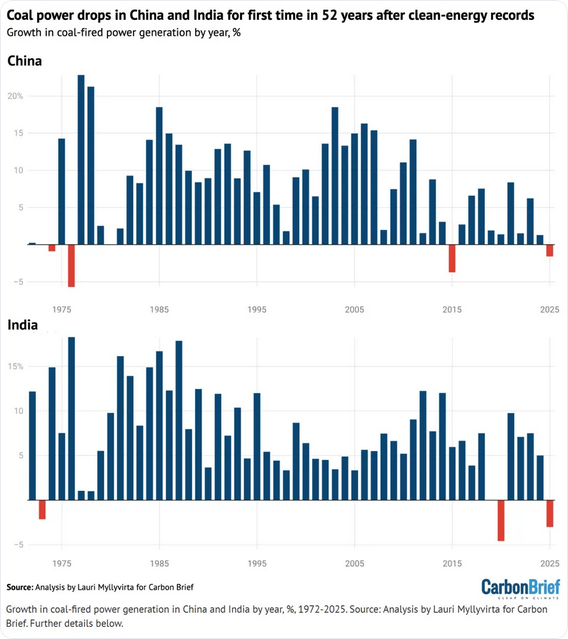
Yes fossil fuels are energy dense, but that is only one aspect of the comparison and its not very important; i.e. renewables are cheaper despite lower energy density. The energy density of solar is higher than the energy density of civilization; i.e., roofs, parking lots, etc could power our cities. Your chart of India and China reflects the past not the present, yes CO2 use grew rapidly as both countries industrialized. However, coal use has peaked in both countries. Oil has peaked in China; and, China's CO emissions decreased last year. India is only beginning to use EVs; but, EV use is ramping.