
heavy_wx
-
Posts
1,614 -
Joined
-
Last visited
Content Type
Profiles
Blogs
Forums
American Weather
Media Demo
Store
Gallery
Posts posted by heavy_wx
-
-

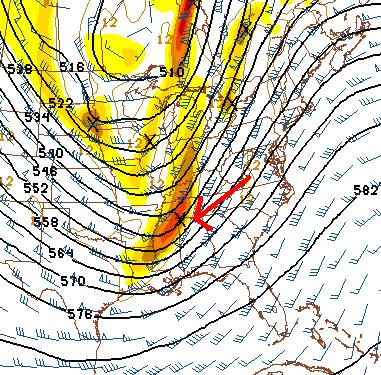
This will certainly be a very dynamic event. The image above shows a pretty good setup for heavy precipitation in central PA with the area between the right entrance region of the northern jet streak and the exit region of the southern jet streak (add in some curvature on the latter and that increases the favorable lift for our area). You can see below that this circulation is also tied to mid-/low-level frontogensis; this region of enhanced lift moves northward Thursday afternoon and will be associated with the heaviest precipitation.

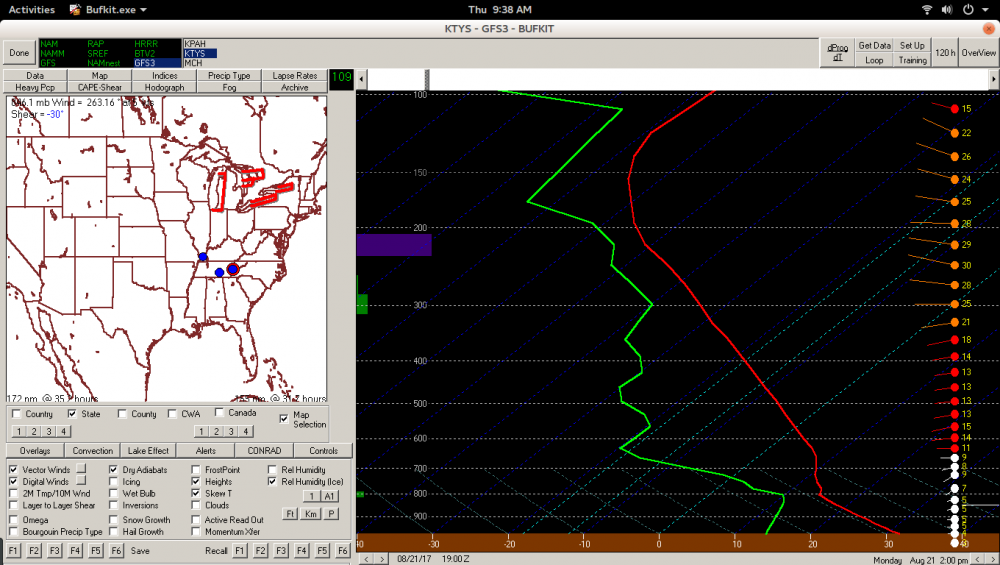
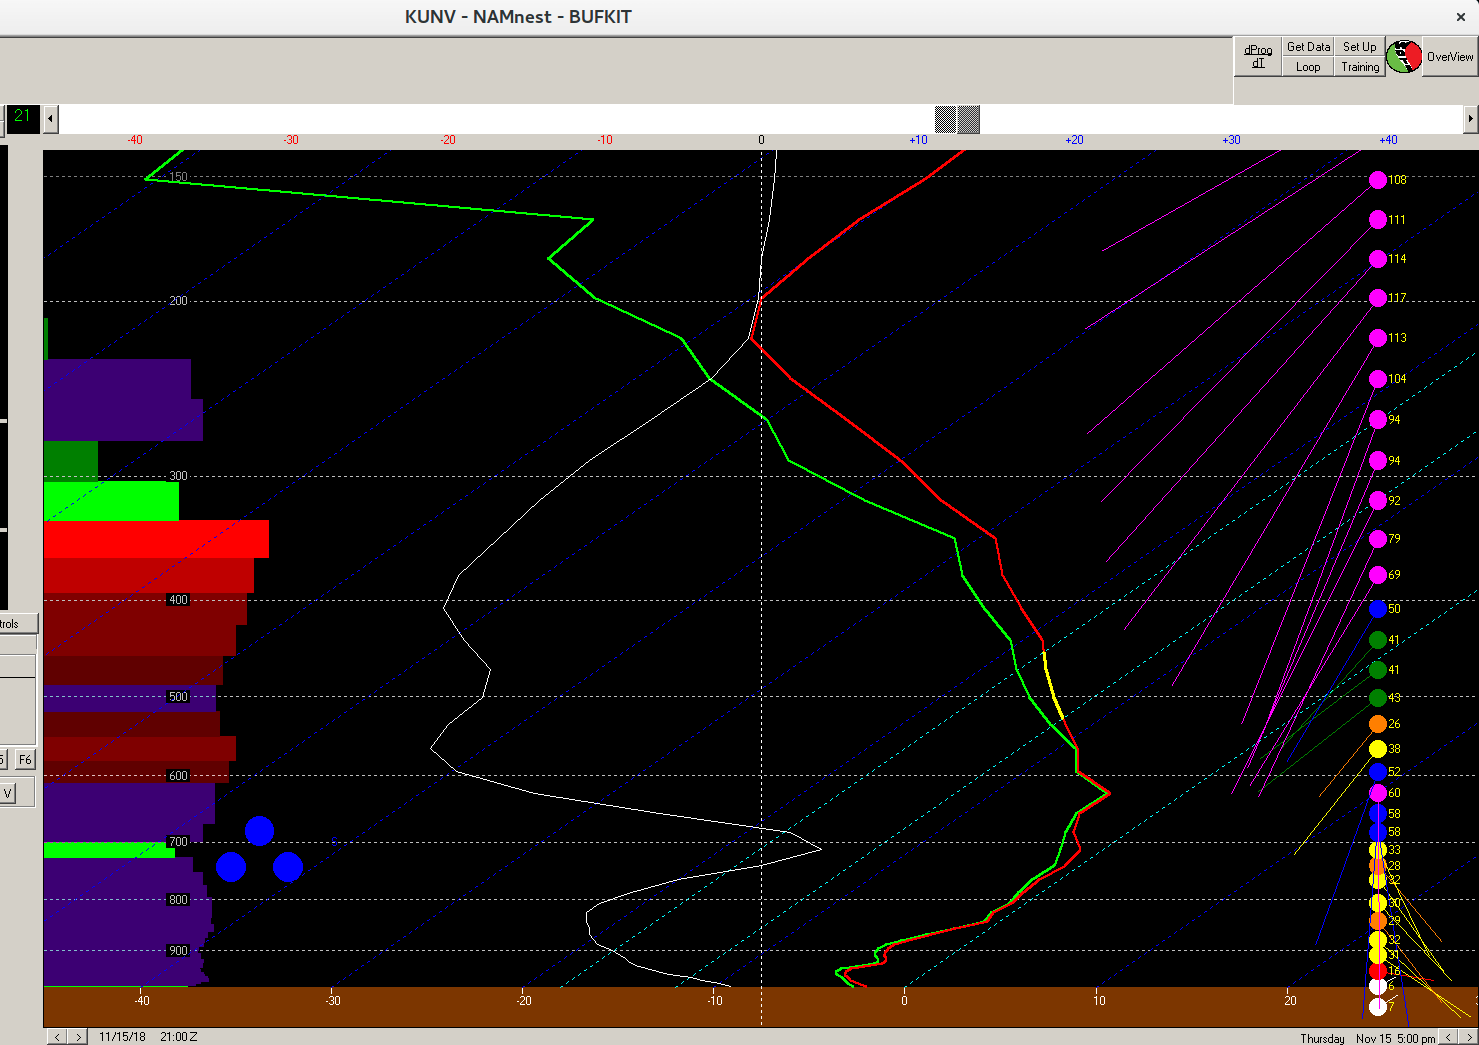
A forecast profile from this time shows the maximum lift (i.e., negative omega) around 600 mb at UNV. It happens to also coincide with the dendritic growth zone so that, coupled with the near-freezing temperatures between 850-750 mb should lead to very large, wet aggregates around this time.

The duration of snow vs IP or ZR is of course predicated on how resilient the cold air will be at low levels. There is noticeable 500-mb confluence over northern New England currently, helping to promote anticyclogenesis and associated cold ageostrophic flow into our region. However, the surface high moves eastward and weakens late Thursday into Friday, allowing for temperatures to warm above freezing the in the 800-700 mb region. Things do cool off again for potentially another round of moderate snow as the energy from the secondary low moves east through the region Friday morning (probably more favorable for areas in eastern PA).
It's definitely a cold airmass for this time of year, but I have been burned before up here with mixing occurring earlier than expected. Will be a fun one to watch!
-
On 5/3/2018 at 2:43 PM, MillvilleWx said:
Well guys. I know it has been a while since I last posted in here, but I wanted to say thank you all for the support over the years and allowing me to be part of the weather family that is the Central PA sub-forum. The reason I am saying this is because I will be moving this summer and embarking on my journey west, full-filling my dream as a National Weather Service Meteorologist out in Midland, Texas. I will also be getting married in early June prior to heading out and my last full-time shift at my current position is tomorrow. It has certainly been a pleasure and I will make sure to check in on occasion, especially with any big Winter Storms on the horizon. But for now, I will be trading in my snow hat for a hard hat as I head to the land of the dry line. I couldn't be more excited!!
Congrats, enjoy the "real" storms out there!
-
 1
1
-
-
1 hour ago, canderson said:
Do any of you use RadarScope as an app? I bought it for my iPhone last night and was just curious what the best option is (IE Super-Res Reflectivity (tons of tilt options), Base Reflectivity, Precipitation Depiction or Composite Reflectivity)?
I don't know much about the actual radar data so was curious what I should use as default. I chose NOAA's 20 Frames over WDT. I don't know what WDT means exactly ...
I use it quite frequently, especially for the dual-pol observations. For reflectivity, I use the super-res, because its basically the same resolution as the "raw" level-2 data; the other ones are processed further and are lower resolution. The composite reflectivity is the max return in height observed by the radar at given location (though areas closer to the radar only have limited coverage in height, so precipitation aloft may not be detected). I usually go with the lowest-level tilts because those will be most representative of what's happening at the ground. Of course if you are interested in looking at precipitation at higher levels above you, go for the higher tilts!
WDT is a company that provides the radar data over the internet. I think it can be faster if lots of people are looking at the data at the same time (e.g., during chase season or other high impact weather events).
Let me know if you have any other questions about radar. I happen to study radar meteorology here at Penn State.
-
1
-
-
Things have definitely greened up noticeably in the past couple days here. Interesting tracking the backdoor front; KIPT dropped about 8F in the last hour with northerly winds while it's still in the low 80s here.
-
7 hours ago, skiier04 said:
KUNV getting some bonus april fringe? lock it in.
Haha, we have become so cynical up here.
Anyway, definitely more chances for snow in the next two weeks, and more waiting for those of us seeking warm weather...
-
2 minutes ago, ice1972 said:
Legit there were people in the park where I was breaking down their equipment the second the diamond ring effect signifying the end of totality was over....other people chilled and were very much less interested in it......I mean lets face it.....the ending partial phase is like riding the carousel right after you just got off Kingda Ka....
Yeah, not a bad analogy.
-
4 minutes ago, ice1972 said:
It's funny how the partial phase after totality is so meh after the main show is over......I stuck around until maybe 50% then I bailed too.....
Yeah, I was kind of planning on doing that beforehand anyway just because I had a long drive back. I probably would have stayed around a bit longer otherwise.
-
26 minutes ago, Hoosier said:
Yeah, it was much worse getting out than getting in. There were people leaving where I was literally just a minute or two after totality ended, but I stuck around for about a half hour to watch some of the partial phase. Might have helped somewhat to get out immediately but oh well.
I left maybe 10 minutes after totality. Traffic was fine on I-40 east until I got to the exit ramp. All of the local roads from Tennessee into Kentucky towards I-75 were bad, and it ended up being a 5-hour drive to I-75 that takes under 3 hours without traffic. After a few miles on I-75 traffic was fine and opened up a lot once I got to I-64 east in Kentucky. That part of the trip was definitely helped by the lower populations of West Virginia, western MD, and central PA.
-
I ended up witnessing the total eclipse at Edgar Evins state park 60 miles east of Nashville. The build-up to totality was amazing; it got noticeably colder and the cumulus died as if an outflow boundary had swept through the area. The light got noticeably dimmer, and it kind of looked like those scenes in old movies where they film shots in the day and darken them to make it seem like night. Totality itself was of course awesome; light from the corona seemed to extend away from the sun in a wishbone shape, with one wispy strand of light to the left and two strands to the right. We were also able to see Venus, and I think Mercury during totality.
My favorite picture of the event (the only one I took during totality):

-
3
-
-
Leaving for TN soon. Good luck everyone!
-
Got to my hotel in Richmond, KY. Very light traffic from PA through MD, WV, and KY. I'll probably head south for central TN around 5 am, and hopefully there won't be much traffic at that time.
-
20 minutes ago, Paragon said:
I'll be driving up I-81 from around the Scranton area, how long would it take for me to get up there? Should I budget around 4 hours?
Watertown is about 3 hours from Scranton. But maybe it's a bit early to plan lol.
-
1
-
-
19 minutes ago, Paragon said:
Oh, no
 and this is your first total solar eclipse too I take it? I haven't seen one yet either. How is climatology for Watertown on 4/8/2024? I don't know anything about the local climate in that area but I'm planning to be there (hopefully.)
The best bet might be the cumulus shadows near the Ontario and Erie lake shores. Of course in April, there could also be widespread overcast throughout the Great Lakes.
-
1
-
-
Just now, ice1972 said:
Yep.....I can't wait.....its gonna be a little solo adventure for me to in the nations heartland.....never been to any of those states before other than the drive through or airports.....I was gonna go to Nashville initially - I have a friend that actually lives just south of there - but then I was worried about being in that TN to SC corridor where there are tons of people coming......and contending with traffic.....so I opted for the Wisconsin angle where I have another friend that offered up her couch on Monday night.....looks like the hotel I booked in Omaha is the way to go ATM......didn't see that coming.....still time to adjust
Same, I've never been to Kentucky or Tennessee. I'm thinking I'll probably leave my hotel in KY around 4-5 am just to be safe with regards to traffic. I have plenty of work to keep me busy while I wait anyway...
-
2 hours ago, winterymix said:
Then Missouri-Tenn. corridor looks....hot and 30% clouds. Am more concerned with cirrus than mid level clouds.
Cumulus and mid-level can dissipate between 1st and 2nd contact.
Those smarti-pants in east Oregon may have 80s and sun....
Some supersaturation wrt ice around 200 mb but otherwise southeastern TN is looking pretty good as of now.
-
21 minutes ago, bdgwx said:
Absolutely. This is will likely be the most studied eclipse ever. I'm kind of curious what GOES-16 will show. Will we be able to make out the umbra shadow? Also, modeling is showing a pretty unstable airmass for much of the path so it'll be interesting to see what effect it has on cloud patterns and obviously the temperature too. One obscure research topic is the "eclipse bow wave" which is a form of gravity wave that lags the shadow by 15-30 minute and ripples out at several hundred mph. Will we be able to see these with GOES-16?
I think one of the MODIS passes should cross the path of totality.
-
8 minutes ago, ice1972 said:
True.....whats your thought on the traffic as you get closer to ground zero? What time do you think you will leave Monday morning?
I think it's probably best to be at your intended viewing location at least a couple hours before the eclipse. I would definitely avoid big metro areas like St. Louis or Nashville if possible. Major interstates near the path of totality will probably be OK a few hours before the eclipse. Interstates that connect directly to large cities like I-55 and I-70 in Illinois, I-65 in IN/KY, and I-75 in KY may be pretty busy early in the day if people are driving south for the day.
I'm considering going to Sparta, TN because it isn't near any north-south interstates and it's also not really that close to I-40, so traffic shouldn't be bad a few hours before the eclipse.
-
18 minutes ago, ice1972 said:
Ya thats something I do not want to have to contend with that day......anywhere south of St. Louis.....I picked Fayette since its north of I-70 and I won't have to use an interstate to get there from Quincy......I can adjust as we get closer but really really really don't want to have to go south or southeast......that area southeast of St. Louis into southern IL and western KY is gonna be a ****show with max eclipse happening there....
It's only like an extra second longer in southern IL vs. central MO so I'm not sure that will really cause people to seek out that area especially; weather and convenience are probably the dominant factors in where people end up going. Getting to the center of the totality path is also important if you want a longer eclipse.
I booked a hotel in Richmond, KY for Sunday night with plans to drive into central TN or western KY depending on the weather.
-
29 minutes ago, psuhoffman said:
Yea it's a lot more complex then I got into. And someone else (like you) is probably better then me for those that really want to get into the fine details of this. I did get into some of that stuff in my meteorology classes but I haven't used it all that much and that was 18-20 years ago now.
Most of us including me probably aren't pouring over all the plots needed to get into each meso scale factor. Wish I had that kind of time. The h5 vorticity is a good poor mans way to get a basic quick look at what's going on.
Plus usually when we hear a lot of vort max talk it's because we're dealing with a pretty pathetic surface system (like last night) and we're relying on the lift associated with the h5 vort to give us a little something. In this case to pop a weak surface reflection and a very small band of precip.
I love this stuff. I've wasted days reading through my old textbooks on meso stuff. Of course it's funny cause when it comes to looking at longer range stuff which is usually what I'm doing this year (ugh) the meso stuff could be a waste of time. Even from 48 hours I could spend time looking at where the best lift is based on meso features then the whole synoptic setup shifts 50 miles and it's pointless.
Really want to go back and finish my meteorology degree but I'm not sure how I would use it. I like teaching (assuming I don't lose my job due to the current financial crisis in Maryland) and have a family to consider. It's probably something I'll do later on just for my satisfaction. Perhaps then get duel certified in science and find a school that would let me teach it as an elective or as a major unit in earth science.
Yeah, I think folks who have been looking at model data and observations for a while know from experience where to expect the heaviest precipitation in relation to a 500 mb PV max. I like looking at where banding sets up in relation to mesoscale jet streak circulations because it gives some physical insight into why enhanced precipitation may occur over a certain region. Hopefully we have at least one nice example this winter!
I have a friend with a B.S. in meteorology who teaches a meteorology lab at a state university part time, so that could be one option.
-
10 hours ago, psuhoffman said:
Usually when we say vort we mean a vorticity maximum embedded in the 500 mb flow. It's a measure of vertical vorticity or spin along a vertical plane. Positive vorticity advection or pva is important in a basic sense because it enhances lift which is what causes precip.
The h5 map below shows a vort max. The specifics can get complicated and I am tired but this is a really good explanation I found a while ago.
http://www.weather.gov/source/zhu/ZHU_Training_Page/Miscellaneous/vorticity/vorticity.html
if you still have any specific questions I'd be glad to try to answer them
Technically, we correlate synoptic scale lift to differential positive vorticity advection (actually differential cyclonic vorticity advection, to include our friends in the Southern Hemisphere), meaning that PVA increasing with height, not simply PVA, is correlated to lift. However, in the case of cyclogenesis, most of the time PVA is stronger at 500 mb than below so PVA at 500 mb is generally a decent proxy for positive differential PVA.
Of course, a lot of the precipitation associated with cyclogenesis is due to mesoscale processes such as frontogenesis, where semi-geostrophic theory is more appropriate than quasi-geostrophic theory. Check out this presentation for more information about frontogenesis and how it produces lift.
-
On 3/3/2012 at 7:08 PM, dtk said:
In many data sets, particularly for observations, the "level" usually is in reference to the amount of processing that has been done to the raw measurement. For NEXRAD, you can find descriptions for
Level2 Here: http://www.roc.noaa.gov/WSR88D/Level_II/Level2Info.aspx
and
Level3 Here: http://www.roc.noaa.gov/WSR88D/Level_III/Level3Info.aspx
Way late, but just to add, there are actually Level 1 WSR-88D radar data. These data are the raw voltage time series at each range gate and are used by the signal processor to calculate the Level 2 "base" moments of reflectivity, mean Doppler velocity, spectrum width, correlation coefficient, differential reflectivity, and differential phase. Level 1 data are not archived because they require more storage space than Level 2 data and very few users find the time series data useful. Time series data can be used to estimate the full velocity power spectrum, which can give us more information about the types of particles within each radar sampling volume.
The Level 2 data are considered "raw" data because little quality control or smoothing is done to the base moments. For example, if you compare differential reflectivity from a Level 2 source to that from a Level 3 source, you can see that the Level 2 data is much noisier. The noise would be further reduced if the radar sent out more pulses, but that would increase the dwell time and lead to less frequent sweep updates.
Level 3 data are thus further processed Level 2 data where the base moments are smoothed to reduce the noise, specific differential phase is calculated from differential phase, and other products such as radar-estimated precipitation are derived. One drawback with the Level 3 data is that only the lowest 4 elevation scans are processed in this way, so information from the higher elevation angles is only available in the Level 2 data.
-
I put this together after it was pointed out on a few "Denier Sites"
I'm really trying to figure how they came to this maps conclusions. This type of map will end up as a media release, completely glossing over and basically removing an otherwise COLD February.
Ashville, NC for February +0.1 = Above Average.
Hartford, CT -5 for February = Near Average.
Just disgusting.
That map clearly shows how it was a much colder than average February for parts of the upper Midwest. It was also an anomalously warm February in the southwest US.
The raw temperature departures don't tell the whole story; there is significantly more variability during the winter in the Midwest vs. the southwest US. Using the example of Needles vs. Lansing, one standard deviation of mean February temperatures is 4.9F in Lansing and 2.9F in Needles. This past February had a greater number of standard deviations from the mean temperature at Needles than Lansing so the warmth there was more unusual than the cold in Lansing.


Central PA Fall 2018
in Upstate New York/Pennsylvania
Posted
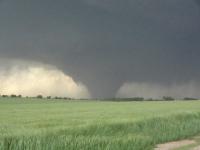
Seeing some of the largest aggregates of the event right now in State College. A sign of both improved snow growth and temperatures approaching freezing aloft.