
heavy_wx
-
Posts
1,619 -
Joined
-
Last visited
Content Type
Profiles
Blogs
Forums
American Weather
Media Demo
Store
Gallery
Posts posted by heavy_wx
-
-
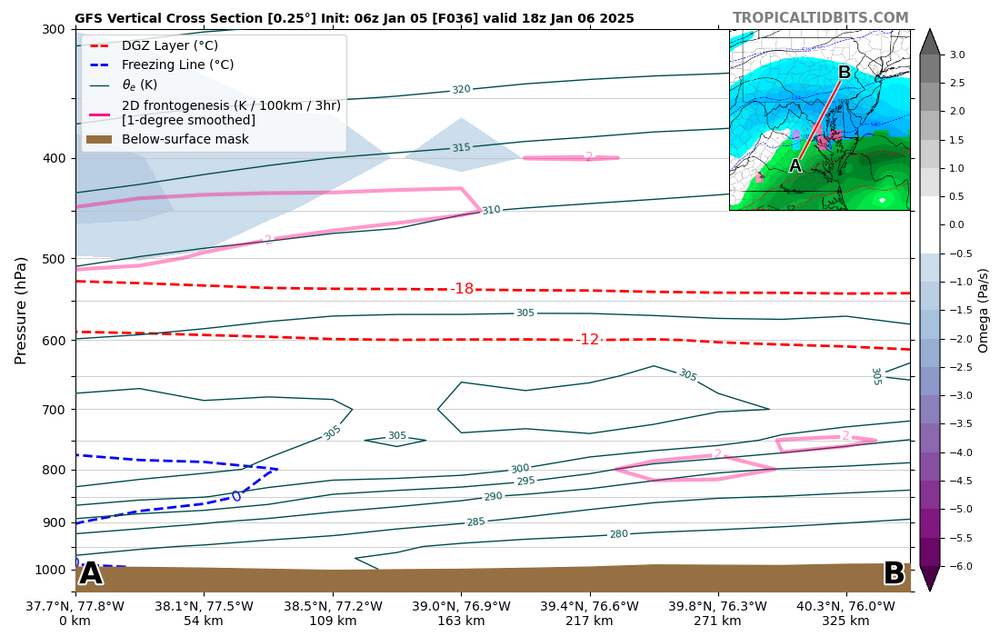
Interesting signature for banding in the 06z GFS (and 06z 3-km NAM) around 12z-18z Monday, just as the dry air starts to work in above 600 mb. This dry air above the lower-level moisture produces convective instability above the frontal surface between 750-650 mb south of the frontogenesis max around 800 mb. This instability would favor vertical motion and ice crystal generating cells just to the north of the approaching dry air. Given the temperatures > -12C and the likely presence of supercooled water, graupel is a definite possibility within this area of precipitation.
-
 6
6
-
 2
2
-
 1
1
-
-
We are within the ~25-dBZ reflectivity band here and getting steady light snow with mostly small aggregates.
-
5
-
-
We're getting some flurries here now.
-
4
-
-
Saw the bright pink colors here in southern MoCo.
-
Getting some melting snow here in the heavier bursts of precip.
-
Wet snowflakes just starting to mix in here.
-
Snow mixing with sleet now in North Bethesda.
-
1
-
-
Aggregates starting to get bigger here as the temperatures warm aloft and the band of heavier snow approaches.
-
2
-
-
Flurries here in North Bethesda.
-
2
-
-
Some flurries now in North Bethesda.
-
1
-
-
39.14N, 76.85W
-
Moderate-sized aggregates falling now.
-
Light snow with small flakes here.
-
1 hour ago, CAPE said:
Wed looks glorious. Under full late Feb sun too. Condolences to those protecting their snowpack.

If the clouds do hold off ahead of the cold front, it could be one of those days where the models underestimate surface solar radiation (and thus surface temperatures) owing to the lack of foliage this time of year.
-
Moderate snow with wet aggregates here.
-
Pretty much all sleet here in North Laurel.
-
1 minute ago, frd said:
Imagine your rates , darker blues, banding, etc., and location is helping too , here is it meh. Many corporations in northern Delaware closed due to the winter storm warning. I doubt we see 4 to 6 inches of snowfall here. But, I will wait before declaring complete failure for 3 out of the 4 storms this season Oh, I shouldn't even use the word storms, implies something major, not.
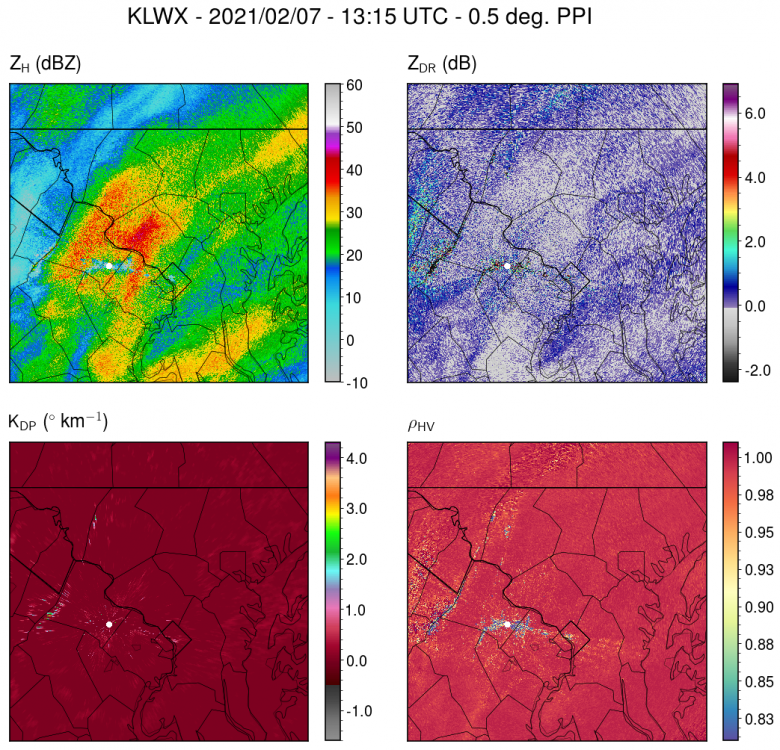
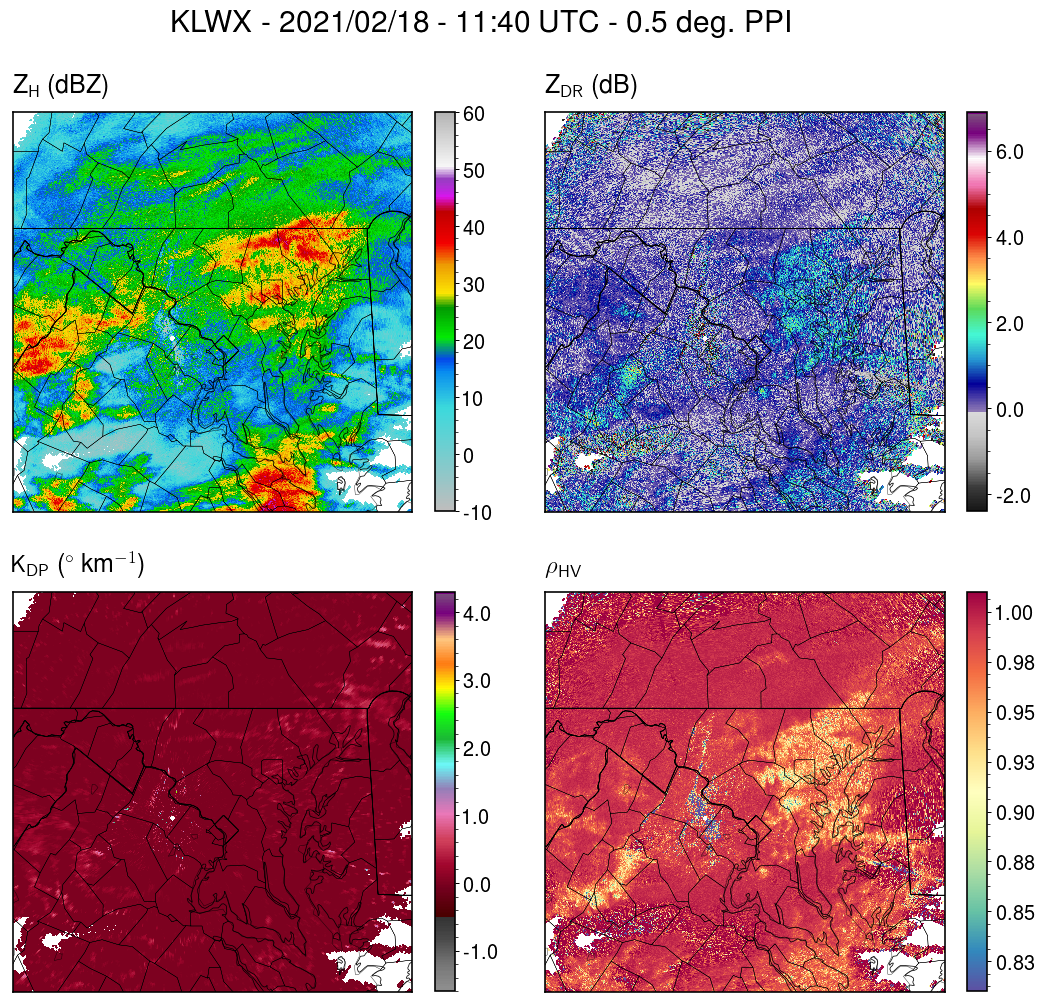
This event is a good example of why these "precip-type" radar maps are often flawed. The indicated precip type is not based purely on radar data; they add supplemental model data to determine the likeliest precip type at the location of each radar observation. The dual-polarization observations, however, show the sleet/snow line from southern Carroll County northeastward into PA, where reflectivity (ZH) and differential reflectivity (ZDR) values are enhanced due to bright banding, and correlation coefficient is reduced due to a mix of melting particles with different shapes. SImilarly, the rain/freezing rain transition is where the correlation coefficient increases south of Anne Arundel County, with both ZDR and ZH values decreasing here as raindrops dominate the backscatter.
One other thing to note is the higher correlation coefficient and lower ZH and ZDR closer to the radar site in northern VA. The lack of a melting signature here is because the radar beam is closer to the ground at these locations and thus propagates beneath the melting layer; once the radar beam is higher off the ground at locations farther from the radar site, the polarimetric melting layer signature is visible. When the beam gets high enough, it samples above the melting layer and the signature disappears, as correlation coefficient becomes close to 1 and ZH and ZDR values decrease.

-
5
-
5
-
-
I measured 2.5" here with light snow currently. The amount of sleet mixing in last night definitely contributed to the south-north snowfall gradient in Howard County.
-
1
-
-
Mostly sleet here in southern Howard County with a coating of frozen precip on the ground.
-
Light snow here.
-
I got about 0.5" here in North Laurel.
-
Light rain with some wet aggregates mixed in here.
-
2 minutes ago, WxUSAF said:
Measured 0.5” at 830. Measured 0.5” at 940.
The coating of snow that was on the pavement here has melted.
-
Snow sizes have become much smaller here just east of the highest reflectivity (~40 dBZ) over Montgomery County.
-
3
-


January 5-6 Thing Storm Obs
in Mid Atlantic
Posted
Measured about 5" of accumulation here. There are currently some large aggregates falling within the region of 30+dBZ reflectivity in southern MoCo.