
Jonger
-
Posts
29,711 -
Joined
Content Type
Profiles
Blogs
Forums
American Weather
Media Demo
Store
Gallery
Everything posted by Jonger
-
-
Looks bad.... My 4+ prediction, should bust. Amazing how little we hear about geoengineering or sequestration. I have to wait years for anything interesting to come across the news. I bet it could all melt out tomorrow and not another nickel would go into either of these ventures.
-
What made you choose Lakewood? I thought all snow weenies live on the NE side of town.
-
Is there a summarized version of the current deal?
-
Already, the ruptured storage facility has released well over the equivalent of 800,000 metric tons of carbon dioxide – about the same amount that would be generated by driving 160,000 cars for a year, according to the California Air Resources Board. I'm guilty of it as are most of you, but I'm sick of burning dead plant material and gases. Can we simply take half the military budget and divert that to solar/wind farms and end this nonsense?
-
These are probably seasonal fluctuations. Those areas don't have carbon sinks being released, unless it's forest fires.
-
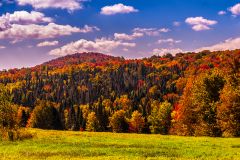 Wow these colors are looking to peak soon... How high up is this?
 -
I'm just not seeing a big increase in ch4 from Fracking.... It's certainly not showing up in monitoring data. China and Russia just signed a big natural gas agreement, the purpose is to phase out coal. I sure hope this works, it could directly reduce co2 emissions and reduce black carbon emission.
-
It is interesting. There is actually a downward trend from 1999 till 2005.
-
Perhaps methane is the key to the puzzle and not co2.
-
There are far more concerns with coal. Mercury, acid rain and localized pollution. Most charts I see, show methane levels flattening out compared to the 1984-2000 level of rise.
-
The link doesn't work for me. I'm guessing it might show an increase in global methane concentrations paralleling the increased use of fracking?
-
Where is everyone posting over there. Its pretty dead from what I see. Is there a forum like this?
-
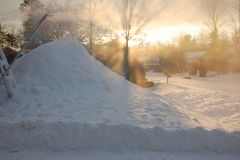 Is that real snow on the other neighbors yards or drift from your man-made?
 -
These articles really do damage to the chicken or the egg co2 arguement in past warming from ice cores. Did co2 cause the warming or did warming cause the co2. Dispute my hypothesis.
-
So a warmed planet can release at least twice as much co2 than our current atmosphere holds? You do know what I'm thinking right?
-
Doesn't methane break down in 10yrs in the atmosphere?
-
Looks like a cow wandered next to the sensor.
-
Or not.
-
It sounded rediculous and not worth responding to.
-
Wtf
-
Where else do you believe the methane deposits came from? The earth is in a cool period right now and thats the only reason we even have ice caps.
-
That methane thats under the ice was probably the remains of plant/organic material that was left behind when there were actual plants growing in those spots.
-
How much methane was released when the last iceage ended and a size of ice several times larger melted then we have today. The ice we have at the poles today is a fraction of the original sheet.
-
Bug attacks are the next worry. This comes straight from wunderground.com Dr.Masters. http://classic.wunde...um=2000&tstamp=