

donsutherland1
-
Posts
21,799 -
Joined
Content Type
Profiles
Blogs
Forums
American Weather
Media Demo
Store
Gallery
Posts posted by donsutherland1
-
-
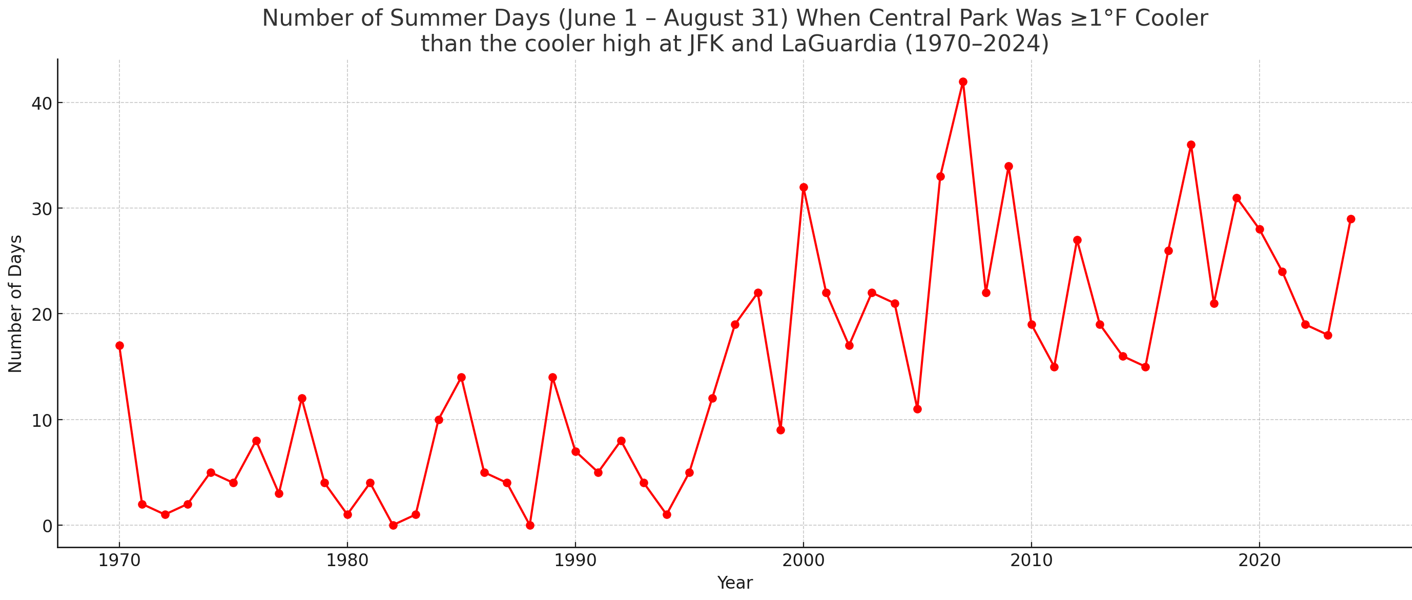
Another look at Central Park's summer temperature issue:
During 1970-1995, there were 5.4 days per summer when Central Park's high temperature was 1° or more cooler than the cooler high at JFK Airport and LaGuardia Airport.
During 1996-2024, that figure was 22.8 days.
Since 2000, that figure has averaged 24.0 days.
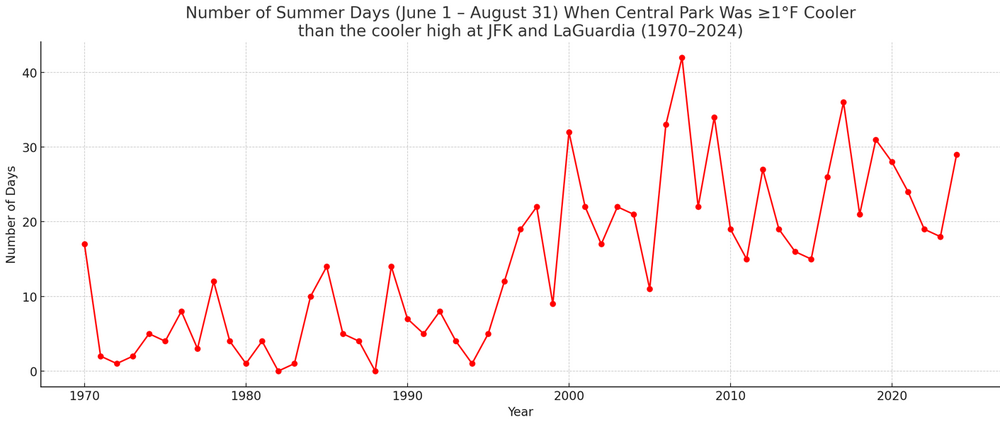
The change in those averages are even more dramatic for days when Central Park had a high temperature that was at least 2° cooler than the cooler high at JFK Airport or LaGuardia Airport:
1970-1995: 1.3 days per summer
1996-2024: 11.1 days per summer
2000-2024: 12.2 days per summer
Not all of this change has to do with the trees, but most of it does. One has seen smaller changes in the same direction for January 1-March 31 (no foliage) and October 1-December 31 (low foliage). However, the summer (full foliage) change is biggest.
Change in Days with Highs 1° or More Cooler than the Cooler High at JFK Airport and LaGuardia Airport:
1996-2024 vs. 1970-1995: January-March: +93%; June-August: +322%; October-December: +122%
Change in Days with Highs 2° or More Cooler than the Cooler High at JFK Airport and LaGuardia Airport:
1996-2024 vs. 1970-1995: January-March: +59%; June-August: +754%; October-December: +135%
-
 3
3
-
 1
1
-
-
Tomorrow will be warm with highs reaching the middle 80s across the New York City area. It will turn hotter on Sunday and the heat could persist through Tuesday. Highs will top out in the upper 80s to around 90° in New York City. New Jersey's hot spots will likely reach the lower and perhaps middle 90s.
The ENSO Region 1+2 anomaly was +1.0°C and the Region 3.4 anomaly was 0.2°C for the week centered around June 18. For the past six weeks, the ENSO Region 1+2 anomaly has averaged +0.47°C and the ENSO Region 3.4 anomaly has averaged -0.03°C. Neutral ENSO conditions will likely continue through at least late summer.
The SOI was +3.57 yesterday.
The preliminary Arctic Oscillation (AO) was +1.175 today.
-
2 hours ago, LibertyBell said:
JFK hit 100+ on all three of those days Don? I thought it was 2 while it was 3 at NYC?
2 consecutive days in 1948, not 3.
-
2
-
-
32 minutes ago, LibertyBell said:
That 3 at JFK must be the three straight 100+ from July 1966 Don. In July 2010 it was 3 days out of 4, I guess the one day in that stretch they didn't hit 100 they were also lower than 98.
Yes. There was also August 26-28, 1948.
-
1
-
-
2 minutes ago, Roger Smith said:
I found three others (98+ over four days) ,,, one in 1933 (same dates as 1917, July 30 to Aug 2) 98 102 100 98) and also Aug 28 to 31 1953 (98 99 98 100) which were followed by 97 102, so six over 97 there. And in 1993 July 7-10 ran 98 100 101 102 with 97 on the 11th.
1977 had four at 97+ (July 16-19 ran 98 97 100 102) and 2001 had four at 97+ Aug 7 to 10 (99 99 103 97) ... June 4 1925 ran 99 99 98 96 and Aug 12-15 1944 was 97 102 97 96 (followed by 95 95 96 95). Aug 23 1948 was 95 103 101 100 95.
Yes. That's correct. I misspoke. I had checked whether 1917 was the longest streak and didn't check all the dates all of them occurred.
-
1
-
-
2 minutes ago, Roger Smith said:
That's interesting and I think Liberty Bell was wondering if any NYC spells of 98+ are longer than four days from 1917. Are those the records for each location? I haven't looked at data yet to check answer to his question.
Yes. Those are the records for each location. The 1917 stretch is the only 4-day streak on record for Central Park.
-
1
-
-
Today was another very warm day. High temperatures included:
Bridgeport: 90°
Islip: 90°
New York City-Central Park: 88°
New York City-JFK Airport: 89°
New York City-LaGuardia Airport: 92°
Newark: 94°Today was the third day this year that Bridgeport and Islip hit 90° or above while Central Park did not. That breaks the record of two such days that was set in 2006.
Parts of the region will experience a strong thunderstorm this evening. Afterward, generally warm weather will prevail through Saturday with readings mainly in the middle 80s.
It will turn hotter on Sunday and the heat could persist through Tuesday. Highs will top out in the upper 80s to around 90° in New York City. New Jersey's hot spots will likely reach the lower and perhaps middle 90s.
The ENSO Region 1+2 anomaly was +1.0°C and the Region 3.4 anomaly was 0.2°C for the week centered around June 18. For the past six weeks, the ENSO Region 1+2 anomaly has averaged +0.47°C and the ENSO Region 3.4 anomaly has averaged -0.03°C. Neutral ENSO conditions will likely continue through at least late summer.
The SOI was +13.30 today.
The preliminary Arctic Oscillation (AO) was +0.923 today.
-
1
-
-
1 hour ago, LibertyBell said:
the most consecutive 98+ days?
JFK: 3; LGA and NYC: 4; EWR: 6.
-
1
-
-
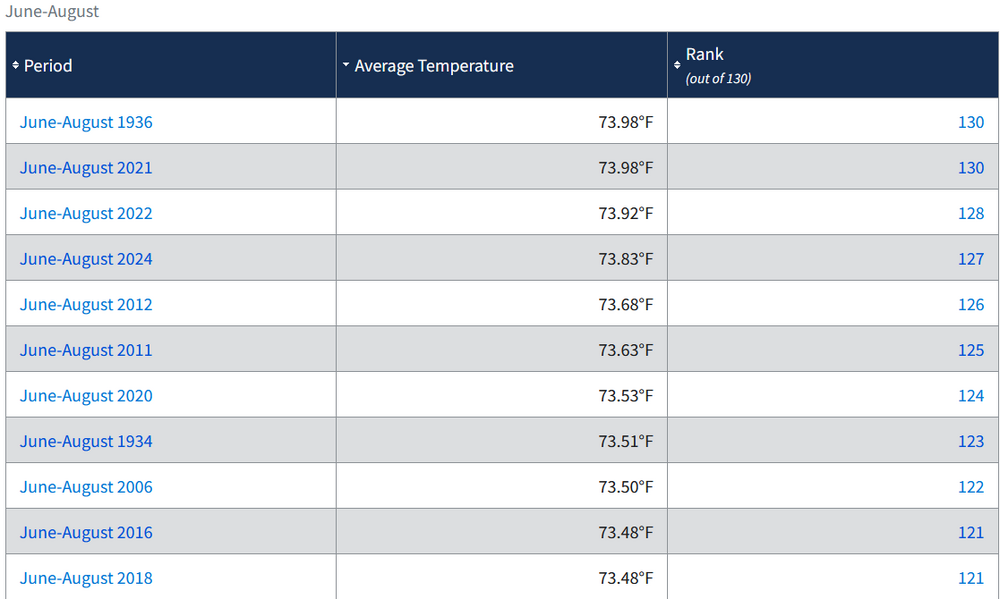
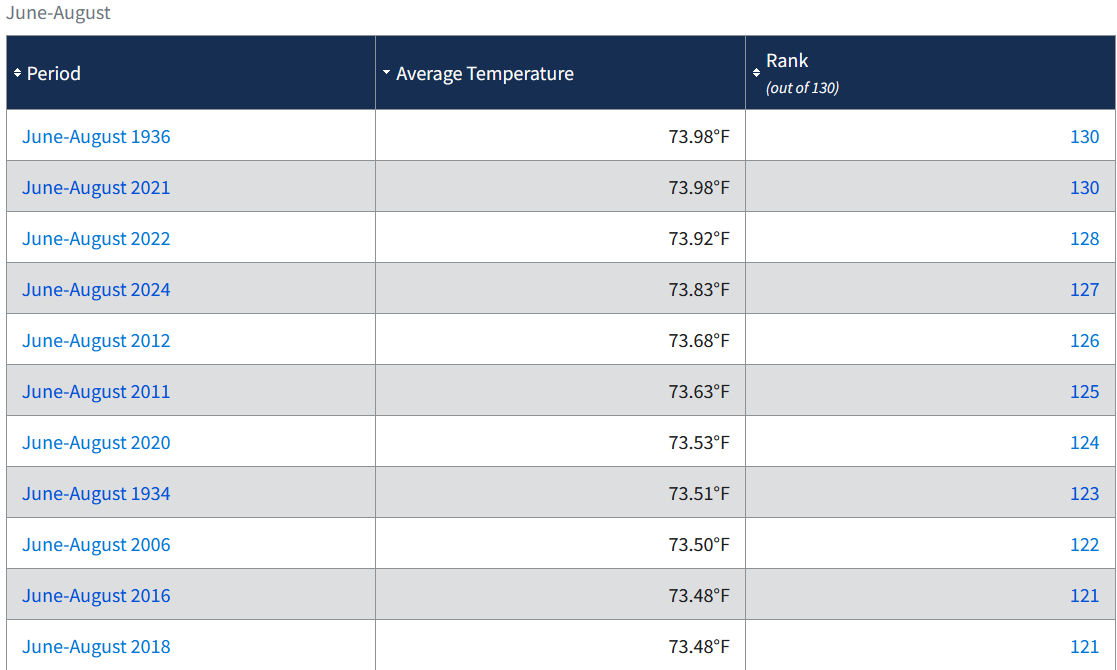
27 minutes ago, ChescoWx said:
Heck we might eventually get a warm as we were back in the 1930's in our current cyclical warming cycle.....
Setting aside extreme maximum temperatures in the area most affected by the Dust Bowl, on a nationwide basis, such summers have already been matched or exceeded. Only 136 retains the top spot (in a tie).
-
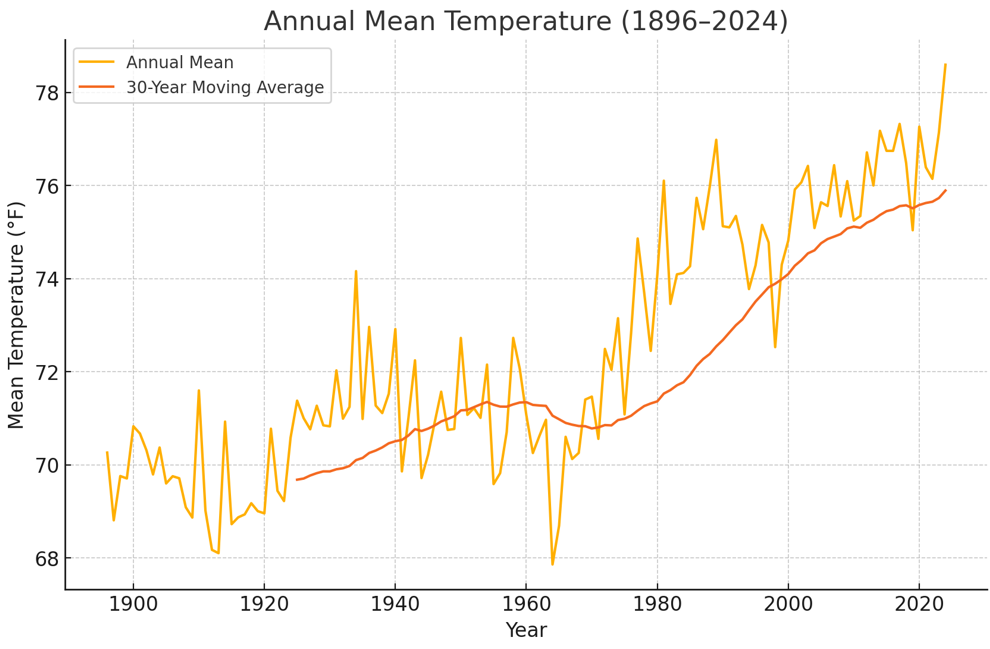
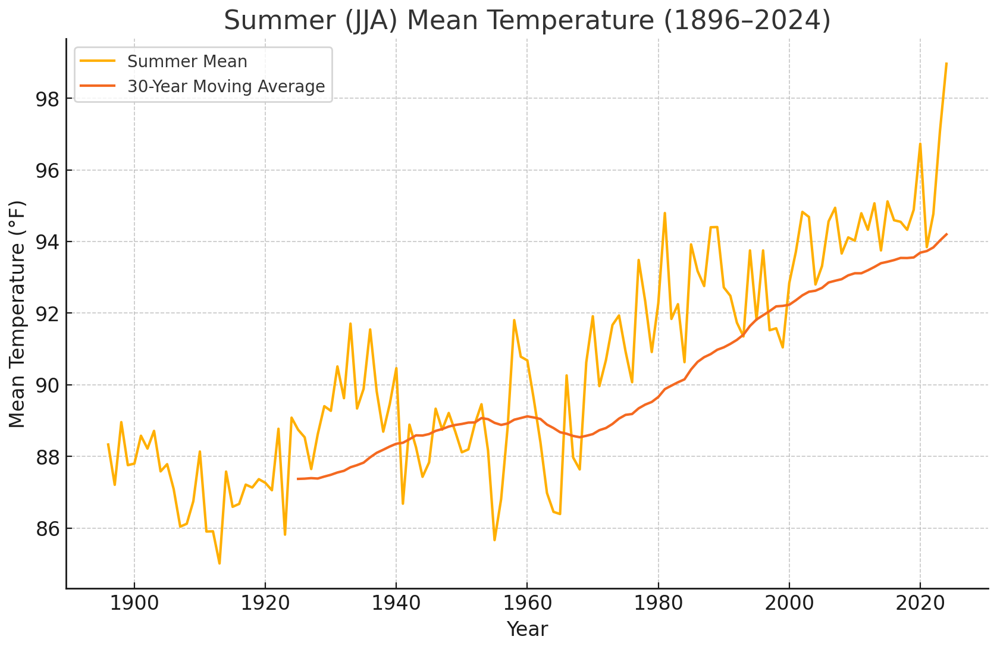
11 minutes ago, TheClimateChanger said:
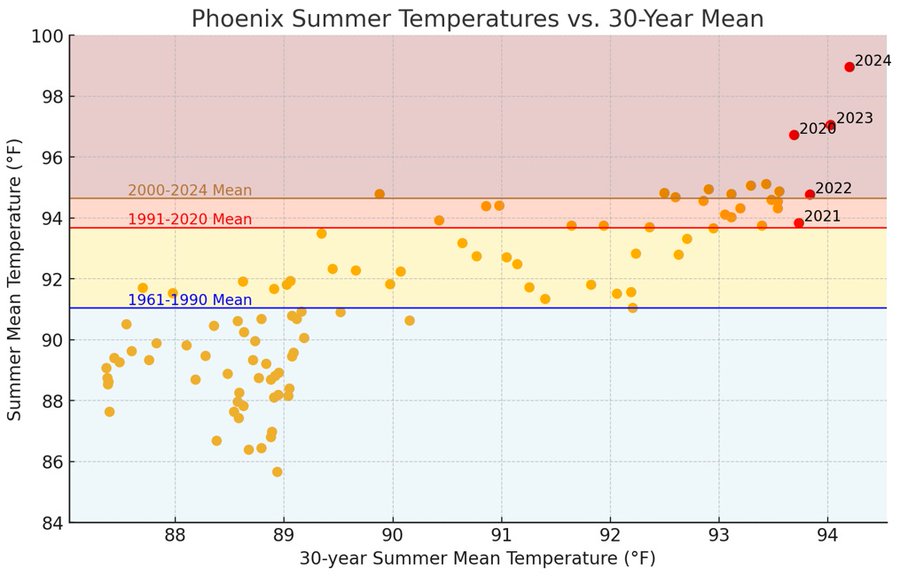
Interesting. @donsutherland1, do you find any evidence of a cyclical warming in the Phoenix data? Were the 1930s even hotter there, as seems to be insinuated here?
At best, there is a hint of an uncertain weak cyclical effect. However, changes in aerosols may well have driven most of the cooling seen in the 1960s. In any case, strong and persistent warming from UHI + anthropogenic climate change have overwhelmed any periodicity that might exist in Phoenix. The warmest summer during the 1930s was 1933 with a mean of 91.7° and the warmest year during the 1930s was 1934 with a mean of 74.2°. Every summer and every year since 2000 has exceeded those figures. The last cooler summer was 1999 and the last cooler year was 1998.
-
1
-
-
9 minutes ago, TheClimateChanger said:
Don, I would also question the replicability of Shewchuk's graph, especially in recent years. I see no evidence of recent years being adjusted upwards, so that weird pause since 1998 makes zero sense. There have been plenty of recent years that have far exceeded 1998 (2012, 2023, 2024, etc.). It is worth pointing out that the redundant, higher quality CRN network was established in 2005 and shows slightly more warming than nClimDiv during the period of overlap. There is no evidence to suggest that recent data is being adjusted upwards.
Looking at the rest of the graph, the magnitude of adjustments for TOBs and instrument changes looks to be of a reasonable magnitude. I know sometimes these graphics are manipulated by not factoring in gridding / proper areal averaging, which isn't an adjustment within the meaning of that term. Another common misrepresentation is to show only maximum temperature data. The MMTS bias adjustment is to lower older daytime maxima; however, the bias adjustment raises older minima. The net affect of these offsetting adjustments is negligable to Tavg trend. Here, it looks like Shewchuk uses Tavg, so I will say it doesn't appear to be as misleading as some of the stuff I have seen Heller and Martz publish.
He does cutoff the analysis at 1925, because prior to that date [back to 1895], adjustments are minimal and I think it would ruin the presentation he wants to give that the warming results only from adjustments. Also, as I said previously, the recent data definitely looks off. Doesn't seem to jive with actual observations. Without that weird sudden dropoff post-1998 in the so-called "raw" data, the trends since 1960 would be quite similar in both the so-called "raw" and "altered" data.
I'm not sure where he gets some of his data from. Yes, the USCRN data debunks his claims.
-
As of 2 pm, Islip (6 days) and JFK Airport (8 days) have had more 90° or above highs than Central Park (4 days). The only time that occurred during an entire year was 2006 (Islip: 10 days; JFK Airport: 12 days; Central Park: 8 days).
-
4
-
-
1 minute ago, LibertyBell said:
Phoenix has set some absolutely amazing records the last few years and not just for one or two days but for the entire summer, Don!
That’s true. With summers continuing to warm, there has been a sudden explosion of truly extreme summers. It’s too soon to draw too many conclusions about that, but in general extremes have increased in a non-linear fashion as the climate has warmed.
-
1
-
-
53 minutes ago, LibertyBell said:
Don what are the geographical differences that are causing these different results? I would expect more rainfall in the West because they have an ocean to the west of them (the jet stream goes west to east for the most part) and less rainfall in the East because we have an entire continent to the west of us.
Another thing worth noting about the 60s is that although they were dryer, they had a lot more snow than the decades surrounding them-- my ideal combo, lots of snow in the winter and dry and hot weather in the summer. 1960-61, 1963-64 and 1966-67 were all classic and even historic winters.
The climate models couple the ocean and atmosphere in forecasting circulation changes. To date, the trends in the Southwest (including part of California) and Northeast are consistent with what is expected from the circulation changes.
The 1960s were snowier, because the cold was so much greater than it has been recently. There was greater opportunity for precipitation to fall in the form of snow than there is today. During winters 1960-61 through 1969-70, the mean winter temperature was 32.6°, four winters had mean temperatures at or below 32°, with the warmest winter having a mean temperature of 35.9°.
During 2010-11 through 2024-25, the mean winter temperature was 37.1° (above the warmest winter of the 1960s), the coldest winter was 32.7° (above the mean figure for the 1960s), and four winters had mean temperatures of 40° or above. The rapid increase in warmth has more than offset the wetter climate. As a result, New York City's snowfall is likely in the early stages of a secular decline. By the mid-2030s, it will be clear whether snowfall has truly entered a long-term decline, even as there will still be snowier cycles and snowier winters. I suspect that the 30-season mean snowfall figure will reach or fall below 20.0" at Central Park by the mid-2030s.
-
1
-
-
33 minutes ago, ChescoWx said:
Imagine if we could actually see the actual real raw US average temperature trend?
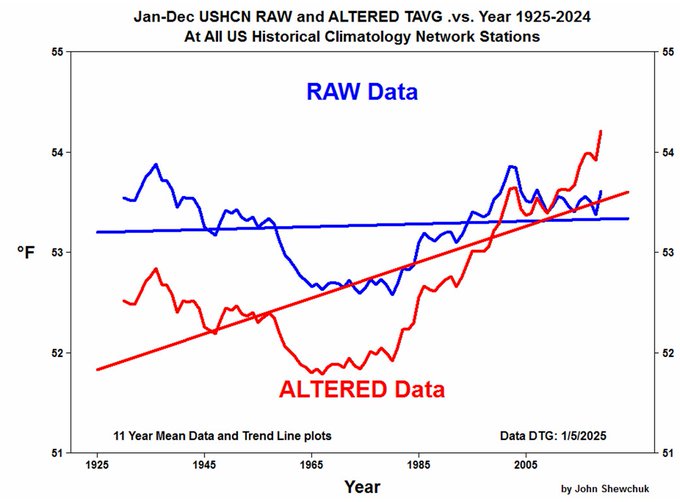
For purposes of illustration, below is an example of why Shewchuk's arguments are deeply flawed. The illustration examines the change in Phoenix's mean summer minimum temperatures.
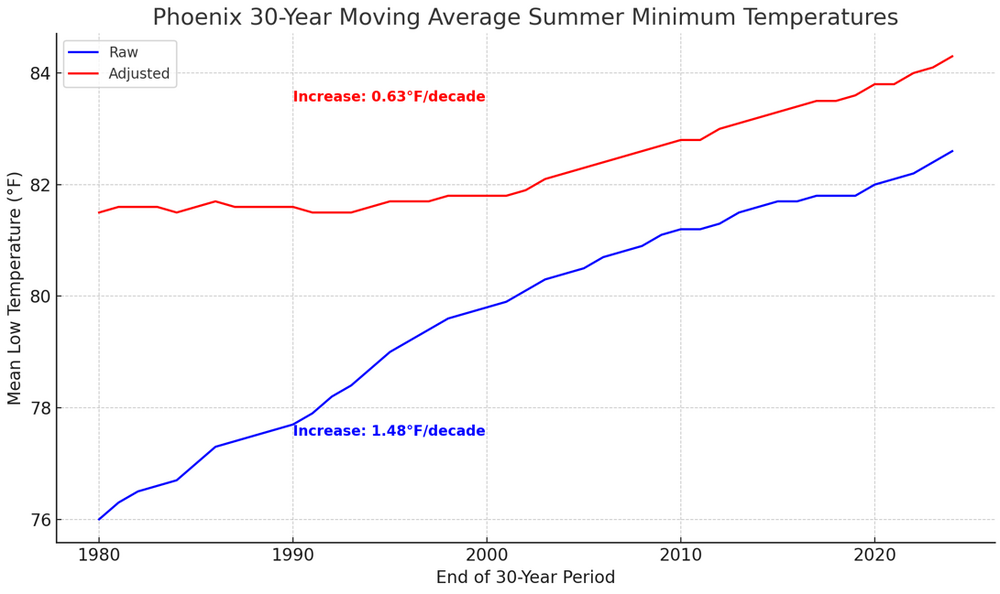
Shewchuk's dismissal of adjusted data would mean that Phoenix's climate has seen summer minimum temperatures increase almost 1.5° per decade due to climate change (natural and anthropogenic). His claims would ignore the impact that the emergence and then rapid growth of Phoenix's Urban Heat Island Effect has had on summer minimum temperatures. In 1941, the beginning of the first 30-year period under consideration, Phoenix had a population of just over 65,000. In 2024, Phoenix's population was 1,682,515. During 1940-1980, Phoenix's population grew an average of 6.4% per year; since 1980, it has been growing at about 1.8% per year. The sharper rise in the raw data during the first part of the chart and flattening afterward provide a footprint of the growth in the UHI.
If one were seeking to understand how fast Phoenix's climate has been warming, one would need to exclude artificial factors e.g., UHI. That's what the adjustments do. They remove the impacts of siting changes (location, features such as new buildings, etc.), UHI, time of observation bias, etc. The adjustments allow for comparability. They make robust scientific analysis possible.
-
1
-
-
18 hours ago, LibertyBell said:
It might have been more than just the 1960s though as it seems the 1940s, 1950s and 1970s were also quite dry, Chris. So what California has been experiencing over the past decade is what we experienced back then? That's what I mean by cycles, that has to flip at some point.
There are cycles and there are also longer-term trends. For example, New York City is seeing increasing precipitation (as expected from climate change). Its cycles continue and a drier cycle will commence at some point, but the overall trend is for greater annual precipitation.
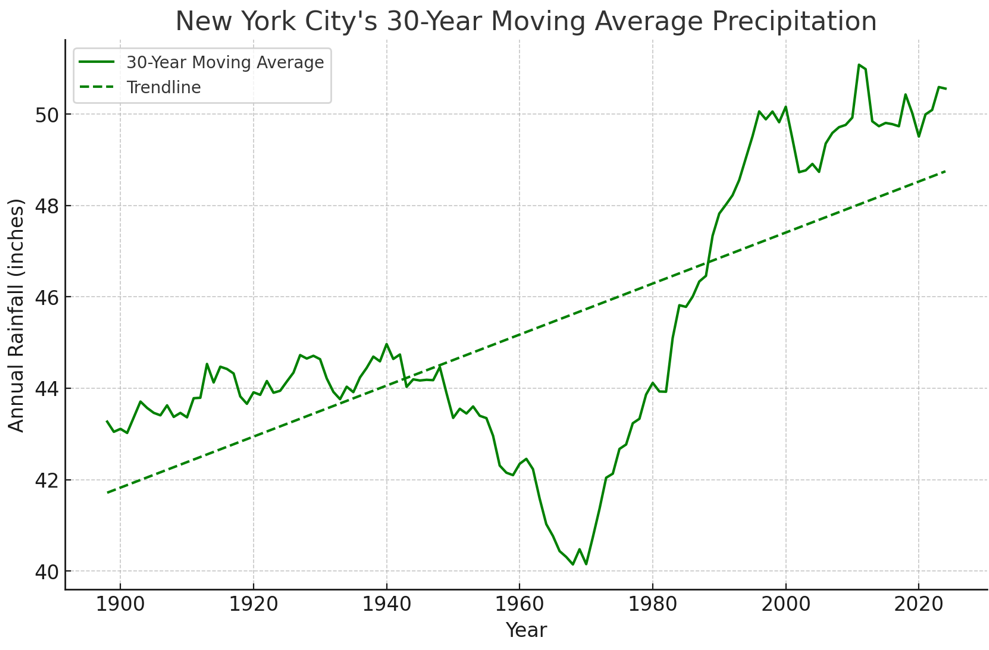
In contrast, parts of California and the Desert Southwest are in an aridification trend. There will be wetter cycles, but the overall trend is reduced precipitation.
-
1
-
1
-
-
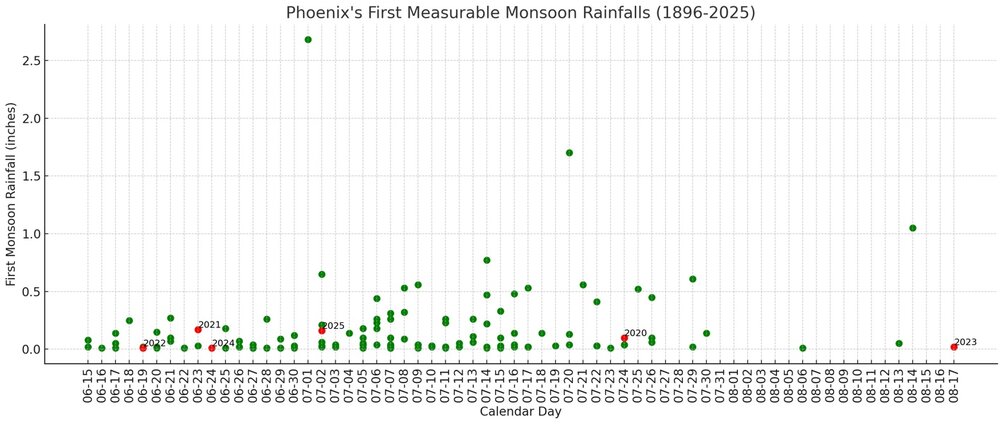
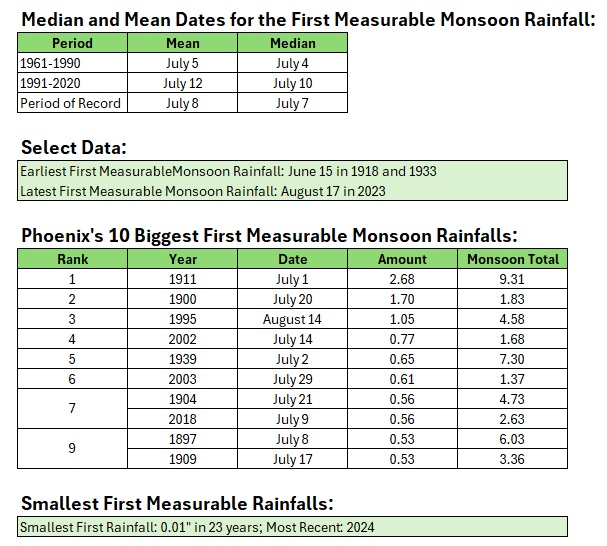
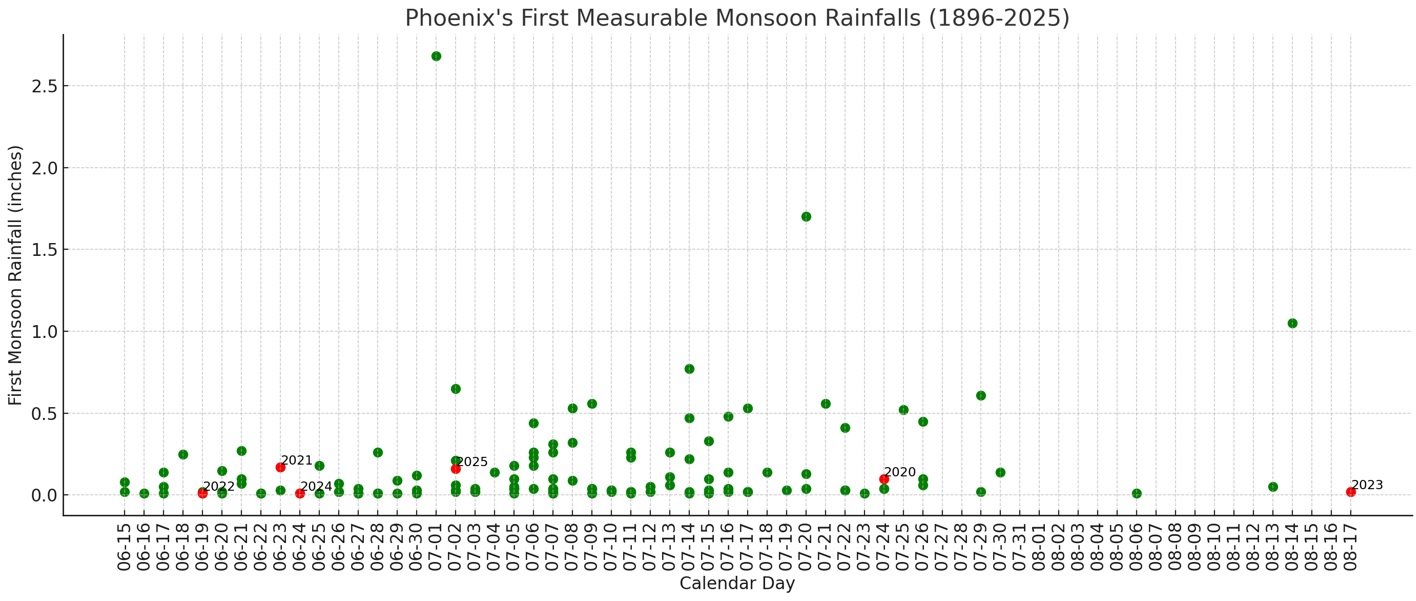
Yesterday, Phoenix saw its first measurable rainfall of Monsoon Season when 0.16” fell. It was the 35th biggest first measurable rainfall of Monsoon Season.
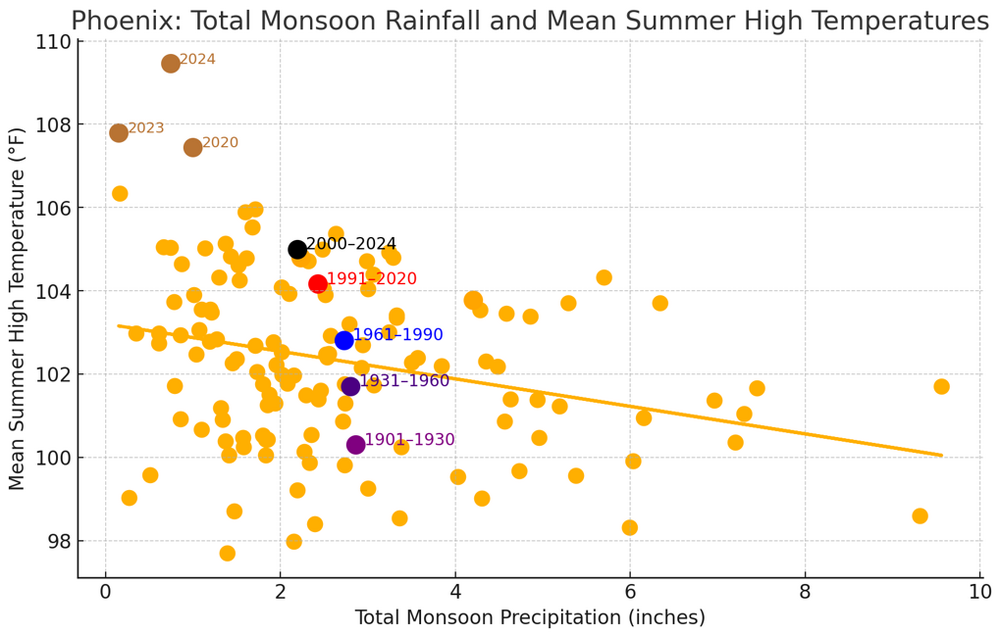
Finally, drier Monsoon seasons are often correlated with more intense heat. Phoenix has been evolving toward drier monsoon seasons and hotter summers.
-
Generally warm weather will prevail through Saturday. New York City will see highs in the middle to perhaps upper 80s during this stretch.
Parts of the region could experience some thunderstorms tomorrow afternoon or evening. After that, the next rainfall will likely occur during a frontal passage early next week.
Excessive heat does not appear likely to return through at least the first week of July. There remains some potential for a shot of more significant heat during the July 6-8 period. The worst of the heat, should it develop, will likely occur away from the coastal plain.
The ENSO Region 1+2 anomaly was +1.0°C and the Region 3.4 anomaly was 0.2°C for the week centered around June 18. For the past six weeks, the ENSO Region 1+2 anomaly has averaged +0.47°C and the ENSO Region 3.4 anomaly has averaged -0.03°C. Neutral ENSO conditions will likely continue through at least late summer.
The SOI was +7.32 today.
The preliminary Arctic Oscillation (AO) was +1.176 today.
-
1
-
-
July Mean Temperatures and Precipitation at Central Park:
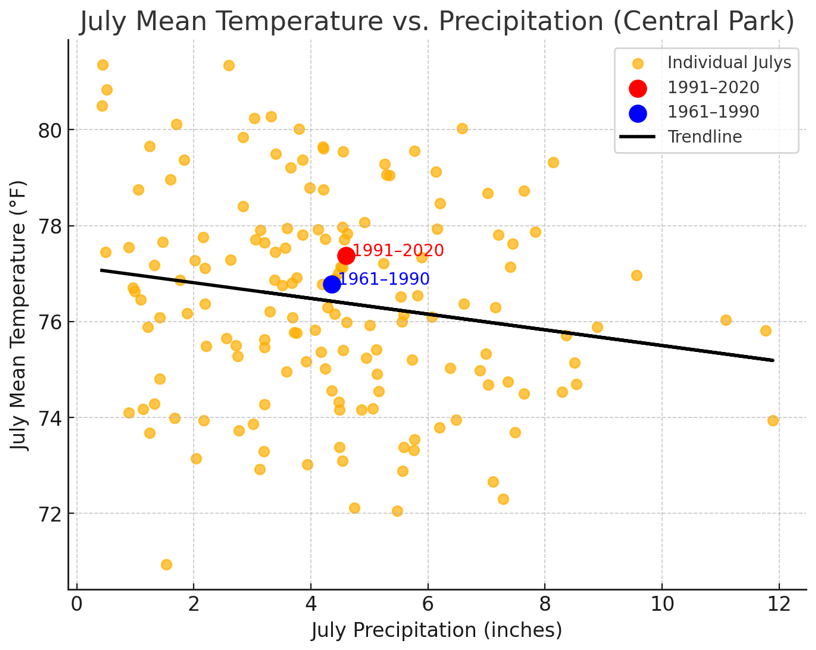
In general, drier outcomes are correlated with hotter outcomes. However, 1991-2020 has become both warmer and wetter than the 1961-1990 base period.
-
1
-
-
11 minutes ago, LibertyBell said:
And several more 90 degree days, JFK is out to a similar lead that they had in 2010. Do you think Central Park should have broken its all time 90 degree day record in 2010 just like JFK, LGA, and EWR did and perhaps even have had more 100 degree days, Don? It would be interesting to do a reanalysis of Central Park's data from 2010 to see if they should have broken the records they set in 1991 and 1993 of 39 90 degree days.
Yes. It should have easily beaten the record (46 +/- 5 days using the pre-2000 summer regression equation).
-
1
-
-
1 minute ago, LibertyBell said:
Yes, it's completely out of range compared to the other reporting stations. But the wetter climate might be shortening the length of heatwaves and also limiting the frequency of 100 degree temperatures (compared to how frequent 7 day heatwaves and 100 degree temperatures were during the 1990s for example.)
Yes, all things being equal, a wetter climate can temper heatwave intensity and duration.
-
1
-
-
Just now, LibertyBell said:
But what about these fronts stalling near the coast, something we really did not see at least in the month of July in summers like 1991, 1993, 1999, 2002, etc (basically the summers with the longest heatwaves since 1953.)
From what I remember of 1993 and 1999 and 2002 especially, the fronts always died out before they made it into our region (at least in July.) This enabled us to have extra long heatwaves without being interrupted with days of rain.
That's something the data can't really illustrate. But one would expect similar trends in the nearby locations as one is seeing at Central Park if synoptic developments were largely responsible. Instead, Central Park has been decoupling from the nearby locations when it comes to high temperatures. Indeed, absent the trees, Central Park would likely have had two 100° days so far, including a June record 102° high (pre-2000 regression equation).
-
1
-
-
1 minute ago, LibertyBell said:
also much rainier summers and shorter heatwaves, something which I outlined in an earlier post.
Wetter summers but not more frequent rainfall. But the decoupling between Central Park, JFK, LaGuardia, and Newark, which are experiencing similar rainfall trends suggests its Central Park's local environment that is playing the larger role in somewhat reduced high temperatures.
-
2
-
-
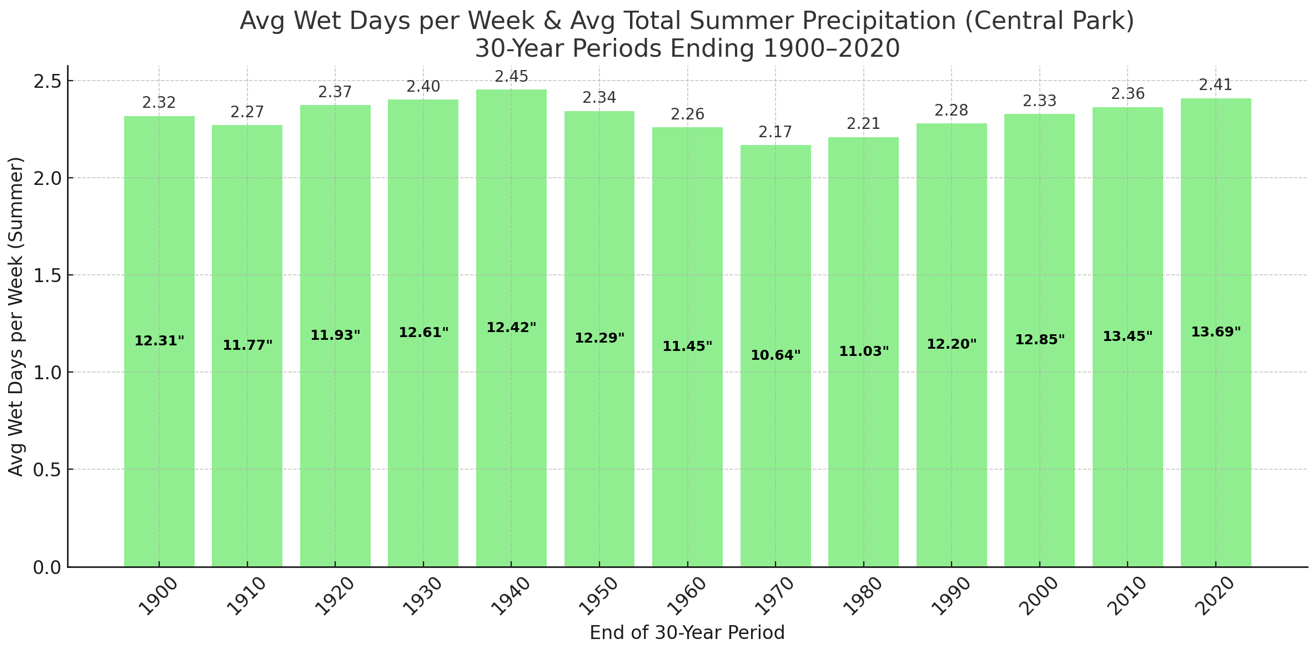
12 minutes ago, LibertyBell said:
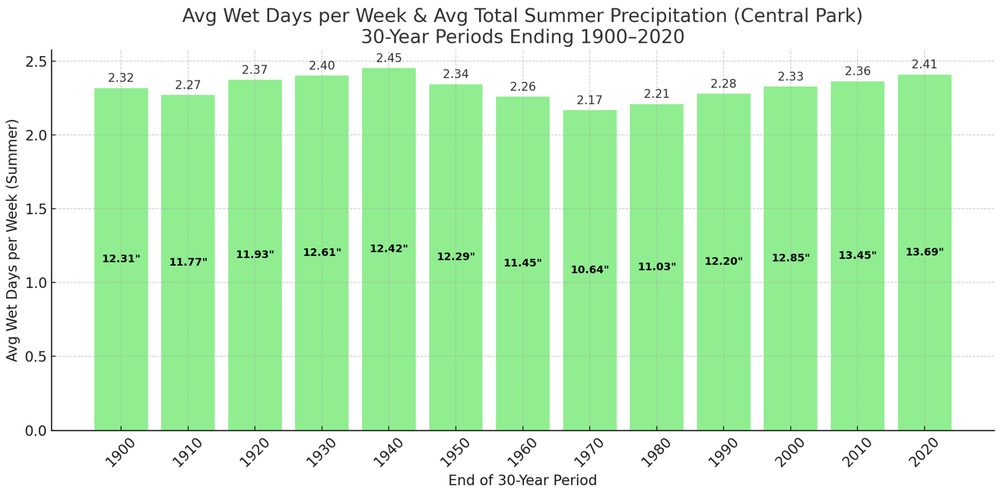
One other thing I have seen and maybe you can comment on Chris, is much rainier summers since 2002 leading to overgrowth of foliage. We aren't supposed to be this green in the summer, we're not in a tropical rain forest (or at least aren't supposed to be.)
Our climate was much drier in 1988, 1991, 1993, 1995, 1999, 2002. Our normal summer pattern is to have sunshine 6 out of every 7 days with a few hours of showers and thunderstorms one day every week. Now, we get stalled fronts and multiple days of rain (like yesterday and today). In our hotter summers, the Bermuda ridge is supposed to be strong enough to keep all fronts well to our west and north and very little rain in July. That's been my experience living here. What caused this to change that now fronts stall in our area-- as if we live in Florida? Our climate has become like the Gulf Coast, where they do get fronts but the fronts stall out and you get days of rain. It's okay to get 2 days of rain after a 100+ degree heatwave but we didn't have that over the weekend, we had a very modest heatwave and we still have to deal with a stalled front in July? Why? Growing up, this never happened here when we had a normal hot summer.
And because of this fake artificial rainier climate we are in now, our heatwaves have become MUCH shorter, note how long the heatwaves were in 1993, 1999 and 2002, we just do not get that anymore.
The average number of days with 0.01" or more rainfall per week during the summer hasn't really changed too much. The amount of rainfall has increased and was at its highest 30-year average for the 30-year period ending in 2020. If one goes beyond 2020, the most recent 30-year period (1995-2024) averaged 2.42 days per week with 0.01" or more rain during the summer and average total summer rainfall of 13.99".
-
1
-


July 2025 Discussion-OBS - seasonable summer variability
in New York City Metro
Posted
I agree. It is disappointing that the situation at Central Park has been neglected. The data no longer reliably reflects summer conditions in Manhattan. No matter how the data is examined, one sees an unmistakable impact during the summer or full foliage months.