Jns2183
-
Posts
5,861 -
Joined
-
Last visited
Content Type
Profiles
Blogs
Forums
American Weather
Media Demo
Store
Gallery
Everything posted by Jns2183
-
Central PA Summer 2026 Discussion/Obs Thread
Jns2183 replied to Voyager's topic in Upstate New York/Pennsylvania
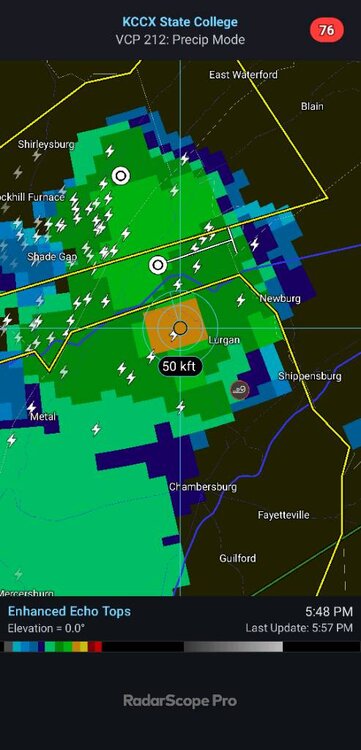
These storms have explosive growth. 50k+ tops are not exactly common here Sent from my SM-S731U using Tapatalk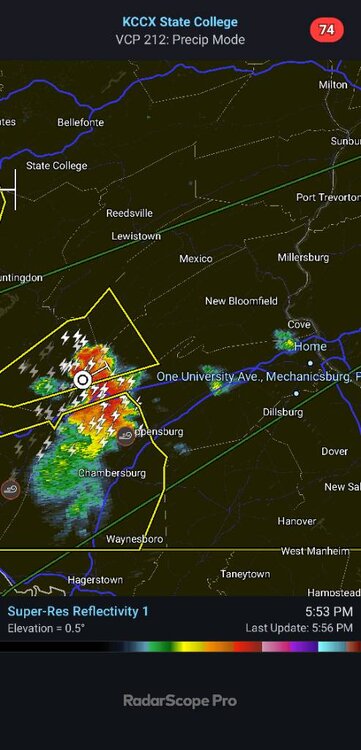
-
Central PA Summer 2026 Discussion/Obs Thread
Jns2183 replied to Voyager's topic in Upstate New York/Pennsylvania
I think that's heat index Sent from my SM-S731U using Tapatalk -
Central PA Summer 2026 Discussion/Obs Thread
Jns2183 replied to Voyager's topic in Upstate New York/Pennsylvania
2011, 1999, 1966 I believe those might be the only three possible ones Sent from my SM-S731U using Tapatalk -
Central PA Summer 2026 Discussion/Obs Thread
Jns2183 replied to Voyager's topic in Upstate New York/Pennsylvania
Where did you see 104 Sent from my SM-S731U using Tapatalk -
Central PA Summer 2026 Discussion/Obs Thread
Jns2183 replied to Voyager's topic in Upstate New York/Pennsylvania
I think we have the record in hand for hotest 4 day stretch in history going by daily mean. 1966 still tops our high temperature at a 102.55 4 day mean. Sent from my SM-S731U using Tapatalk -
Central PA Summer 2026 Discussion/Obs Thread
Jns2183 replied to Voyager's topic in Upstate New York/Pennsylvania
I know it would mostly go to runoff but a 3" rainfall would be just I need psychologically Sent from my SM-S731U using Tapatalk -
Central PA Summer 2026 Discussion/Obs Thread
Jns2183 replied to Voyager's topic in Upstate New York/Pennsylvania
It's 88 with dewpoint of 71 Sent from my SM-S731U using Tapatalk -
Central PA Summer 2026 Discussion/Obs Thread
Jns2183 replied to Voyager's topic in Upstate New York/Pennsylvania
Do we get some late night storms??? Seems like the night where there's plenty of energy for storms to feed Sent from my SM-S731U using Tapatalk -
Central PA Summer 2026 Discussion/Obs Thread
Jns2183 replied to Voyager's topic in Upstate New York/Pennsylvania
Everything I did for chester I've done for Schyukhill also, except at 800m grid . Over 3600 grid cells. By weekend end I should have a fun little expose on the wild and wacky climate up there Sent from my SM-S731U using Tapatalk -
Central PA Summer 2026 Discussion/Obs Thread
Jns2183 replied to Voyager's topic in Upstate New York/Pennsylvania
Hey, I pulled together the estimated PRISM grid coverage and climate data package for Chester County. PRISM is a gridded climate dataset from Oregon State University’s PRISM Climate Group. Instead of only using individual weather stations, PRISM takes station observations, terrain, elevation, coastal effects, and other geographic factors into account to estimate climate variables across a continuous grid. It is commonly used for precipitation, temperature, dew point, vapor pressure deficit, solar/climate analysis, drought work, agricultural analysis, hydrology, and local climate comparisons. For Chester County, I estimated the county intersects about 151 PRISM-style 4 km grid cells. Each 4 km grid cell is: 4,000 meters wide by 4,000 meters tall About 2.49 miles wide by 2.49 miles tall 16 square kilometers About 6.18 square miles The coordinate file I made gives the estimated centerpoint of each 4 km cell covering at least part of Chester County. The file is latitude, longitude format with no header row, so it should be easy to paste into mapping tools, GIS software, or scripts. The ZIP file size is about 58 MB. Unzipped, the data is about 208 MB. What is included in the data package: Daily PRISM files from 1981 through July 1, 2026 Monthly PRISM files from 1895 through May 2026 1991–2020 monthly normals 1991–2020 daily normals The daily files are the day-by-day weather/climate estimates for each Chester County grid cell. These are useful for looking at specific storms, heat waves, cold snaps, wet/dry stretches, day-to-day variability, growing season conditions, and longer-term local trends. The monthly files go much farther back, starting in 1895 and running through May 2026. These are better for long-term climate history because they cover more than 130 years. They are useful for comparing recent months to the historical record, ranking wet/dry months, looking at long-term warming trends, and comparing different decades. The 1991–2020 monthly normals are the modern 30-year baseline averages. These tell you what is “normal” for each month at each grid cell, using the current standard climate-normal period. The 1991–2020 daily normals are the day-of-year baseline values. These are useful when you want to compare a specific date, like July 1 or October 15, against what is normally expected for that time of year. The main variables included or represented are: ppt: precipitation tmin: minimum temperature tmean: mean temperature tmax: maximum temperature tdmean: mean dew point temperature vpdmin: minimum vapor pressure deficit vpdmax: maximum vapor pressure deficit Depending on the specific PRISM product set, solar-related variables may also be available: solclear: clear-sky solar radiation soltotal: total solar radiation on a horizontal surface solslope: solar radiation adjusted for slope/aspect soltrans: cloud transmittance The temperature variables are useful for heat, cold, frost, growing season, and general climate work. The precipitation variable is useful for rainfall/snow-water equivalent, storm totals, drought, wet spells, and long-term precipitation trends. Dew point is useful because it describes actual atmospheric moisture better than relative humidity alone. It helps show humid-air events, muggy periods, and moisture transport. Vapor pressure deficit, or VPD, is useful for plant stress, evaporation demand, drought stress, and agricultural or ecological analysis. Higher VPD generally means the atmosphere is pulling moisture more aggressively from plants and surfaces. There is also a finer 800 meter PRISM grid option. The relationship is simple: one 4 km cell can be divided into 25 smaller 800 m cells, because 4,000 meters divided by 800 meters is 5 cells across, and 5 by 5 equals 25. So one 4 km cell equals: 5 smaller 800 m cells across 5 smaller 800 m cells tall 25 total 800 m cells inside one 4 km cell Each 800 m grid cell is: 800 meters wide by 800 meters tall About 0.50 miles wide by 0.50 miles tall 0.64 square kilometers About 0.247 square miles For Chester County, the rough 800 m estimate is around 3,300 cells if counting cells that touch the county boundary. If you simply subdivided all 151 estimated 4 km cells into 25 smaller cells each, that would be 3,775 possible 800 m subcells, but the more realistic county-clipped estimate is closer to 3,300 because the county boundary cuts through edge cells. The 800 m version would give much more local detail, especially in areas where terrain, elevation, urbanization, valleys, or county-edge effects matter. It would also be much larger. Since 800 m resolution has 25 times as many grid cells as 4 km resolution, the same date range and variables could be up to roughly 25 times larger. As a rough estimate, if the 4 km package is 58 MB zipped and 208 MB unzipped, the equivalent 800 m package could be somewhere around: 1.45 GB zipped 5.2 GB unzipped That is only a rough scaling estimate, because compression varies by variable and file structure, but it gives the right ballpark. I started with the 4 km version because it is much smaller, easier to transfer, and still gives a good countywide climate picture. If you want the higher-detail 800 m version, I can pull/build that too. Link to 4km https://drive.google.com/file/d/1uD5Q3O_voxpLItJHbWMpdAkgKtBMc-k0/view?usp=drivesdk Sent from my SM-S731U using Tapatalk -
Central PA Summer 2026 Discussion/Obs Thread
Jns2183 replied to Voyager's topic in Upstate New York/Pennsylvania
Yes, the decision making here is something else. It's already too hot outside for me. Sent from my SM-S731U using Tapatalk -
Central PA Summer 2026 Discussion/Obs Thread
Jns2183 replied to Voyager's topic in Upstate New York/Pennsylvania
I'm amazed so many people went to this Sent from my SM-S731U using Tapatalk -
Central PA Summer 2026 Discussion/Obs Thread
Jns2183 replied to Voyager's topic in Upstate New York/Pennsylvania
Walking the dog and a bird fell dead out of tree almost hitting me Sent from my SM-S731U using Tapatalk -
Central PA Summer 2026 Discussion/Obs Thread
Jns2183 replied to Voyager's topic in Upstate New York/Pennsylvania
I pray it holds up today Sent from my SM-S731U using Tapatalk -
Central PA Summer 2026 Discussion/Obs Thread
Jns2183 replied to Voyager's topic in Upstate New York/Pennsylvania
Thank you. I repurposed an old Windows laptop to run Ubuntu server and WeeWx and have it plugged into a switch with my other server in my room into a coax adapter. My Ecowitt hub I have it customized to send data to WeeWx. I also send stuff to PWS weather because they give a free API account to xweather with 5000 calls a day. I had Claude built me a customized html interface for it and I now have a weekly automated pull via python for the closest 25 PWS, coap, asos stations that pulls 5 minute data for most over the past week so that I could use homogenization and A couple QC algorithms to check my sensors and adjust calibration levels. I've spent the last two weeks trying to figure out why and how my surface (5cm) has higher moisture than 25-30cm down Sent from my SM-S731U using Tapatalk -
Central PA Summer 2026 Discussion/Obs Thread
Jns2183 replied to Voyager's topic in Upstate New York/Pennsylvania
https://cpaweatherlab.com/ Here is my station data Sent from my SM-S731U using Tapatalk -
Central PA Summer 2026 Discussion/Obs Thread
Jns2183 replied to Voyager's topic in Upstate New York/Pennsylvania
They are decent quality, it all comes down to what you want from it. Ambient and Ecowitt have same manufacturer . Ive been very happy with Eccowitt because I've able to add a bunch of extra sensors for lightning, specialized tipping bucket rain gauge, soil sensors at multiple depths, air quality measurements for CO2 and 1, 2.5,4, 10 micrometer particles, and wet bulb thermometer as well as route everything for WeeWxa Sent from my SM-S731U using Tapatalk -
Central PA Summer 2026 Discussion/Obs Thread
Jns2183 replied to Voyager's topic in Upstate New York/Pennsylvania
Somerset County at around 2500' to 3100' feet is the place to be. 85 and 83 degrees respectfully yesterday at the flight 93 memorial and Mt Davis, which makes sense assuming 5.5 degrees per 1000 ft Sent from my SM-S731U using Tapatalk -
Central PA Summer 2026 Discussion/Obs Thread
Jns2183 replied to Voyager's topic in Upstate New York/Pennsylvania
99.4 was my max thank God dewpoint is only 69 Sent from my SM-S731U using Tapatalk -
Central PA Summer 2026 Discussion/Obs Thread
Jns2183 replied to Voyager's topic in Upstate New York/Pennsylvania
Haha, I spent far too much time and money playing around with temperature sensor locations and shielding all around my yard. It was a frustrating eye opening experience. Sent from my SM-S731U using Tapatalk -
Central PA Summer 2026 Discussion/Obs Thread
Jns2183 replied to Voyager's topic in Upstate New York/Pennsylvania
Any green grass left goes poof by monday Sent from my SM-S731U using Tapatalk -
Central PA Summer 2026 Discussion/Obs Thread
Jns2183 replied to Voyager's topic in Upstate New York/Pennsylvania
All I got to today was 91, dp 68, hi 95 Sent from my SM-S731U using Tapatalk -
Central PA Summer 2026 Discussion/Obs Thread
Jns2183 replied to Voyager's topic in Upstate New York/Pennsylvania
Every top heatwave aside 1953 in August hit this week Sent from my SM-S731U using Tapatalk -
Central PA Summer 2026 Discussion/Obs Thread
Jns2183 replied to Voyager's topic in Upstate New York/Pennsylvania
You have one of the most studied watersheds in America in your backyard relatively speaking. 1966. Produced some of the most cited and best done hydrology research in the world to this day. https://www.tucson.ars.ag.gov/icrw/Proceedings/Gburek.pdf They have minute by minute rainfall data since the 1960s!!! Only a handful of places in world have that Sent from my SM-S731U using Tapatalk -
Central PA Summer 2026 Discussion/Obs Thread
Jns2183 replied to Voyager's topic in Upstate New York/Pennsylvania
What I mean is the elevation is accounting for less than 10% of that difference. Everything else is due to what type of area it was placed it, canopy location, if it had good radiation shielding, if it used an aspirator, location of it to buildings, decks, house, rows. Realistically elevation is almost certainly less than 5% of the difference Sent from my SM-S731U using Tapatalk