Jns2183
-
Posts
5,838 -
Joined
-
Last visited
Content Type
Profiles
Blogs
Forums
American Weather
Media Demo
Store
Gallery
Everything posted by Jns2183
-
I'm already over heating It's going to be a long 6 months Sent from my SM-G970U1 using Tapatalk
-
The printing press was a mistake Sent from my SM-G970U1 using Tapatalk
-
0.05" of rain is not doing anything for this drought. Sent from my SM-G970U1 using Tapatalk
-
I saw snow flurries this afternoon. Watch this year be another May we see snow showers Sent from my SM-G970U1 using Tapatalk
-
Seattle has a hatched day for supercells with large hail Sent from my SM-G970U1 using Tapatalk
-
Red flags are up south of us Sent from my SM-G970U1 using Tapatalk
-
Elevated fire risk, yet again Sent from my SM-G970U1 using Tapatalk
-
Wind we have such an abundance of that we seem never short of going over the forecast Sent from my SM-G970U1 using Tapatalk
-
Is @Bubbler86 coming back anytime soon. I miss his analysis Sent from my SM-G970U1 using Tapatalk
-
It's become depressingly slow in here Sent from my SM-G970U1 using Tapatalk
-
South East winds return tomorrow Sent from my SM-G970U1 using Tapatalk
-
Which is exactly why nature will give us April snow Sent from my SM-G970U1 using Tapatalk
-
Until we get another june1998 with f3/f4 around seven springs south or a 5/31/85 outbreak with a long track f3/f4 going for 100 miles east but this time further south Sent from my SM-G970U1 using Tapatalk
-
1.84" here. That type of system in late May or June would bring a whole lot of hurt here Sent from my SM-G970U1 using Tapatalk
-
Back building has been phenomenal. 1.78" and still raining Sent from my SM-G970U1 using Tapatalk
-
Over 1.50". This ended up being a big win against drought Sent from my SM-G970U1 using Tapatalk
-
This is beautiful Sent from my SM-G970U1 using Tapatalk
-
This seems like the kind of slow moving front that would drop widespread 4"+ if this were June. Sent from my SM-G970U1 using Tapatalk
-
I wish we had this the next 8 hours. Perfect sleeping thunder and rain Sent from my SM-G970U1 using Tapatalk
-
I'm now hoping we can at least clear 1" of rain. 2" would be a dream Sent from my SM-G970U1 using Tapatalk
-
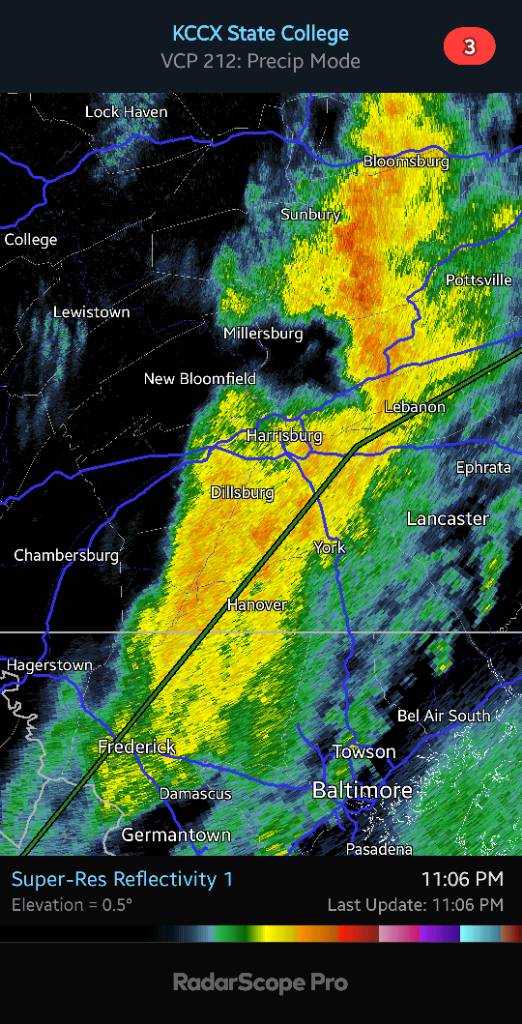
Still a lot of stations reporting dew points in the 60s in Cumberland and York counties. Winds have calmed Sent from my SM-G970U1 using Tapatalk
-
If we do get decent storms it's all because of that hour of partly sunny conditions heating the BL some. That might also be why your dew point dropped some. We might have had a little inversion trapping some moisture near surface and the sun and winds were able to mix out some Sent from my SM-G970U1 using Tapatalk
-
The southern portion of the line has significantly more n-s motion, less w-e motion compared to the northern portion. Lightning looks to be increasing as it comes out of the mountains some and into areas that had some sun recently. I see showers popping up in front maybe on outflow boundary? Id usually worry at this point about storms blowing up to my east, robbing main line of energy and effectively jumping over me, but east is much more stable. Sent from my SM-G970U1 using Tapatalk
-
The issue I see is the total lack of lightning south of state college currently. This may just be some windy rain Sent from my SM-G970U1 using Tapatalk
-
Temp up to 69. Dew point 61 Sent from my SM-G970U1 using Tapatalk