Jns2183
-
Posts
5,674 -
Joined
-
Last visited
Content Type
Profiles
Blogs
Forums
American Weather
Media Demo
Store
Gallery
Everything posted by Jns2183
-
Central PA Winter 25/26 Discussion and Obs
Jns2183 replied to MAG5035's topic in Upstate New York/Pennsylvania
I've been building myself a little personal weather history database. I have for KMDT and KCXY every hourly reading for in the NCEI database. They have missing hours, obviously as you go back in time, but combined I pretty much have at least a temperature reading hourly going back to the 1930's. I also have complete daily records for York and Lancaster and a lot of co-op that have come and went over the years. There really wasn't explosion of them around World war II. Soon as I decide about storage and server setup I'm going to see about attaining all 5 minute asos automated sensor readings. But at that point it's GB of data and doesn't really move the needle too much on what I'm doing. I was also starting to look more into soil temperature records and hydro automatic creek sensors for nailing down preceiptitation which is a big interest. Sent from my SM-S731U using Tapatalk -
Central PA Winter 25/26 Discussion and Obs
Jns2183 replied to MAG5035's topic in Upstate New York/Pennsylvania
What was your question? The reason the odds were so high there wasn't because it snowed a 100". It was because it did so essentially back to back years. You essentially have two 99th percentile winters happening in a rough. I accounted for the "stickyness" of winters through autocorrelation Sent from my SM-S731U using Tapatalk -
Central PA Winter 25/26 Discussion and Obs
Jns2183 replied to MAG5035's topic in Upstate New York/Pennsylvania
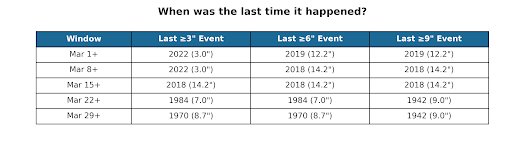
I agree with you in that I think there will be opportunities here. I'm just trying to set expectations in a proper manner. Realistically here are the return periods for different snow levels along with the last qualifying event. I would be hesitant to believe any storm snow maps going forward that paint more then 6" unless we get situated and a historically cold air mass, -25+ departure from normal, or we have a bomb perfectly of ocean city. I love l looking at some of the true late March / Easter bombs from before the satellite era. It's tough finding hourly data at times but I remember one from I think early 1940"s where it was snowing from DC to Harrisburg to Philly while raining in North Central to north east pa. It was 31-32 in dc while pushing 40 in Williamsport and Allentown. Pure dynamics driven as the low bombed out and retrograded. The ccb eventually made it to Allentown. The undisputed king of these storms is the 4 day March 18-21, 1958 storm where the low bombed out and was cut off. Snow was super elevation dependent and dynamic dependent. Philadelphia received 11.4" spread out over 4 days. Harrisburg was 1958-03-18: 0.0" 1958-03-19: 4.0" 1958-03-20: 4.7" 1958-03-21: 0.2" Total (Mar 18–21): 8.9" Morgantown, Pennsylvania 50". I'm sure some of the high spots down in Adams and York counties did absolutely amazing. Sent from my SM-S731U using Tapatalk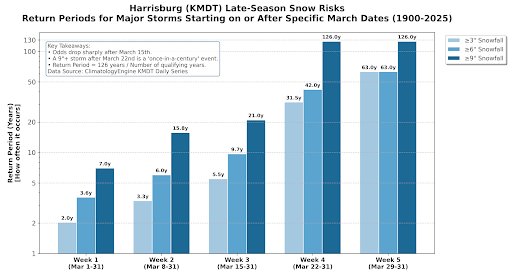
-
Central PA Winter 25/26 Discussion and Obs
Jns2183 replied to MAG5035's topic in Upstate New York/Pennsylvania
The historical Max and anomaly is March 1960. Maybe the month I dream about experiencing the most. In March 1960, the Northeast saw a relentless pattern that produced 7 distinct measurable snow events for the Harrisburg (MDT) area, totaling that record-setting cumulative amount. It wasn't just one "Superstorm"; it was a "parade" of systems that kept the ground white for nearly the entire month. Here is how that active March unfolded for Harrisburg: March 1960 Storm Timeline (Harrisburg/MDT) | Date | Snowfall Amount | Notes | |---|---|---| | March 3 | 10.5" | The primary "anchor" storm of the month. | | March 10 | 1.8" | A cold-sector clipper system. | | March 16 | 3.2" | Moderate overrunning event. | | March 17 | 3.0" | St. Patrick's Day system. | | March 22 | 2.0" | Late-season coastal influence. | | Minor Events | 2.1" | Combined totals from minor dustings (March 4, 7, 8, 21, 24). | | Total | 22.6" | (Catalog sum for distinct events) | Prior to this month that winter had produced 27" of snow, similar to us now. But March was notice to all the new decade was a different beast Sent from my SM-S731U using Tapatalk -
Central PA Winter 25/26 Discussion and Obs
Jns2183 replied to MAG5035's topic in Upstate New York/Pennsylvania
The Regime Transition Probability Map is a visualization of a Markov Chain transition matrix, designed to quantify the likelihood of shifts between specific atmospheric states. It represents a century of regional snowfall data processed through a K-Means clustering algorithm. Statistical Mechanics of the Map * Axes: The vertical axis (Current Cluster) defines the point of origin, representing the weather regime of the most recent event. The horizontal axis (Next Cluster) represents the predicted destination for the subsequent atmospheric event. * Probability Density: The numerical values and corresponding blue shading represent the probability (0.0 to 1.0) of a transition occurring between any two clusters. A value closer to 1.0 (darker blue) indicates a high statistical probability, while a value closer to 0.0 (lighter blue) suggests a rare or unlikely transition. Current Regime Analysis: Transition from Cluster 3 Following the high-intensity coastal event on February 23, the atmospheric state is currently positioned in Cluster 3 (Extreme Synoptic). Analyzing the Row 3 data provides the following probabilistic insights: * Pattern Persistence (3 to 3): The probability located at the intersection of Row 3 and Column 3 quantifies the likelihood of the atmosphere remaining in a high-intensity coastal redevelopment cycle. * Regime Decay (3 to 2): Historically, late-February Cluster 3 events exhibit a strong statistical trend toward Cluster 2 (Clipper / Fast-Moving). This represents a transition from high-payload moisture systems to lower-accumulation, high-ratio arctic systems. * Inland Transition (3 to 1): The probability of shifting to Cluster 1 (Miller B / Overrunning) indicates the likelihood of the next system following an inland track rather than the coastal track observed yesterday. Probabilistic Representation The map demonstrates that weather patterns are not random but operate within a set of statistically favored transitions. For a Cluster 3 point of origin, the high concentration of probability in the Cluster 2 column suggests a regime shift toward diminished regional totals. This indicates that while extreme events like the one yesterday are significant, they are statistically followed by a period of lower intensity as the seasonal atmospheric steering flow begins its spring transition. Sent from my SM-S731U using Tapatalk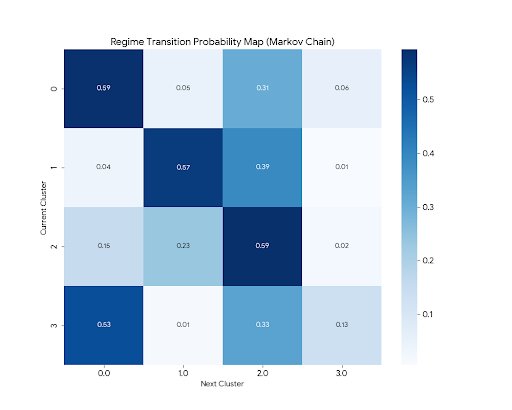
-
Central PA Winter 25/26 Discussion and Obs
Jns2183 replied to MAG5035's topic in Upstate New York/Pennsylvania
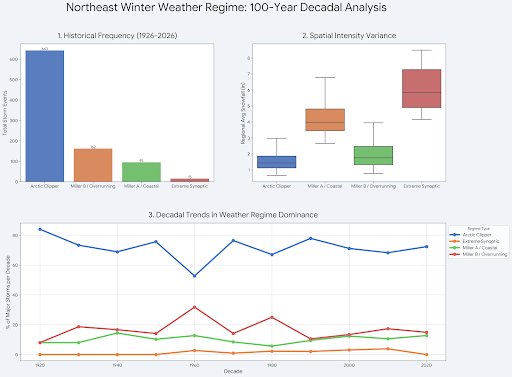
If anyone wants it I have daily snowfall, snow depth, max temperature, min temperature. data so far for 1/1/1925 to 12/31/2025 from about 35 stations across Virginia, Maryland, Delaware, Pennsylvania, New Jersey, New York, Connecticut, Rhode Island, Massachusetts. I was able to use Google Colab and python script to combine it all in csv. It's big for a csv, over a 100mb. I converted it into a paraquat file to use more easily in python and that's just over 9mb. Regime 0 (Steady Coastal - Miller A): Features three sub-regimes. Variant 0.1 is the outlier here, representing high-moisture coastal systems that dump significantly more than the baseline. Regime 1 (Miller B / Overrunning): Highly frequent but generally lower in average intensity. Variant 1.2 is the heavy-hitter for this category, often associated with redeveloping systems that "capture" deep moisture. Regime 2 (Clipper / Fast-Moving): This is your most frequent baseline. Variant 2.0 represents the "peak" clipper—fast, cold, and efficient, occurring nearly 500 times in the century. Regime 3 (Extreme Synoptic): The "Big One" category. Even its "weakest" variant (3.0) averages nearly 3 inches of snow, while the primary peak (3.1) averages 4 inches across the entire regional station network. The graphic also includes the Event Counts for each sub-cluster, allowing you to see which atmospheric setups are common versus which are rare historical anomalies. Sent from my SM-S731U using Tapatalk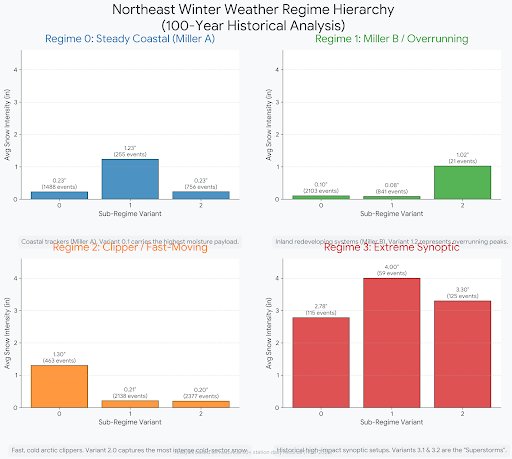
.thumb.jpg.1236cfa62f159471d7d85f175087788f.jpg)
-
Central PA Winter 25/26 Discussion and Obs
Jns2183 replied to MAG5035's topic in Upstate New York/Pennsylvania
The median snow for Harrisburg after a February storm like the one the other day this late in February here is the past outcomes 25th 0.48 Median 2.66" 75th 6.28" So likely all we get rest of season is a 1"-3"/3"-6" She's just about done. Sent from my SM-S731U using Tapatalk -
Central PA Winter 25/26 Discussion and Obs
Jns2183 replied to MAG5035's topic in Upstate New York/Pennsylvania
We unfortunately just had a triple phaser with the Halloween snow awhile back. I doubt we get another one for another 20-30 years. Sent from my SM-S731U using Tapatalk -
Central PA Winter 25/26 Discussion and Obs
Jns2183 replied to MAG5035's topic in Upstate New York/Pennsylvania
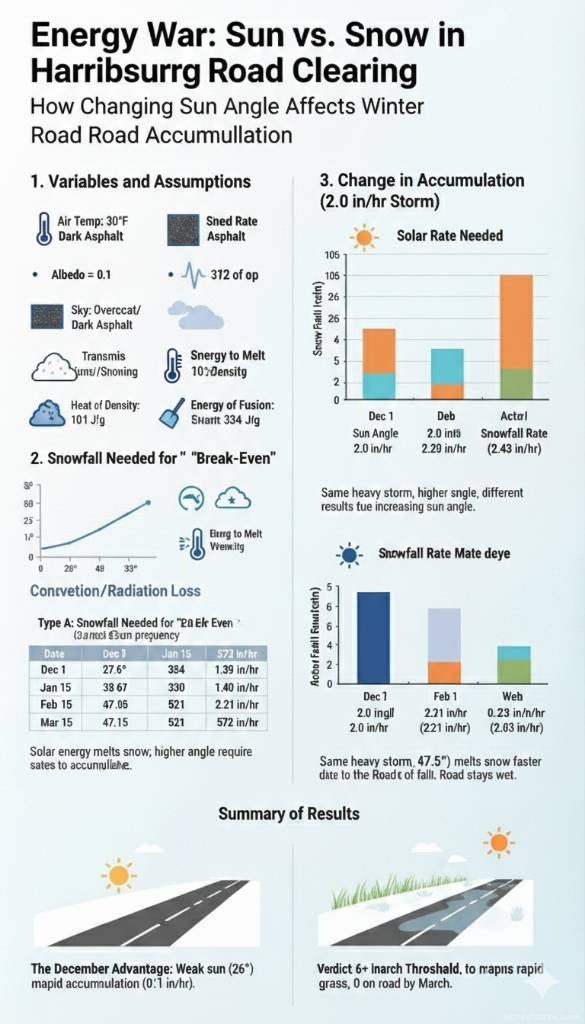
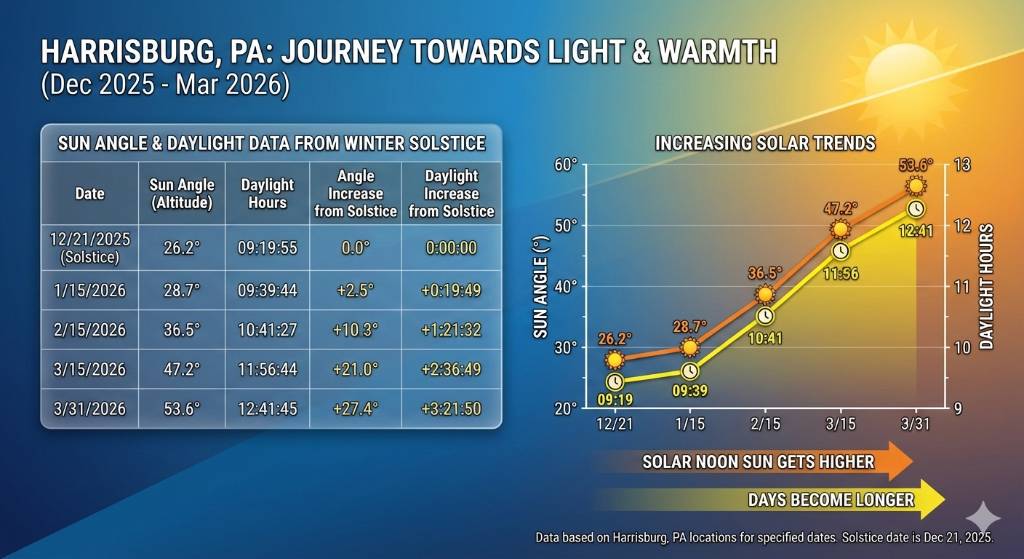
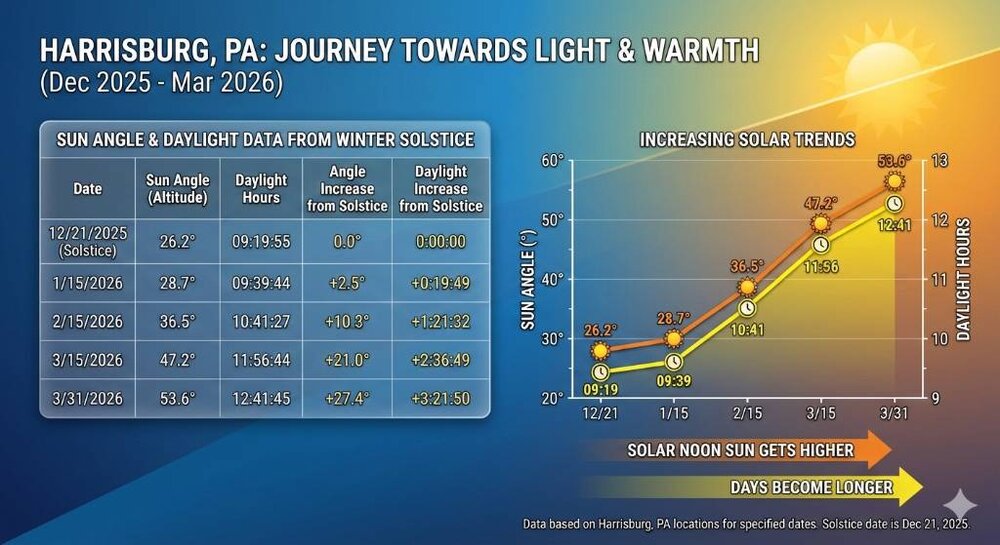
A post about increasing sun angle and how it affects rates needed to accumulate on asphalt. It truly brings home the point that the 1993 storm was in its own league beyond even what we informed people think. It needed to overcome 2.3x more solar radiation than mid January and 1.5x more than mid February. Sent from my SM-S731U using Tapatalk
-
Central PA Winter 25/26 Discussion and Obs
Jns2183 replied to MAG5035's topic in Upstate New York/Pennsylvania
March 15 is the cliff Sent from my SM-S731U using Tapatalk -
Central PA Winter 25/26 Discussion and Obs
Jns2183 replied to MAG5035's topic in Upstate New York/Pennsylvania
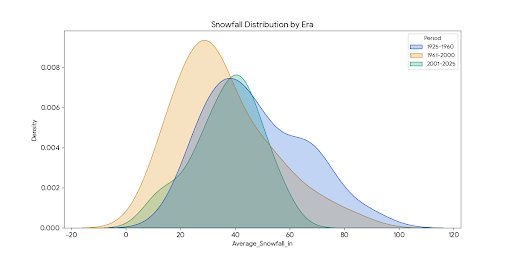
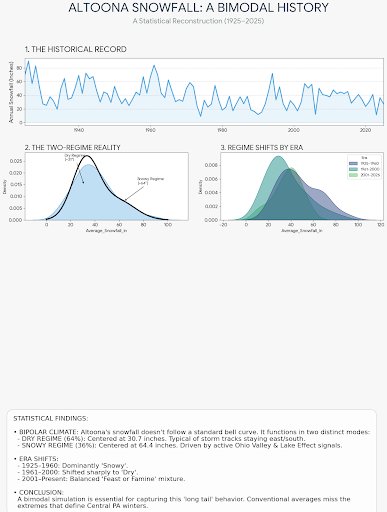
The next project I started working on gathering daily weather data for about 20-30 locations throughout the mid Atlantic and northeast that have a 100 year history or more to attempt to brake down the sub types of miller a and miller b and answer tough questions like "if a storm hits like yesterday, how does that effect the odds of our winter going forward?". I'm sure it has a giant temporal component but we shall see. Below are percentage chance of storms occuring by day in March and a decade regime change in snowfall distributions for the fragmented Altoona area Sent from my SM-S731U using Tapatalk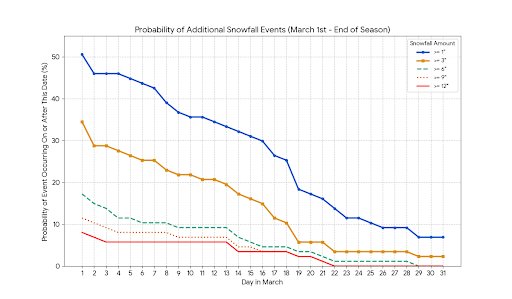
-
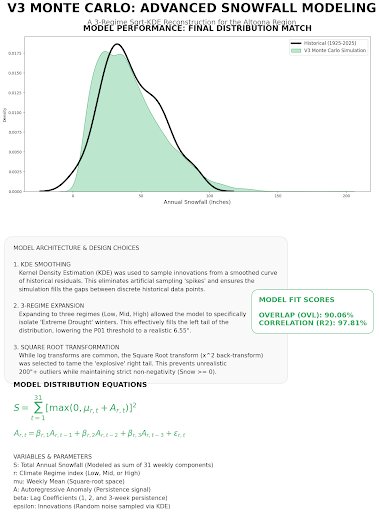
Central PA Winter 25/26 Discussion and Obs
Jns2183 replied to MAG5035's topic in Upstate New York/Pennsylvania
I bit the bullet and downloaded state colleges record daily weather going back to 1894 and built a model to run 100,000 simulations. Got it to pass all over fitting tests, have a 99% percentile correlation, 94% interweek variability correlation, 98% intra- seasonal correlation based on auto-lag correlations. To have repeat of winter 1992-1993 and 1993-1994 back to back order not important it is a 1:1666 year event. To repeat the first four years of the 1960s 1:768 year event. Sent from my SM-S731U using Tapatalk -
Central PA Winter 25/26 Discussion and Obs
Jns2183 replied to MAG5035's topic in Upstate New York/Pennsylvania
Also does anyone here have any idea of who I contact to pay to get archive of all the past Central Pennsylvania threads Sent from my SM-S731U using Tapatalk -
Central PA Winter 25/26 Discussion and Obs
Jns2183 replied to MAG5035's topic in Upstate New York/Pennsylvania
That bright blue flash was a transformer that knocked power out to a lot of Camp hill. That caused them to have to cancel school today instead of two hour delay. Sent from my SM-S731U using Tapatalk -
Central PA Winter 25/26 Discussion and Obs
Jns2183 replied to MAG5035's topic in Upstate New York/Pennsylvania
Watching that band gave me flashbacks to 2016. I also think it's worth noting how that south Central pa was the jackpot in that historical storm. Even accounting for "climate loading"—the observed increase in high-intensity precipitation events due to a warmer, more moisture-rich atmosphere the return period for 30" 82 years 33" 145 years 36" 260 years People here recorded those values during that storm with kmdt having 30.1" That's a once in 3,6,10 generation type event and was only 10 years ago. Sent from my SM-S731U using Tapatalk -
Central PA Winter 25/26 Discussion and Obs
Jns2183 replied to MAG5035's topic in Upstate New York/Pennsylvania
You hit the nail on the head regarding the "democratization" of weather data. We’ve reached a point where access to data has outpaced the literacy required to interpret it. When someone hands you a printout of a single model run, they aren't looking at a forecast; they're looking at one possible mathematical solution out of thousands, and usually the most extreme one. It’s the Meteorological Dunning-Kruger Effect: they know just enough to find the map, but not enough to know why that map is hot garbage four days out. Sent from my SM-S731U using Tapatalk -
Central PA Winter 25/26 Discussion and Obs
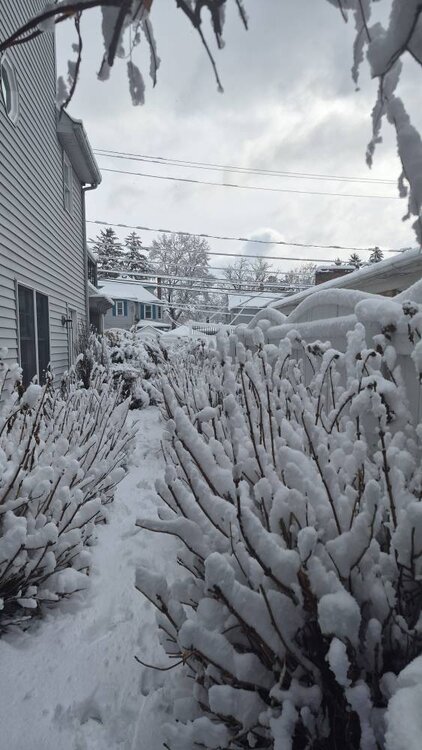
Jns2183 replied to MAG5035's topic in Upstate New York/Pennsylvania
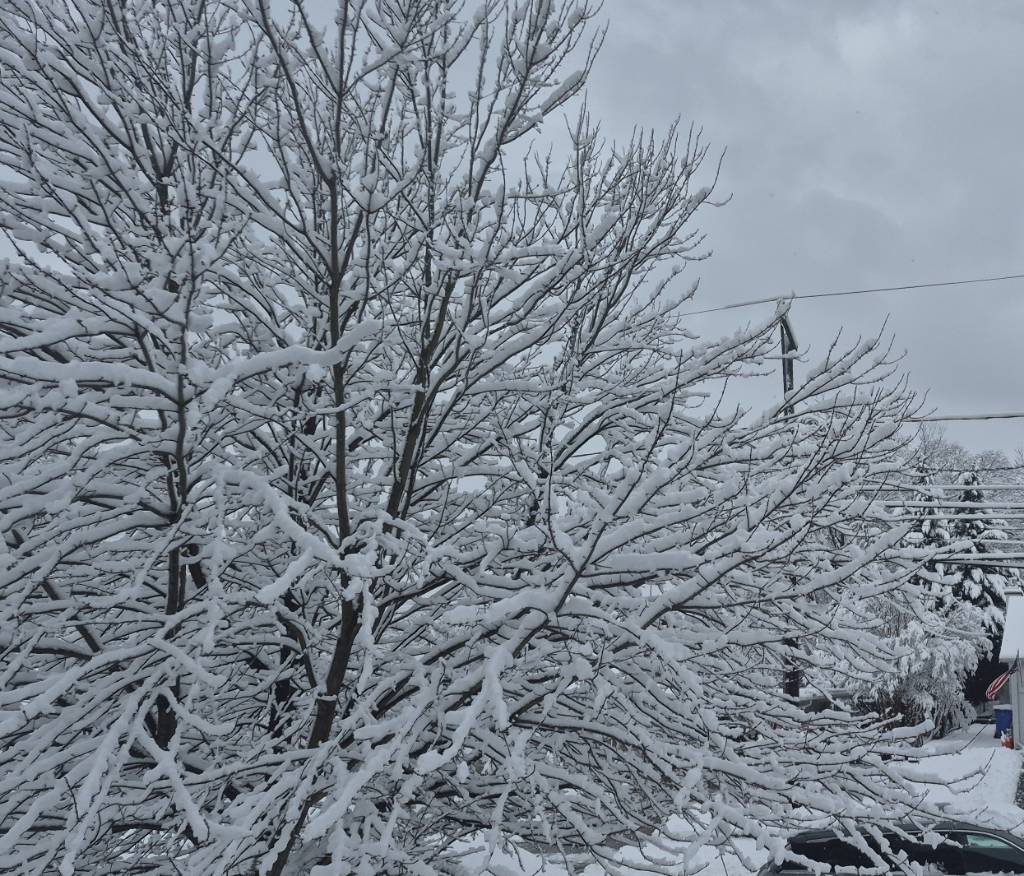
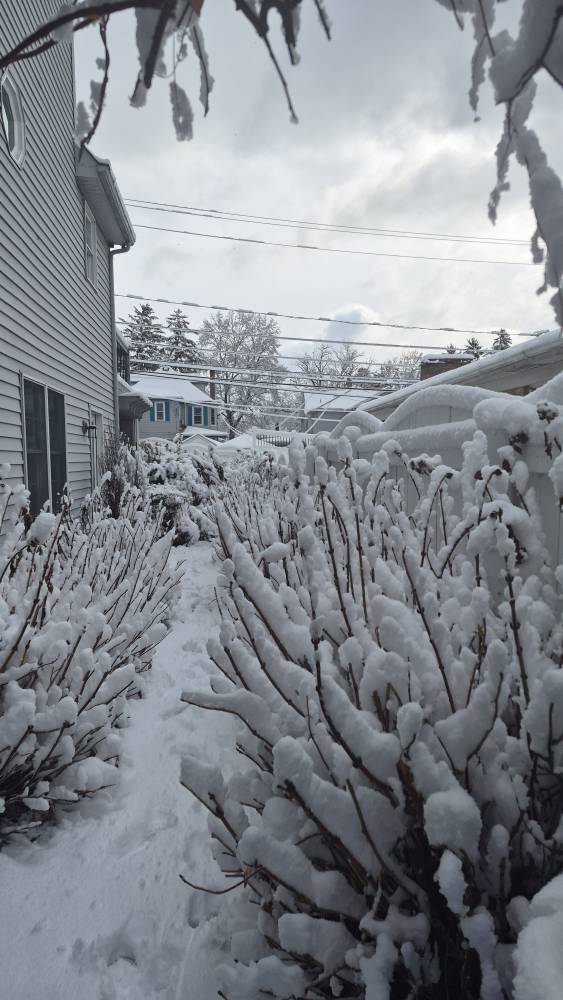
Actually ended up hitting just over 5". My daughter's school who confidently went with a two hour delay last night woke me up early with a message that they meant a two hour delay to the "flexible instructional day", they just forget to add "flexible instructional day" to the message last night. It's absolutely beautiful outside. Still not much wind which is probably a very good thing with how caked. Sent from my SM-S731U using Tapatalk
-
Central PA Winter 25/26 Discussion and Obs
Jns2183 replied to MAG5035's topic in Upstate New York/Pennsylvania
I'm in Camp Hill. Not far at all. We got very lucky. That one nice band width was basically only from Mechanicsburg to city island. Sent from my SM-S731U using Tapatalk -
Central PA Winter 25/26 Discussion and Obs
Jns2183 replied to MAG5035's topic in Upstate New York/Pennsylvania
Regardless snow will be gone by Tuesday probably. Certainly Wednesday. It gets to 50 by Saturday and Sunday. With next chance of snow Monday March 2nd. Realistically we have the next 21 days to add to total before we reach the point where a 6" snowfall is a 1 in 20 year event. All told when looking at the statistics over the years and studies one is left with the hard truth that despite all data and computer power, over 80% of variance in yearly snow in the mid Atlantic and northeast is due to essentially luck, and it took an ungodly amount of data and computer power to even get it down to 80% since it's basically an exponential function. One can at least measure this luck. And over the past 5 years we have been as unlikely as we were lucky during the 2010's. The 1940s hold the title still for unluckiness but we are easily in line to beat them unless we spit out a couple 50" plus seasons out of the next 3 years. But just like other runs of luck and bad luck it won't last forever. Within the next 10 years we will almost certainly have a 60" plus season again which I will truly savor. Sent from my SM-S731U using Tapatalk -
Central PA Winter 25/26 Discussion and Obs
Jns2183 replied to MAG5035's topic in Upstate New York/Pennsylvania
I'm went over 4" close to midnight. Light to moderate snow here still. My prediction was 4". Maybe I can squeeze out a bit more. I'm guess I'll end up with 5"-6". Which the euro had been spitting out here for a number of days. Still not a lick of wind. That is surprising Sent from my SM-S731U using Tapatalk -
Central PA Winter 25/26 Discussion and Obs
Jns2183 replied to MAG5035's topic in Upstate New York/Pennsylvania
Now now, his time will come. I implore you to dust off your records on the fabled 2010 winter. Look at those gradients, last second model moves, and unlikely target zone. I remember joking around in the message boards with everyone that the local Mets had achieved a feat I thought impossible. For each of the 3 big storms that year (December and 2 in February) they ended up being off by nearly factor of 2 in their predictions at the time first flakes fell. Basically they kept calling for 6-10" and we ended up with 15"-20". How do you think he would have handled those? Every forecaster has bias, hell it's even good he knows what he is. I just can't get over the mental frame he has of trying working hard to increase his bias. Every bit of success he seems to embrace his bias publicly a bit more each day, like a gambler on a winning streak trying to talk shit to the dealer. Sent from my SM-S731U using Tapatalk -
Central PA Winter 25/26 Discussion and Obs
Jns2183 replied to MAG5035's topic in Upstate New York/Pennsylvania
I literally just saw two supped up kias try to race each on 11/15 north starting at the light at market street. Reffing the engines waiting for red light to turn green, take off flooring it and about 1.5 seconds later both lose control spinning into each, fiberglass kits shattering. Looks like they both lost side view mirror, parts of their bumper, a tail fan. Both got the hell out of there onto a side street pretty quickly. The ones muffler was dragging throwing off sparks. That truly was the single stupidest thing I've seen in life. Literal on the same level as the guy who jumped in the ocean offg the booze party boat at night in thet Caribbean with numerous large sharks following Sent from my SM-S731U using Tapatalk -
Central PA Winter 25/26 Discussion and Obs
Jns2183 replied to MAG5035's topic in Upstate New York/Pennsylvania
It is nice Sent from my SM-S731U using Tapatalk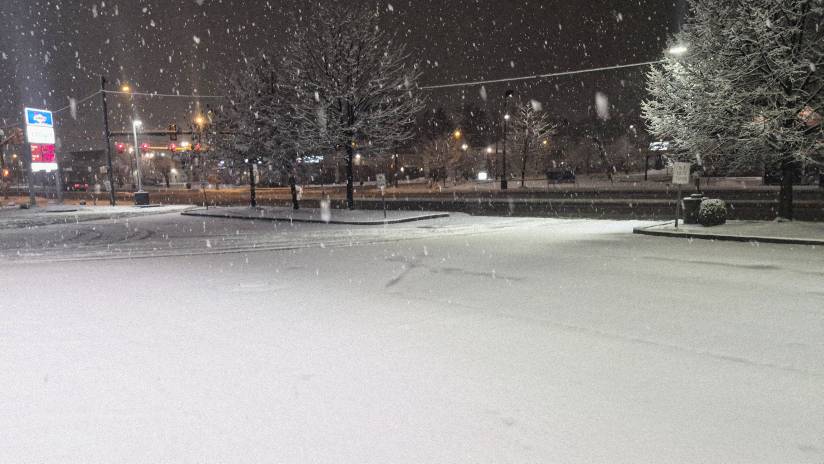
-
Central PA Winter 25/26 Discussion and Obs
Jns2183 replied to MAG5035's topic in Upstate New York/Pennsylvania
@canderdon this is winter version and reverse uno for 6 week period over this summer when 6 seperate events left me with .47" of rain and you with 5". Each of those events I had less than .10" while you had .75 to .89. I can understand if it was a random one-off event but it was weird seeing a pattern like that in the summer Sent from my SM-S731U using Tapatalk -
Central PA Winter 25/26 Discussion and Obs
Jns2183 replied to MAG5035's topic in Upstate New York/Pennsylvania
What's the elevation there Sent from my SM-S731U using Tapatalk


.jpg.fbdd40b4b77d3a2ff5dcff085992813b.jpg)