

NittanyWx
-
Posts
758 -
Joined
-
Last visited
Content Type
Profiles
Blogs
Forums
American Weather
Media Demo
Store
Gallery
Posts posted by NittanyWx
-
-
Wilton, CT 8 AM Obs
31/30
3" even on the ground
-
 2
2
-
-
8 minutes ago, kat5hurricane said:
Not here my friend and I'm in one of the colder spots of the boroughs. Main roads are wet still, I was just out in it. Not complaining, just saying it's taking a while to stick here at least.
It was mentioned several times that this would occur. The accumulations for this storm will likely double on non-paved surfaces.
-
1
-
-
Impressive stuff up in orange. This has been one of the weirder 24 hours leading into a storm in my career. Raising the totals for city and Island was right to do, but biting on the N/W sharp cutoff as a function of near term trends was not.
-
4
-
-
4-8" looks good for most (obviously less up by 84 and just north), again with the pavement caveat in urban areas and NYC. No need to fight the southerly trend this late. The returns in Tennessee weren't great this afternoon and think the trend south is a response to that.
-
4
-
-
16 minutes ago, jm1220 said:
Becoming optimistic this’ll be a good one for us. 2/28 last year was very marginal and we had 5” of paste. But we know the risks with white rain etc. The dynamics and snow rates with this one look awesome.
Was on the phone with my old boss this morning, told him 6" in that north shore snow zone is probably reasonable top end. But it's a snow board 6", i think a lot of 2-4", 2-5" readings mostly on grass

.thumb.png.c7ff1919721d0365395c4bc62f201b4a.png)
-
2 minutes ago, Franklin0529 said:
Sell the 4-8" in the city. 2-4" tops, which is better then it was looking 2 days ago
Think you can go in the middle of the two ranges and be fine. This storm is very juicy, but very marginal too. Snow board will do better than 'on ground'
It won't look or feel like 3-6" for a bunch of folks in the city (more than manhattan too, brooklyn et al).
-
3
-
-
Coastal marginal temps/mixing keep things at bay accumulation wise. it'll look nice for a period, you'll get some accumulation on grassy surfaces, but a lot of it will feel 'wasted'. It's still better than what it looked like a couple of days ago.
This is game on north of the merritt/287.
-
1
-
-
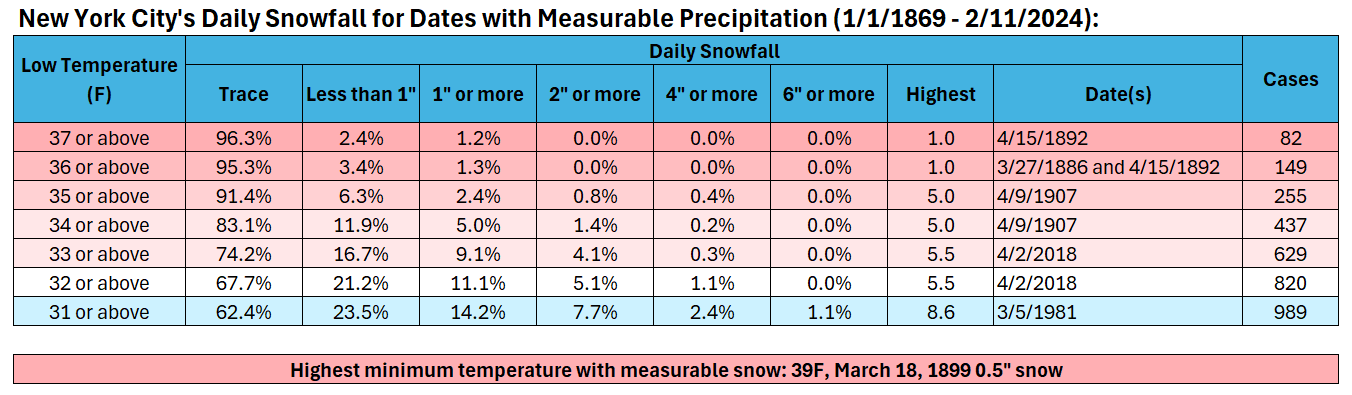
7 minutes ago, donsutherland1 said:
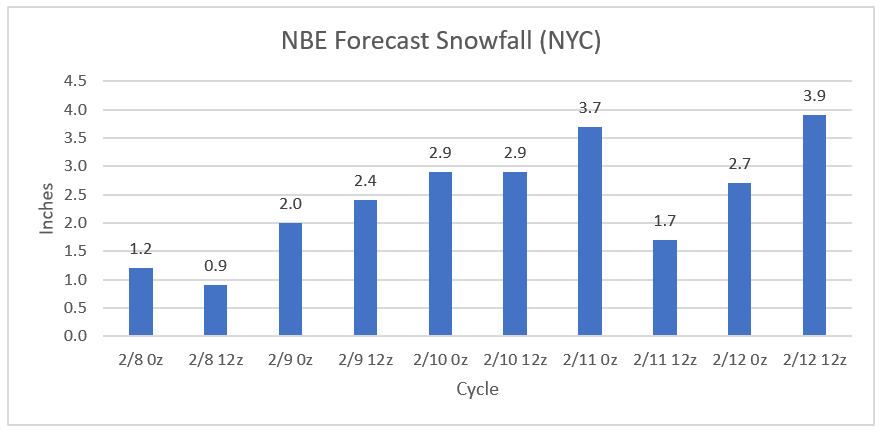
Overnight, the global and mesoscale models ramped up snowfall amounts for New York City. However, the forecast low temperature on the MOS and NBE remained at 35 or above. My assumption is that the actual temperature during the height of the storm will fall to 33 or 34 in New York City (up to 1 sigma below the 12z NBE estimate). Storm total ratios will likely be well below 10:1.
At 2/12 12z, the NBE had increased its estimated snowfall for New York City to 3.9".
NBE:
Historic data argues against the 10" or above amounts showing up on some maps (10:1 ratios).
Historic Data:
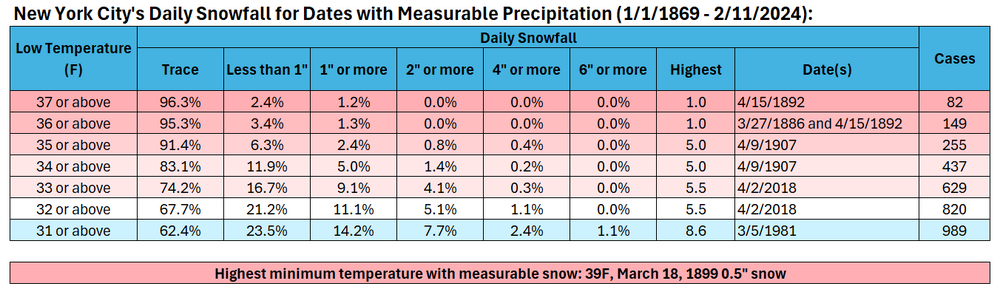
Based on a combination of the guidance adjusted for ratios, assumption about temperatures, and historic data, my thinking is that New York City will see 3"-6" of heavy wet snow (1" to perhaps 3" had been my initial thinking prior to the overnight guidance). The snow will fall moderately to heavily, but there will also be a lot of melting holding down amounts. Outside the City, a general 6"-10" looks plausible.
Similar thinking, pending 12z adjustments in track. I like this a lot in the 287-84-merritt-91 box
-
3
-
-
33 minutes ago, suzook said:
Some areas, especially the North shore could see 12 inches.
taking under on that 12" by a significant margin
-
5
-
-
I like this a lot for north of 287/Merritt, though a large chunk of our area is gonna waste some of the overnight precipitation to sleet and mix at the onset with the warm nose above 850 and best diurnal timing.
This is a frustrating one for the coast, especially the island, but that's often the issue in marginal storms like this one.
-
2
-
-
2 minutes ago, bluewave said:
SSWs only work out for us to get above normal snowfall seasons when the Pacific cooperates and its cold enough.
There is also tangential/research being done on what impact any SSW event has on the actual PV and the spatial distribution of 2m temperature anomalies/h5 pattern. There are statistically higher odds of certain loading and post event patterns depending on whether a displacement or full split event occurs.
-
3
-
-
Tropics Check
-
1
-
-
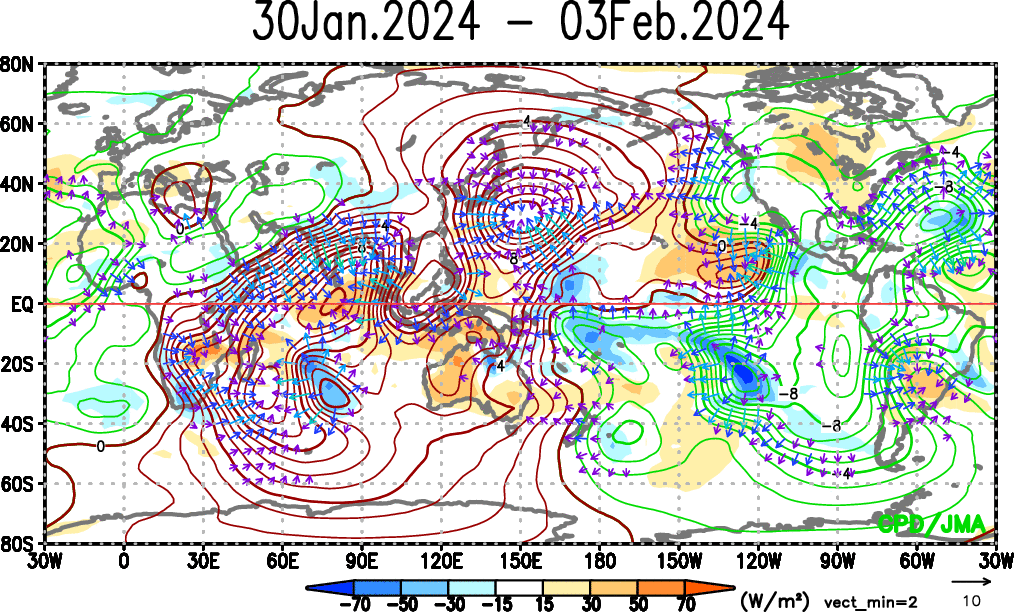
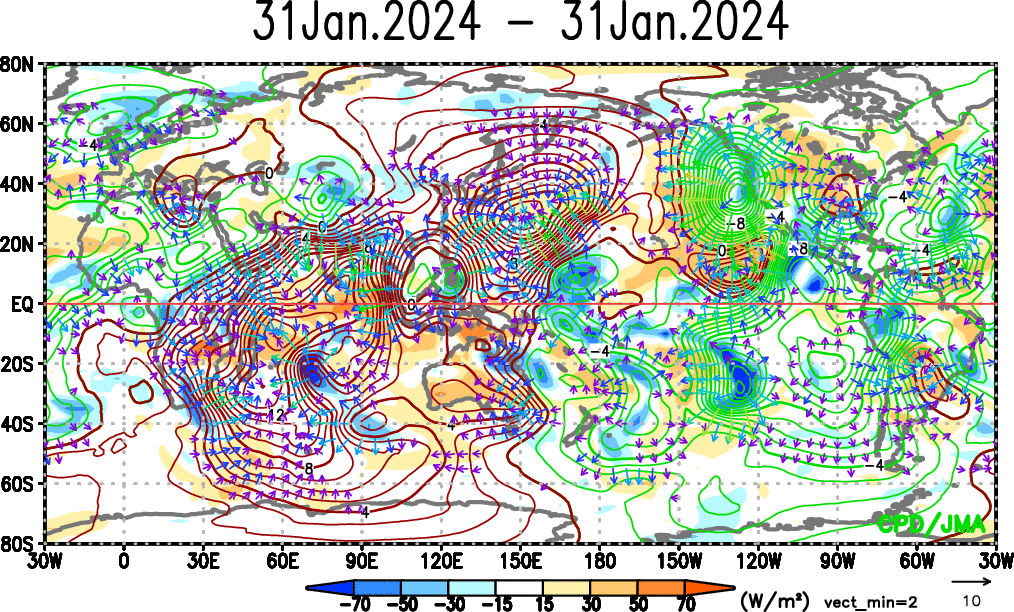
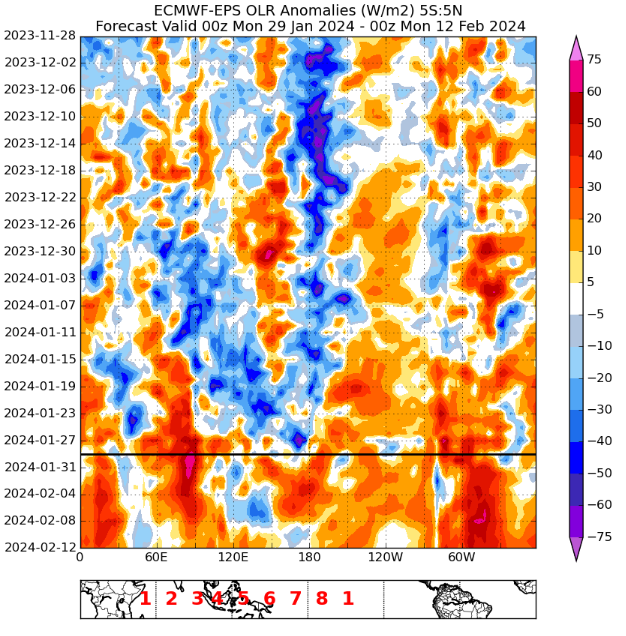
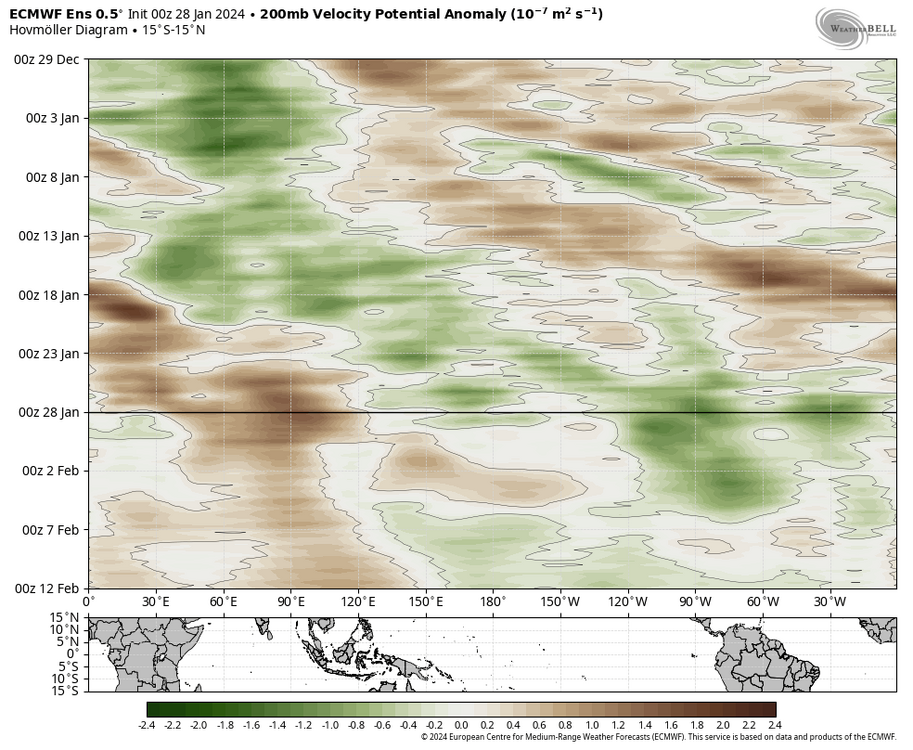
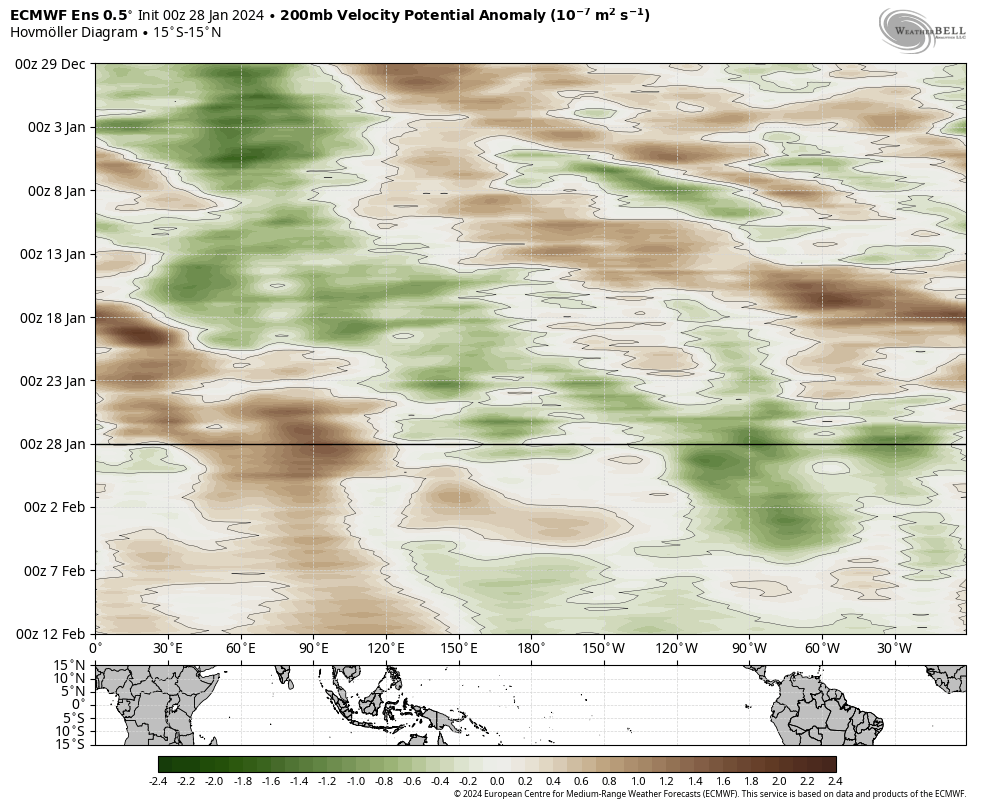
Once again, a clean eastward propagatation in subsidence...the models handled this well.
-
2
-
-
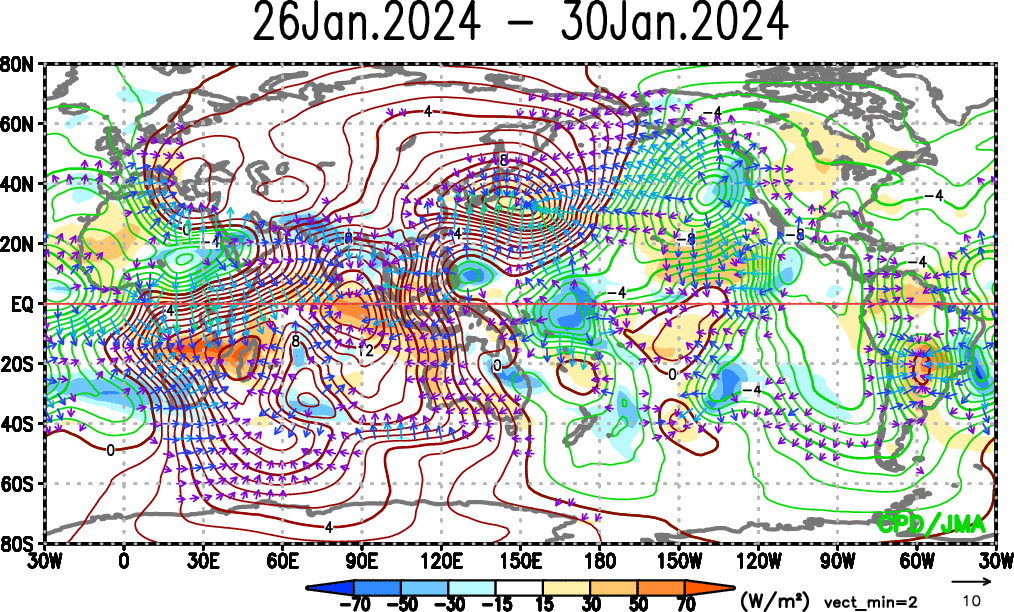
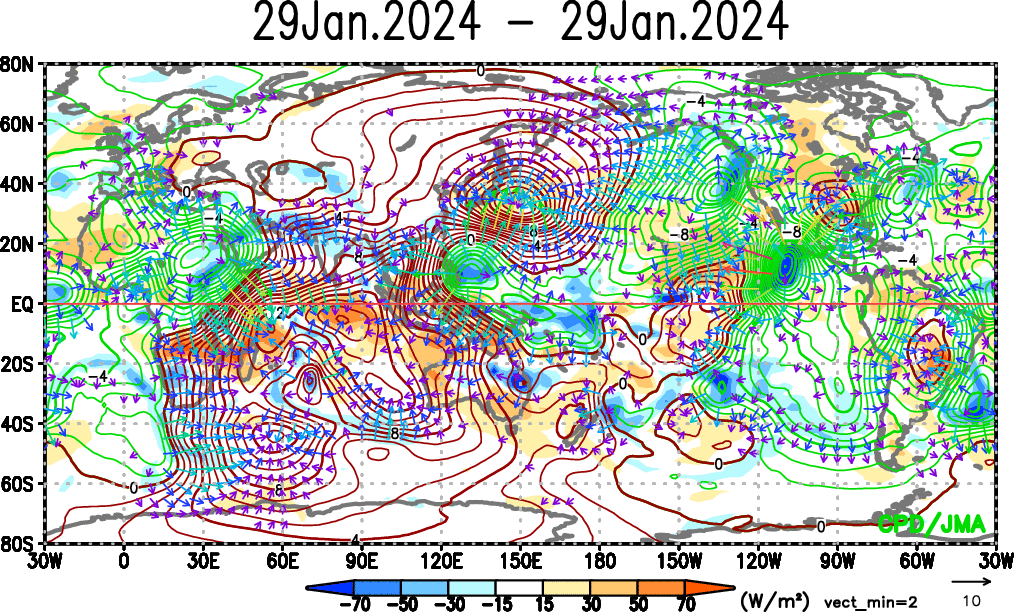
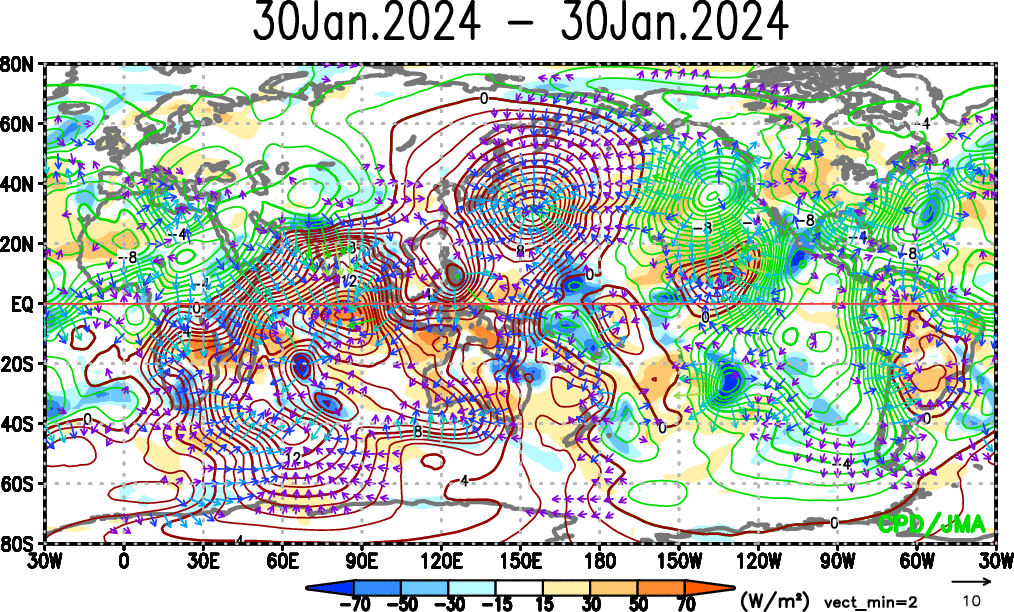
OLR/VPA tracking:
-
 1
1
-
-
1 hour ago, NorthShoreWx said:
What does the "bg" stand for in "bg warming". Google was no help with this question.
Background
-
 1
1
-
-
34 minutes ago, bluewave said:
Just look at how much the Euro monthly struggled with its January forecast issued back in December. It was going with something similar to a stock El Niño 500 composite in January. But instead we got a more Niña-like 500 mb pattern with a much stronger STJ due to the continuing El Niño. But the forcing from the Eastern IO into WPAC was missed. This is a common theme of the weekly and monthly model runs since the 15-16 winter due to the rapid expansion of the WPAC warm pool.
Forecast


Verification


We're talking about very different time horizons. I'm not using a Euro monthly inside d7, I'm not using a Euro weekly inside D7.
I am seeing W Pac subsidence inside d7 on most dynamic models though, and I'm also seeing upper level pattern shifts in regions of the tropics I forecast for reflect those changes. I don't think persistence is going to outperform the models inside d7, personally.
But we can verify on Feb 5-6 and see whether that's true or not. I suspect the model will win in this Jan 29-Feb 5 window.
-
24 minutes ago, bluewave said:
I think you continue to miss the point. Forcing west of the Dateline is a warm pattern for us here in the East. One of the biases exhibited by the models longer range is to weaken convection too quickly in this region. The forcing in the entire area around the WPAC warm pool has greatly surpassed the long range model forecast this winter and most winters since 15-16. This is a long term change which is independent of the El Niño this season. It’s the main reason why NYC is on track for a record 9 warmer than average winters in a row. Beyond the 2nd week of February, it’s still possible the convection can shift further east allowing something resembling a February El Niño pattern as we approach Presidents Day week. But we’ll have to just wait and see.
Let's check back in a week and see whether the OLR/VP diagrams back up your claim. Because so far, this has 'rolled forward' as it were. Long term trends also are subject to sub-seasonal variability, so you're essentally boiling this down to a persistence forecast inside the d7 timeframe. I don't agree with that approach right now. Sub-seasonal variability still does occur even with bg warming and longer term signals you're describing persisting.
If this was week 2 and this subsidence hadn't rolled forward, think it'd be fair to question whether this identified subsidence pattern ever emerges. But you're now arguing that a very strong +OLR anomaly west of the dateline is being misdiagnosed d 1-7 and therefore arguing more skill than the model inside the d7 window.
I'm skeptical of that, but let's see.
-
14 minutes ago, psv88 said:
Sign of a garbage winter: arguing about WHY the pattern sucks lol. Who cares
Just talking about the weather, man!
-
5
-
2
-
-
Like there's a clear difference between saying 'the P8-1 response is not as clean as I'd hoped' in tropical forcing terms and arguing 'oh this is stuck in P7'. I have a hard time making the argument 'this is stuck in P7' when the eastward migration of VP200 anomalies has already occurred and there's a Subsidence/+ OLR signal just west of the dateline...and a pretty coherent one at that.
That does NOT mean the MJO is 'not progressing''
What it does show, however, is the largely subjective nature of MJO usage...
-
4
-
 1
1
-
-
9 minutes ago, Allsnow said:
It’s clear we won’t make p8(weakly if anything) then reemerge into p1. The olr maps are finally showing convection moving out of p7 at the end of the 11-15day. That’s why I ask what is the Nino Feb response in p1/2

Your OLR maps here also show an eastward progression and reduction in W Pac forcing for the 6-10 day window. So, as diagnosed, a reduction in W Pac forcing and shift eastward.
Do you want to try again?
Here's another way to look at it
Now if you wanted to make the argument that E pac forcing is not responding as cleanly as you'd hoped to -VP anomalies in the region, I'd maybe think you'd have a point. But you didn't make that point, so...
-
2
-
1
-
-
4 minutes ago, Allsnow said:
I don’t care what your feelings are about my skill level…
It was evident days ago the mjo was slowing in p7 but I was told I had no idea what I was talking about by you and others…
Show your work.
-
1
-
3
-
-
56 minutes ago, Allsnow said:
Yup, don’t tell @NittanyWx or @brooklynwx99 this…
Im beginning to think we don’t make it to 8 and emerge into p1
I'm beginning to think you don't know what you're talking about.
On the other hand @bluewave does know his methodology even though I disagree with it and his conclusions right now. I don't think the tropical forcing is as hostile as he's making it out to be.
-
1
-
1
-
 1
1
-
-
40 minutes ago, bluewave said:
Yeah, the record +30C SSTs are holding the forcing in place longer now to the west of the Dateline. The old runs from a week ago were more favorable had the convection rapidly weakening. So it looks like the 2nd week of February will actually be warmer than the first week now.

New runs stronger forcing west of the Dateline and warmer 2nd week of February


Old runs weaker forcing to the west of the Dateline and colder pattern for 2nd week of February


I think your diagnosis of the forcing here is off. I see this as clear Nino forcing at the expense of the maritime continent, coinciding with +VP200 anomalies maritime continent.
You've got about as clean of an eastward propagation in the VP signal as you'd like. If this doesn't work in traditional canonical fashion for more active (potentially snowier) purposes, it will likely be due to the erosion of source region combined with a poor placement/durability of high latitude blocking as a result of several factors discussed over the past few weeks in here. All valid, but not cleanly explained by tropical forcing alone.
Right now and for the next week, however, you're getting the cleanest + 850 u-wind anomaly signal we've had so far this Nino with an eastward propagation of VP anomalies and a jet extension in the sub-tropics along with a fairly clean shut off of convection for about a week just west of the dateline (as shown in OLR anomalies too). Wheeler plots aside, those are the typical ingredients of a canonical back half Nino pattern from a tropical forcing/synoptics perspective.
So if this doesn't work, I think you'll need to look at factors other than the tropics for why this split flow pattern did not deliver. I've got a few reasons ready and I'm not convinced this is going to offer much, but I don't agree with your assessment of tropical forcing right now.
-
2
-
-
21 hours ago, brooklynwx99 said:
looks good to me
It's a fairly coherent 1 week period of E Pac to Central Am forcing while coinciding with subsidence over maritime continent, Pretty clean Nino all things considered.
If this doesn't work, it's likely for reasons unrelated to tropical forcing, which is the drawback to using this methodology. To me it looks like a split-flow NIno look for a bit though.
-
2
-

.png.dff95f3fab6a5ccfa805bf15699fb214.png)


2/13 Significant/Major Winter Storm Discussion & Observations
in New York City Metro
Posted
As far as the Euro/HRRR goes, this is one of the worst performances inside 36 hours I can remember.