

PhiEaglesfan712
-
Posts
792 -
Joined
-
Last visited
Content Type
Profiles
Blogs
Forums
American Weather
Media Demo
Store
Gallery
Posts posted by PhiEaglesfan712
-
-
4 minutes ago, GaWx said:
JB is actually calling for a not as active season as last year with ACE of 120-150, whose midpoint of 135 is only slightly above the ~122 avg of 1991-2020 along with only slightly above avg 7-9 H and near avg 2-3 MH:
Saffir-Simpson Hurricane Wind Scale Forecast
Named Storms: 15-19
Total Hurricanes: 7-9
Major Hurricanes: 2-3
ACE Index: 120-150Good luck with that. Anyone that's been paying attention knows we're not coming anywhere near these numbers.
-
 1
1
-
-
17 minutes ago, snowman19 said:
2013 was not very quiet and below average, it was exactly average. There were 14 named storms and 15 tropical depressions. 14 named storms is averageIt was only average in number of named storms. If you take a deeper look, 2013 finished with a Top 10 lowest ACE season, with only 2 hurricanes, and no major ones. (Even 2014 didn't go that low in those respects.)
2013 put up some numbers that seem unfathomable in this 21st century climate, especially coming off 3 very active seasons. It's a well-below average season.
-
I think it's pretty apparent that we're going to have a very quiet hurricane season in the Atlantic. Unlike last year, the Pacific is very active, already on their 4th named storm. As they say, when the Pacific is active, more than likely the Atlantic is quiet. This year is going to look more like 2013/2014 than 2010/2011/2012.
-
Let's not re-write the weather. Yeah, the first half of April was a bit cool and rainy (but only slightly to the average):
2025-04-01 62 44 53.0 4.0 12 0 0.16 0.0 0 2025-04-02 57 38 47.5 -1.9 17 0 0.02 0.0 0 2025-04-03 76 48 62.0 12.2 3 0 0.04 0.0 0 2025-04-04 71 60 65.5 15.4 0 1 0.88 T 0 2025-04-05 62 49 55.5 5.0 9 0 0.02 0.0 0 2025-04-06 55 48 51.5 0.6 13 0 0.02 0.0 0 2025-04-07 51 41 46.0 -5.3 19 0 0.28 0.0 0 2025-04-08 48 38 43.0 -8.7 22 0 0.00 0.0 0 2025-04-09 50 33 41.5 -10.6 23 0 0.00 0.0 0 2025-04-10 54 42 48.0 -4.5 17 0 T 0.0 0 2025-04-11 48 42 45.0 -7.9 20 0 1.24 0.0 0 2025-04-12 45 38 41.5 -11.8 23 0 0.14 0.0 0 But as you can see, after the 12th, it turns very hot and dry (only 0.03 inches of rain after the Nor'easter):
2025-04-13 62 42 52.0 -1.6 13 0 0.00 0.0 0 2025-04-14 70 44 57.0 3.0 8 0 T 0.0 0 2025-04-15 69 48 58.5 4.1 6 0 T 0.0 0 2025-04-16 57 44 50.5 -4.3 14 0 0.00 0.0 0 2025-04-17 63 37 50.0 -5.2 15 0 0.00 0.0 0 2025-04-18 72 42 57.0 1.5 8 0 0.00 0.0 0 2025-04-19 80 63 71.5 15.6 0 7 0.00 0.0 0 2025-04-20 73 51 62.0 5.7 3 0 0.00 0.0 0 2025-04-21 66 50 58.0 1.4 7 0 T 0.0 0 2025-04-22 80 53 66.5 9.5 0 2 0.00 0.0 0 2025-04-23 77 54 65.5 8.2 0 1 0.00 0.0 0 2025-04-24 79 50 64.5 6.8 0 0 0.00 0.0 0 2025-04-25 79 51 65.0 7.0 0 0 T 0.0 0 2025-04-26 75 53 64.0 5.6 1 0 0.03 0.0 0 2025-04-27 72 50 61.0 2.3 4 0 0.00 0.0 0 2025-04-28 75 47 61.0 2.0 4 0 0.00 0.0 0 2025-04-29 83 50 66.5 7.1 0 2 0.00 0.0 0 2025-04-30 80 57 68.5 8.8 0 4 T 0.0 0 The cold pattern, outside of a few hiccups, ended just after the 2/20 snow event. From about the last week of February until mid-May was mostly warm. Only around mid-May did we turn cold.
2025-05-01 81 54 67.5 7.5 0 3 0.00 0.0 0 2025-05-02 86 59 72.5 12.2 0 8 0.00 0.0 0 2025-05-03 85 64 74.5 13.9 0 10 0.04 0.0 0 2025-05-04 73 63 68.0 7.1 0 3 0.12 0.0 0 2025-05-05 73 61 67.0 5.8 0 2 T 0.0 0 2025-05-06 81 61 71.0 9.5 0 6 0.03 0.0 0 2025-05-07 75 60 67.5 5.7 0 3 T 0.0 0 2025-05-08 81 59 70.0 7.9 0 5 T 0.0 0 2025-05-09 64 51 57.5 -4.8 7 0 0.18 0.0 0 2025-05-10 74 49 61.5 -1.1 3 0 0.00 0.0 0 2025-05-11 82 55 68.5 5.6 0 4 0.00 0.0 0 2025-05-12 83 55 69.0 5.8 0 4 0.00 0.0 0 2025-05-13 71 62 66.5 3.1 0 2 0.28 0.0 0 2025-05-14 66 59 62.5 -1.2 2 0 1.30 0.0 0 2025-05-15 77 63 70.0 6.0 0 5 0.03 0.0 0 2025-05-16 77 60 68.5 4.2 0 4 1.50 0.0 0 2025-05-17 86 62 74.0 9.4 0 9 T 0.0 0 2025-05-18 77 64 70.5 5.7 0 6 0.00 0.0 0 Pretty clearly you can see the pattern change from warm to cold:
2025-05-19 71 56 63.5 -1.6 1 0 0.00 0.0 0 2025-05-20 69 50 59.5 -5.9 5 0 0.00 0.0 0 2025-05-21 57 52 54.5 -11.2 10 0 0.45 0.0 0 2025-05-22 56 51 53.5 -12.5 11 0 0.56 0.0 0 2025-05-23 69 51 60.0 -6.3 5 0 T 0.0 0 2025-05-24 68 50 59.0 -7.5 6 0 T 0.0 0 2025-05-25 71 52 61.5 -5.3 3 0 0.00 0.0 0 2025-05-26 75 53 64.0 -3.1 1 0 0.00 0.0 0 2025-05-27 74 54 64.0 -3.4 1 0 0.01 0.0 0 2025-05-28 59 53 56.0 -11.7 9 0 0.77 0.0 0 2025-05-29 74 57 65.5 -2.6 0 1 0.01 0.0 0 2025-05-30 79 63 71.0 2.6 0 6 0.88 0.0 0 2025-05-31 75 55 65.0 -3.7 0 0 0.06 0.0 0 -
3 hours ago, snowman19 said:
We have been in a very rainy, cool pattern since the last week of March. That looks to come to a real abrupt end next week as the pattern does a 180That's an exaggeration. Maybe since mid-May, but March until up to mid-May (outside of the Nor'easter on 4/11-12) was one of the warmer times of the year so far. We had 80+ the last 3 days of March. That stuff does not happen in a cool pattern! If we've been in a cool pattern since the last week of March, then 2025 would be on track to being the coldest year in a very long time, since the winter (January and February) wasn't that warm to begin with.
-
30 minutes ago, LibertyBell said:
July 2011 had historic heat.
About July 2013 that was one hot month, I remember July 4th was very stuffy, big heat and no wind lol. That was the last time PHL hit 100 too wasn't it?
Yeah, 2011 was very historic heat. But even after the pattern turned wet, we still got very warm lows in August/September, which kept the temp departure above average.
July 18, 2012 was the last 100 here at PHL. We got close in 2013 (the first 3 weeks of July were hot), but after that, it was unusually cool.
9 minutes ago, Stormchaserchuck1 said:I might not get out of the 60s Sunday and Monday. June is usually a big seasonal transition. I can't remember a time after my birthday (early June) where that has happened before (not getting out of the 60s).
I'm pretty sure it happened just 2 years ago. Remember the record low maxes during the summer solstice (June 21 and 22) in 2023?
-
7 hours ago, LibertyBell said:
You're thinking of 2014, 2013 was very much like the previous summers .... we usually group 2010-2013 together, it was the last time JFK hit 100. It was also the last time we had what I call a super heat wave..... 7+ days of 90+
2013 was a frontloaded summer at best. That one was pretty much done by 7/21. It's the only August without a 90+ day here in PHL in the last 40 years. Outside of that super heat wave in July, 2013's summer temperature stats were nearly identical to 2014 (with June and August both years differing by 0.1
2010-2012 had widespread heat in the East:
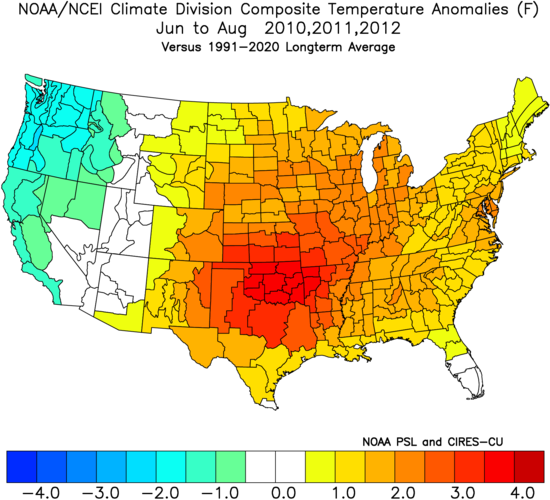
I don't see that with 2013 (which in fact looks cool in the Southeast):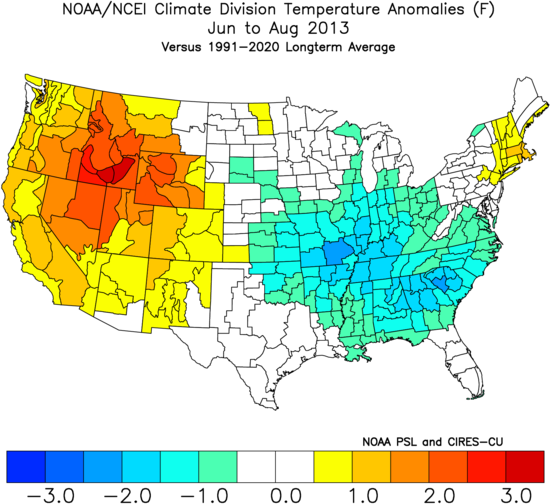 1 hour ago, snowman19 said:
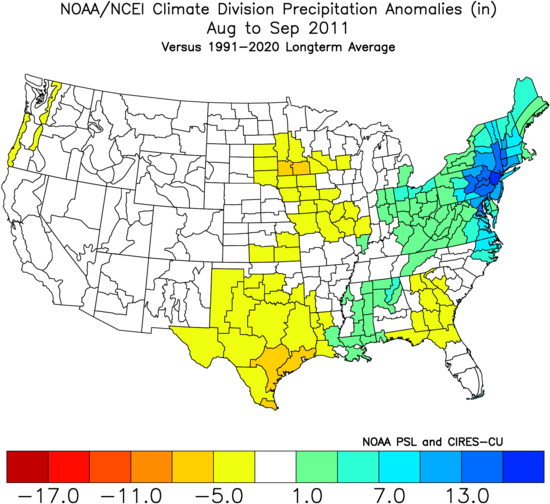
A “recent” Niña with a very wet summer that comes to mind was 2011. Tropical related rains back then of courseOf course, that was a much stronger la nina. The first year was a strong la nina, and the second a moderate la nina. Not to mention, a deepening -PDO and a pattern that changed at the start of November. Everything that could go wrong, went wrong, which is why we had the torch we had from November 2011-March 2012. (I don't see any similarities with now. In fact, I see much more similarities with 2013 than with 2011. Like now, we are much closer to ENSO neutral and a solar max in 2013. Definitely not what we had in 2011.)
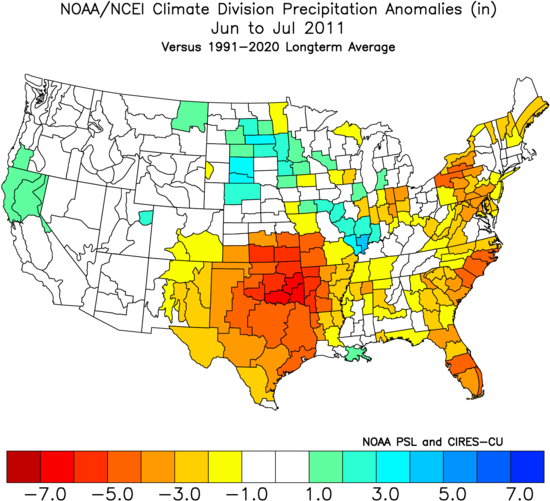
2011 was dry in June and July. The record rains were in August and September.
-
 1
1
-
-
7 hours ago, mitchnick said:
Cfs2 pretty consistent (2+ weeks) with around normal temps to below in the east for the rest of the summer, with at or above rainfall. Basically, a continuation of what we've been seeing. This is fairly different from recent summers, so I wonder whether it's a "hint" for a change in the winter Niña winter pattern.
Almost reminds me of what happened in summer 2013. Prior to that year, the 3 years before (2010, 2011, and 2012) were very active Atlantic hurricane seasons and hot/dry summers in the East. 2013 was nearly the opposite: A very quiet Atlantic hurricane season and a record wet summer in the East, one that turned cold at the end of July in the Northeast (and was cold throughout the whole summer in the southeast).
The difference between last year and this year is the Pacific is active this year, which is why I am more confident in a below average Atlantic hurricane season in 2025.
-
AM 2025 MEI: -0.4
Using the MEI, 2012-13 is the best analog:
2012 -1.1 -0.7 -0.6 -0.4 -0.3 2025 -1 -0.8 -0.7 -0.4 -0.4 -
1
-
-
On 6/7/2025 at 8:06 PM, RedSky said:
How did the Phillies go from the 2nd best record to possibly the worst looking club in baseball in two weeks
I doubt they could beat a boomer softball team now
Things could be worse. You could be a Marlins fan, like I am. I officially gave up on the season when we were swept at home by the Rockies. It's going to be a while before my team is competitive again. It's a shame because we were doing good between 2020-2023.
-
43 minutes ago, bluewave said:
This one long range climate model initialized in 2013 did a great job forecasting the +PDO shift in 2014 that lasted through 2018.
It did not last through 2018. The +PDO was done in by the 2nd half of 2016 (July 2016 PDO +0.57, August 2016 PDO -0.63). It came to an end pretty much at the same time as super el nino. From about late 2016 until 2019, we were in a period of 0 PDO, before we went negative for good in early 2020.
-
1
-
-
MAM 2025 ONI (NOAA): -0.1
MAM 2025 RONI: -0.53
May 2025 PDO: -1.71
-
2
-
-
I think it was Dec 1998. I remember temps were in the 60s the morning of the 22nd, then fell throughout the day. The lows ended up in the 20s, and it snowed the next day.
1998-12-22 64 24 44.0 6.9 21 0 0.05 0.0 0 1998-12-23 27 20 23.5 -13.3 41 0 0.10 1.5 0 -
2
-
-
36 minutes ago, LibertyBell said:
I noticed those are the only ones that have the temperature jump.
I'd argue the temperature jump in the 80s took place during the 86-88 el nino, rather than the 82-83 one. Global temperature for 1982 was lower than 1973 and 1978-81, and 1983's was right there with 1981. We really didn't break through the glass ceiling of 0.35 until 1988.
-
1
-
-
12 minutes ago, LibertyBell said:
what about super (+2) el ninos?
I think only 1982-83, 1997-98, 2015-16 ?
Yes, that's the list, though you could add 1972-73.
-
1
-
-
54 minutes ago, LibertyBell said:
Yes the high end el ninos create these jumps that accentuate its effects even more. It makes me wonder if these high end el ninos are increasing in frequency too.
Not really. Here are the high end el ninos (+1.5) since 1949-50 (bold are the very strong ones +2):
1957-58 (temperature jump: no)
1965-66 (temperature jump: no)
1972-73 (temperature jump: maybe)
1982-83 (temperature jump: yes)
1986-88 (temperature jump: yes)
1991-92 (temperature jump: no, but due to Mt. Pinatubo)
1997-98 (temperature jump: yes)
2009-10 (temperature jump: no, but 2010 was the warmest year on record at that point)
2015-16 (temperature jump: yes)
2023-24 (temperature jump: yes)
The gap between strong el ninos seem uniform (although there was a higher frequency in the 80s and 90s, due to the +PDO period), and the gap between super el ninos is actually increasing (10 between 72-73 and 82-83, 15 between 82-83 and 97-98, and 18 between 97-98 and 15-16. We are currently at 9 and counting since 15-16.)
-
1
-
-
11 hours ago, roardog said:
I wouldn’t think 98-99 would be your kind of winter. Some great snow depth in January for awhile but it certainly wasn’t a cold, snow covered winter overall. I would actually put this past winter above 98-99 for overall wintery feel.
That type of winter would almost certainly be a blowtorch winter in the Eastern US in today's warming climate. All you have to do is look at 2016-17, which was a similar-type winter to 98-99, and that torched in January and February. If not for March, this would have been a low-snow season in Philly and NYC. In places south of Philly, 16-17 was a Top 10 least snowy winter in Baltimore and DC.
-
 1
1
-
-
25 minutes ago, LibertyBell said:
I thought it was because volcanoes like Pinatubo have more of an influence over the summer than the winter? It had a big impact in summer 1992.
Timing of the volcano has an impact as well. The effects of it usually have a lag, and Pinatubo happend in June 1991, so the summer of 1992 would have been one year after. Also, the effects may have lingered into the following the winter, with the major snowstorm in March 1993.
-
1
-
-
Our last major volcanic eruption was Mt. Pinatubo (in 1991), but we didn't really get the full effects of the cooling due to a strong el nino. Just the fact that it was able to cause any type of cooling, despite the strong el nino, should tell you how strong that volcanic eruption was. If Pinatubo happens ahead of strong la nina, like in the summer of 2007, there's no doubt in my mind we would have had a longer lasting temporary cooling period.
-
2
-
-
7 hours ago, LibertyBell said:
May 2020 34 degrees and snow on May 9th in NYC and June 2023 with a low in the 40s on June 4th are two more examples of it.
June 2023 was helped by the smoke and very low humidity. That wasn't even the coldest average temperature days of the month. We had highs in the 60s, and thus degree heating days, later in the month (during the solstice, on the 21st and 22nd).
June 4 was only 5-6 degrees below average. June 21-22 was 12-13 degrees below average. That's a temperature departure you see in winter, not during the summer solstice.
-
1
-
-
9 hours ago, LVLion77 said:
Just imagine if it was all snow.
.I mean, we had two Nor'easters this year - one on April 11-12, and the other on May 21-22. Why can't that happen during the winter?
-
1
-
-
37 minutes ago, bluewave said:
The planet has recently experienced a much greater rise in temperatures to a new higher baseline with the 23-24 winter. So this is why we were not able to see a repeat this past 24-25 winter of the 13-14 analog which was being discussed back in December. This new warmer base state was significantly higher than the 13-14 winter.
The 13-14 analog wasn't even a good match for this past winter. The 12-13 analog was a much better match, as that was a deep -PDO that peaked in the fall. This past winter was colder than 12-13, and had comparable snow totals in most areas, in the Eastern US. Those predicting a 13-14 analog for 24-25 were just grasping on straws.
In 13-14, you still had a -PDO, but it was generally trending towards 0, which was what we have this year. (And of course, the WPAC jet cooperated, unlike in most of 11-12 and 12-13.) If we can have a similar WPAC jet to 13-14, I think a cold and snowy winter in 25-26 is pretty much locked in.
-
11 hours ago, Albedoman said:
In fact, we maybe back in the 40's for overnight lows and highs only in the upper 60's for June 1 ------ Coolest I have seen for us in June but it does save on the AC bills.
We got this cold in June just 2 years ago, right around the summer solstice.
-
15 hours ago, JTA66 said:
Less than a month and we start losing daylight again. Summer is flying by!
67F
About 2-3 weeks from now, we'll have the earliest sunrise, and we stay constant daylight for about a few weeks before starting the downward trajectory in late June. As we roll further into July, it becomes more noticeable.
2025-2026 ENSO
in Weather Forecasting and Discussion
Posted
All the subtle changes. For one, the Pacific is already active this year. That was not the case last year. Secondly, we're entering a 2nd year without a clear ENSO state, and we're near a solar max. The last time we had those conditions were in 2013 and 2014, and both produced well below average seasons. (Quite a contrast to 2010-2012, which were 3 very active seasons.)
Everything is screaming this is going to be a quiet season. Here's my forecast (using 2013 and 2014 as my main analogs):
11 named storms (range 8-14)
4 hurricanes (range 2-6)
1 major hurricane (range 0-2)
51.5 ACE (range 36-67)