


PhiEaglesfan712
-
Posts
1,853 -
Joined
-
Last visited
Content Type
Profiles
Blogs
Forums
American Weather
Media Demo
Store
Gallery
Posts posted by PhiEaglesfan712
-
-
11 hours ago, SnowGoose69 said:
The real question way too early is will the La Nina of 27-28 make 88-89 and 10-11 look weak
I have a feeling that the la nina will be delayed to 28-29, like 88-89. It will still be very strong, but I think there will be a 2nd year of dissipation. 27-28 will probably be a weak to moderate el nino, which peaks early.
-
1 hour ago, SnoSki14 said:
You're actually right this time. Upper 70s in my forecast right now. Could be 80+ for 2-3 days. Crazy stuff
This was actually a very easy call. I could see it months ago that we were going to have a warm beginning of November, like 2020, 2022, and 2024.
-
 1
1
-
-
-
8 hours ago, MANDA said:
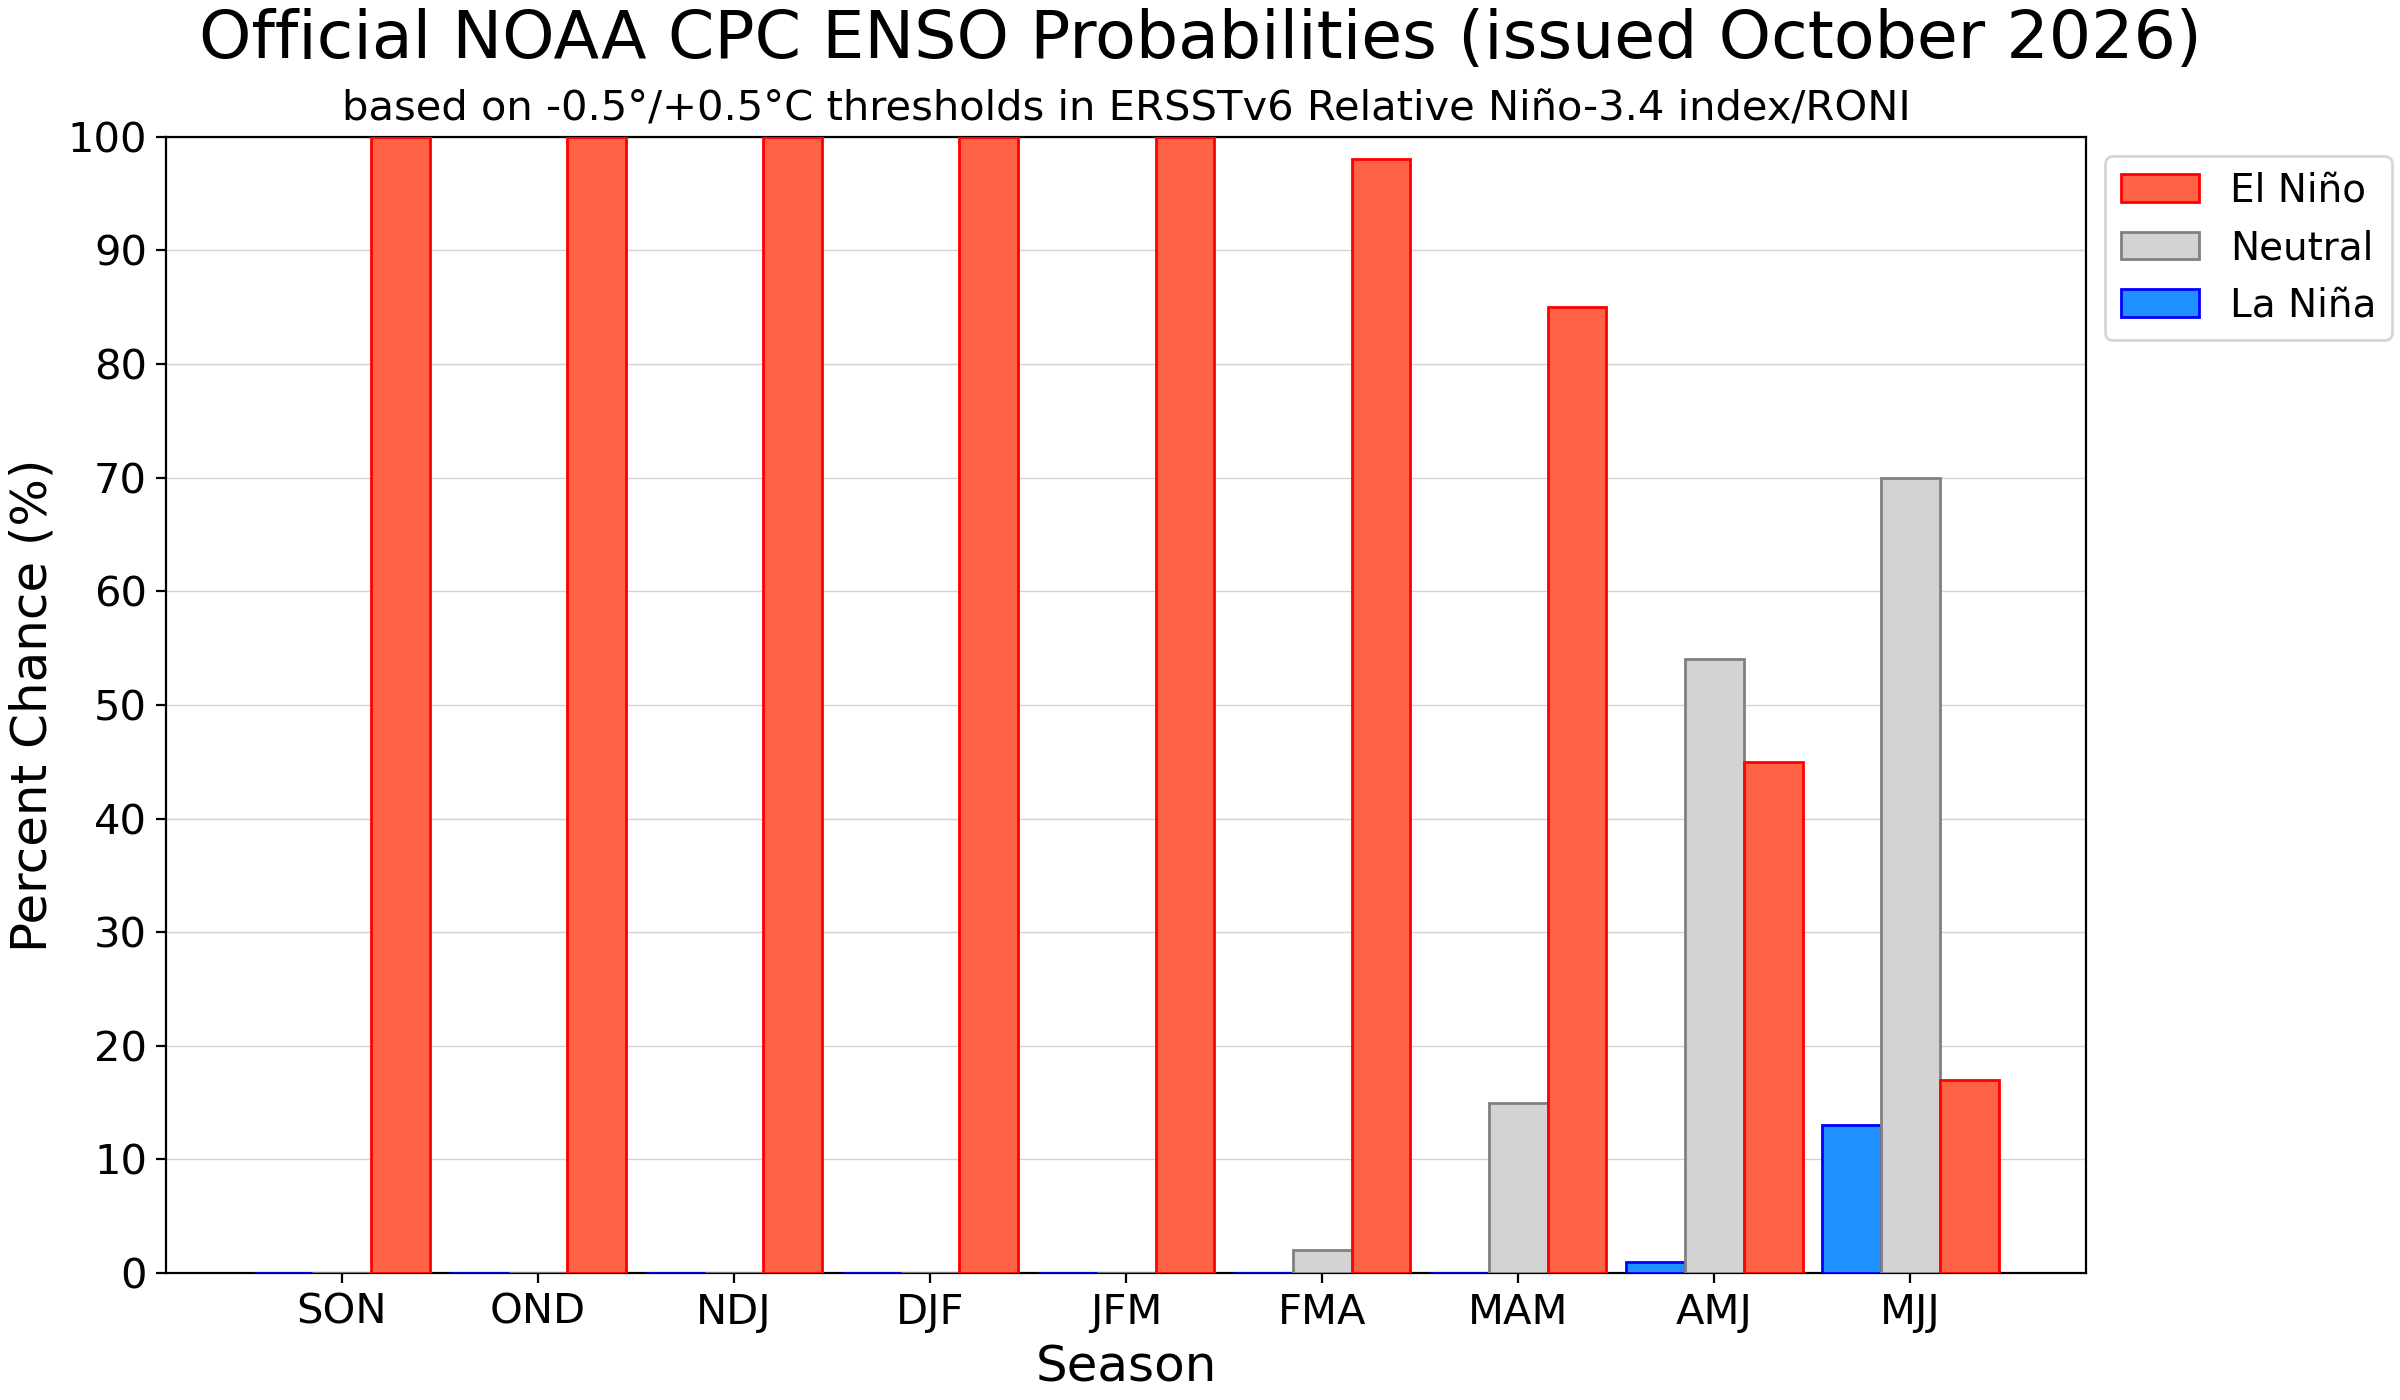
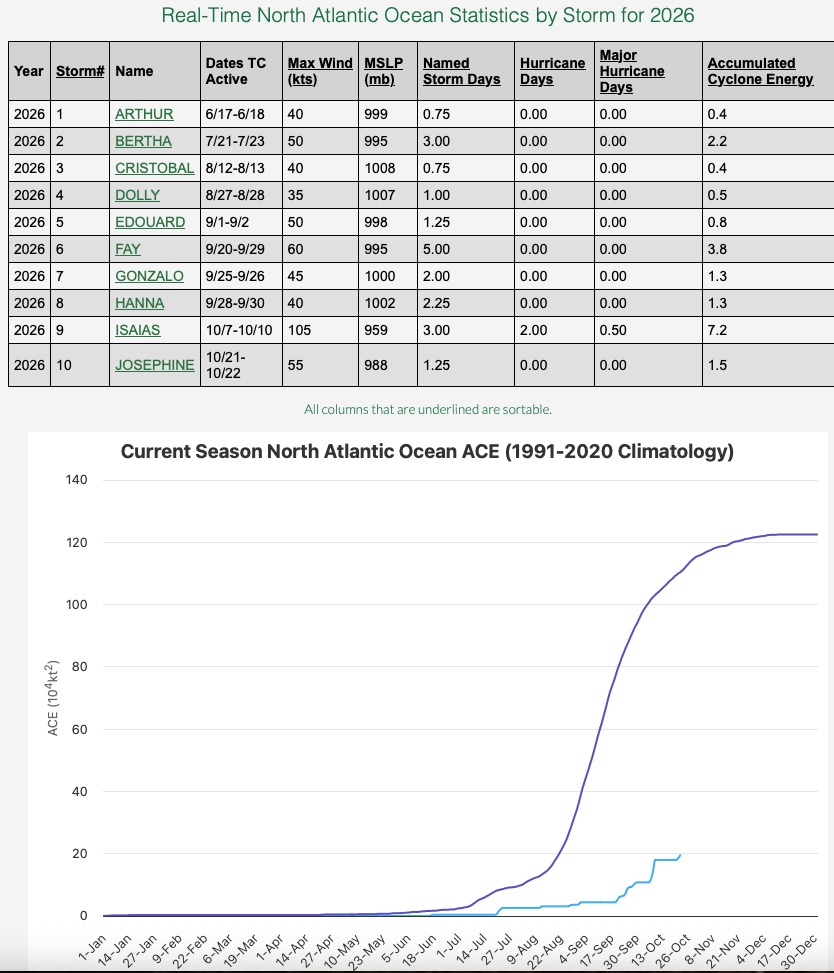
This could be about it for the season. Two storms make up almost 60% of a sad seasonal ACE number.
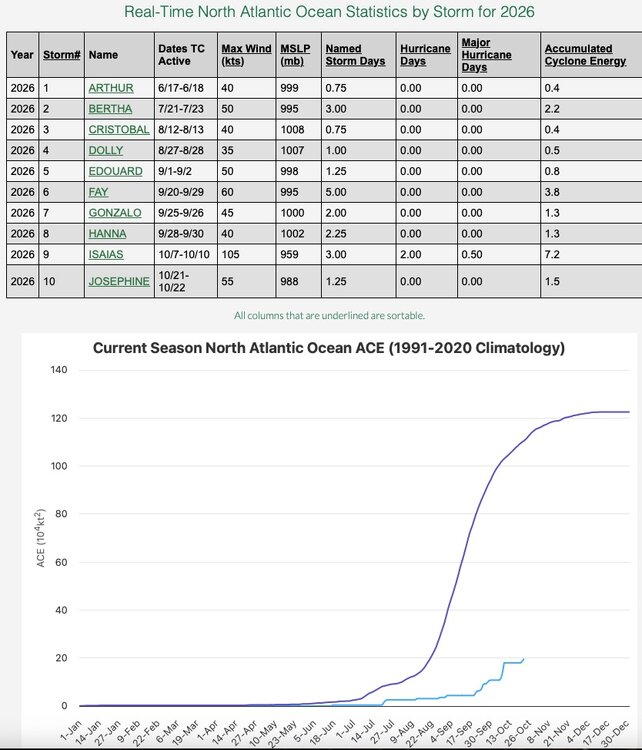
2007 (with Dean and Felix) probably holds the record for the 2 biggest storms making up the highest percentage of a season's ACE.
-
1
-
-
000
WTPZ32 KNHC 221446
TCPEP2

BULLETIN
Tropical Storm Vance Advisory Number   5
NWS National Hurricane Center Miami FL       EP222026
900 AM CST Thu Oct 22 2026

...VANCE GETTING STRONGER WELL SOUTH OF MEXICO...


SUMMARY OF 900 AM CST...1500 UTC...INFORMATION
----------------------------------------------
LOCATION...9.7N 101.0W
ABOUT 505 MI...810 KM S OF ACAPULCO MEXICO
ABOUT 680 MI...1095 KM SSE OF MANZANILLO MEXICO
MAXIMUM SUSTAINED WINDS...60 MPH...95 KM/H
PRESENT MOVEMENT...NW OR 305 DEGREES AT 3 MPH...6 KM/H
MINIMUM CENTRAL PRESSURE...997 MB...29.44 INCHES


WATCHES AND WARNINGS
--------------------
There are no coastal watches or warnings in effect.


DISCUSSION AND OUTLOOK
----------------------
At 900 AM CST (1500 UTC), the center of Tropical Storm Vance was
re-positioned to near latitude 9.7 North, longitude 101.0
West. Vance is moving toward the northwest near 3 mph (6 km/h), and
a slow northwest to north-northwest motion is expected for the next
few days.

Satellite imagery indicate that the maximum sustained winds have
increased to near 60 mph (95 km/h) with higher gusts.  Vance is
forecast to become a hurricane tonight and could become a major
hurricane by the weekend.

Tropical-storm-force winds extend outward up to 90 miles (150 km)
from the center.

The estimated minimum central pressure is 997 mb (29.44 inches).


HAZARDS AFFECTING LAND
----------------------
SURF: Swells generated by Vance are expected to begin affecting
portions of the coast of southern and southwestern Mexico this
weekend and continue into next week. These swells are likely to
cause life-threatening surf and rip current conditions. Please
consult products from your local weather office.


NEXT ADVISORY
-------------
Next complete advisory at 300 PM CST.

$$
Forecaster Blake
-
27 minutes ago, FPizz said:
2nd worst winter ever in my location in NJ outside of the NYC. 5.5" 01-02 was the worst with 4". 96-97 - 01-02 was the worst 6 year stretch for me. 00-01 was good, but the others were all bad, all different enso's
Even the ending of 00-01, with the March snowstorm bust, soured that season. But after 01-02 came one of the best 3-year stretches ever...
1997-98 super el nino was followed by 1998-2000 strong la nina. The 2nd year of the strong la nina (1999-2000) had a good few week stretch in January.
-
1
-
 1
1
-
-
It depends on the place. 2012 was the only real widespread cancellation. 2011 and 2020 some places had, but there were cancellations. Also, remember that 2011 was on a weeknight (Monday) and 2020 on a weekend (Saturday).
In my place, 2011 was cancelled, but 2020 went on (albeit a much lower turnout).
-
20 hours ago, NEG NAO said:
2024 reached into the 80's the warmest Halloween on record and 2019 reached close to 80 BUT both 2012 and 2020 Halloweens were cancelled in many towns - 2012 because of power outages and damage from Sandy and 2020 because of Covid and 2012 and 2020 were both one of the coldest Halloweens on record with highs only in the 40's anyways - 2011 had measurable snow a couple days before Halloween
Halloween getting cancelled in 2011 and 2012 was perfect timing for me, as I was in my final 2 years of college at Drexel and not a kid. I really despise when college students go all out for Halloween, but I feel bad for the kids that missed out on 2 Halloweens in a row.
-
1
-
-
On 10/15/2026 at 7:08 PM, vortex95 said:
Hazel in Oct 1954 was a rare beast.
First, it is strongest, farthest N HU landfall for so late in the season the CONUS on record (115 kt).
Second, it likely the quickest ET transition for an intense landfall CONUS HU. HURDAT2 shows it ET only 2.5 hr after landfall!
Third, its phase w/ a strong baroclinic trough was about as ideal as you could get, similar to Fiona in Sep 2022 I bet. It still had sustained winds of 70 kt when it was at 40N/77W, which is extraordinary. It was racing N at 42 kt once inland as well.
A truly exceptional event, similar to Sandy, but for wind more potent. So is it any surprise such crazy winds occurred so far N? Not only NYC recorded its record gust of 98 kt, but also DC as well (85 kt).
It's why I say events like Sandy are not unprecedented or really or not as uncommon as portrayed. Hazel, the 1938 New England HU, and Agnes in 1972, were much like this, getting picked up strongly and eventually phasing in w/ an potent baroclinic trough that would have resulted in a sig storm even w/o the HU present. And they each ended up setting the big records differently. Hazel and 1938 was about wind, Agnes was about rain/flooding, and Sandy was about storm surge.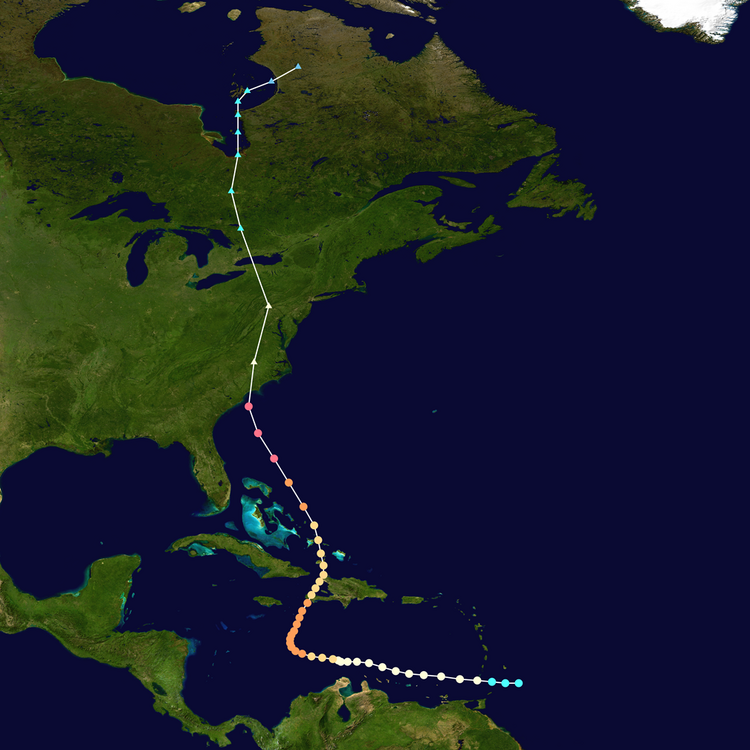
What made Sandy an 'unprecedented' event was the timing of the event, not so much the storm itself. It happened in late October, which was well outside of the climatological peak for such an event. Same as why the Ash Wednesday storm (1962) and the Blizzard of 1993 are held in high regard. There are many winter storms like those, but most of them are during the Meteorologic Winter, not in March.
-
3 hours ago, cmillzz said:
it’s been fairly mild for most of Northeast this fall, though not a complete blowtorch like the Midwest/Plains has been seeing. The Northeast may cash in on that warmth toward the end of the month though, just in time for Halloween.
I think the record warmth will be in the early part of November, like the other even years this decade (2020, 2022, and 2024).
-
2
-
-
1 hour ago, Keith Central PA said:
Many people here are throwing around December 2015..talk about extreme.+5 December is warm enough, which I could see, but +12?. It would have to be very dry with many days in the 60's, but with this el nino who knows?.I think we'll get a good idea how warm in mid ,late November.
November doesn't have to be warm to have a warm December. 2021 and 2023, which were the 2nd and 3rd warmest Decembers in the East (after 2015), were near to slightly below average in November. And don't forget about 2012, which had one of the coldest Novembers in the East (after Hurricane Sandy), before turning warm in December.
-
1
-
-
5 hours ago, FPizz said:
Snow wise, the 90s were the worst decade of my life even with the best season ever
We had 3 great [post-volcanic] seasons (1992-93, 1993-94, and 1995-96). Imagine how much worse it would have been without Pinatubo.
-
1
-
1
-
-
5 hours ago, Floydbuster said:
Thanks for the stats.
Yeah, the last decade or so has really changed my views when it comes to Atlantic Hurricane Seasons. Several of my own personal tropes have been thrown to the wayside.
1. A high end Cat 4 hurricane can only strike Florida, and likely most places anywhere in the United States before late September. You wont see high end Category 4 storms striking areas of the Bahamas or around the east coast of Florida after late September. Joaquin 2015, Matthew 2016, and Michael 2018 threw that away.
2. All major hurricanes tend to weaken at landfall on the north Gulf Coast. Michael 2018, Laura 2020, Ida 2021 and Helene 2024 threw that one away.
3. A Category 5 landfall on the North Gulf Coast is highly unlikely, and Camille 1969 was likely overestimated in strength. See: Hurricane Michael 919 mb.
4. A strengthening Category 5 hurricane into landfall on the North Gulf Coast in MID-OCTOBER is not possible. Again, see: Michael 2018.
5. September 10th is the peak of the season. Honestly, it should be October 1st at this point.
6. The Big Bend rarely gets hurricanes. B.S. I have seen more maps of the Big Bend the last ten years than I can count.
Quite frankly, those things should have been thrown by the wayside after 2005. That decade from 1995-2005, especially the last 3 years (03-05), is a hyperactive stretch that we are unlikely to see again.
-
12 minutes ago, Keith Central PA said:
A good indication will be late October and early November, that's when the torch began leading to that insane Decmber month..Lets see if we see that in a few weeks
2021 and 2023 were warm in October and cool in November before torching in December. Then again, those were -QBO years, with 2021 being a la nina. 2023 was a strong nino.
If I remember correctly, 2015 had a very warm late August and September. October was the odd cool month in the bunch.
-
1
-
-
1 hour ago, snowman19 said:
This is by far the strongest signal for a warm December since 2015
Yeah, there are years when you just sniff out a warm December. 2015, 2021, and 2023 were pretty obvious. The Weather Channel had these predicted months in advance. This year looks like that way as well. 2026 would make it the 4 warmest Decembers ever in 12 years.
-
56 minutes ago, Floydbuster said:
Well that was yet another strike for the Panhandle/Big Bend/West Coast of Florida. I feel like the last decade has been really intense for that area.
Hermine 2016
Irma 2017
Michael 2018
Sally 2020
Ian 2022
Idalia 2023
Debby 2024
Helene 2024
Milton 2024
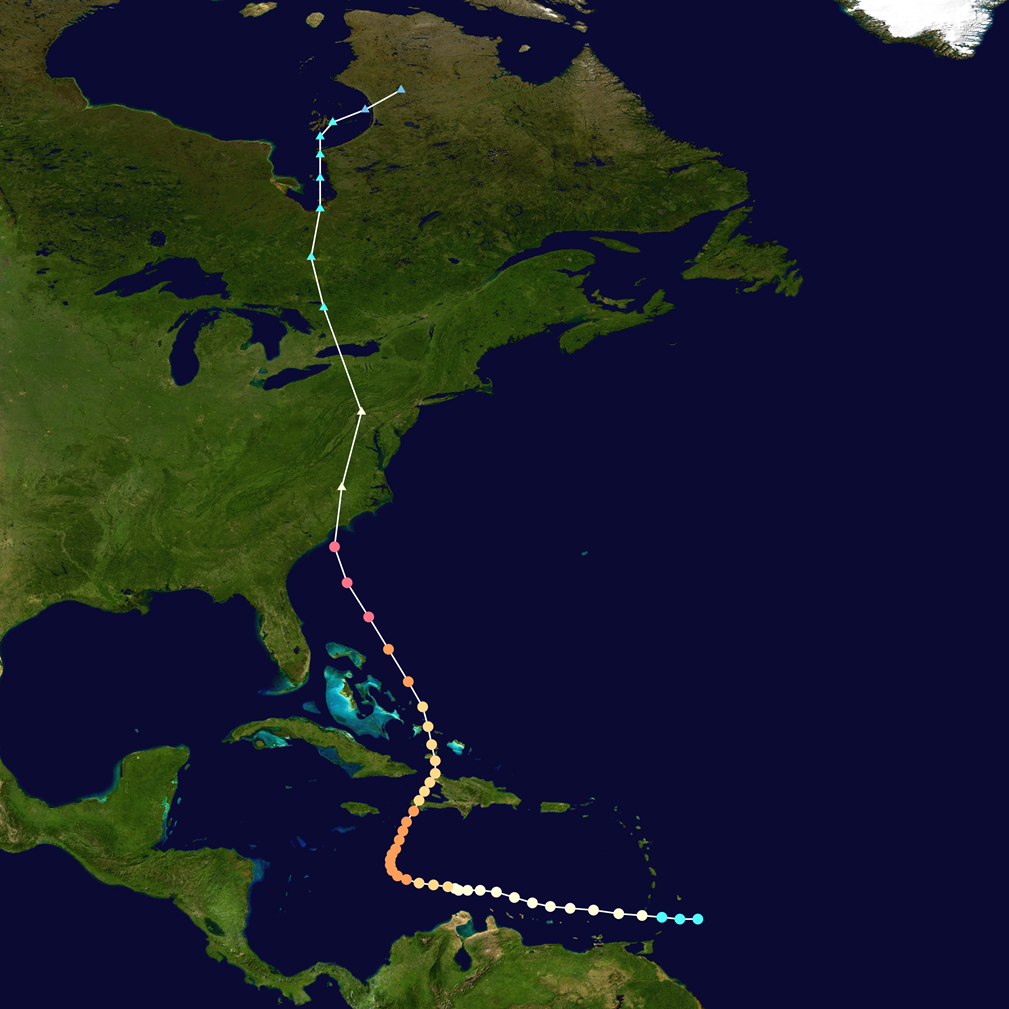
Isaias 2026Ten hurricanes in ten years all on from Pensacola down to Naples.
Chalk it up to the law of averages. The previous decade (2006-2015) had none in that area.
-
If we have a +QBO, then November (at least the beginning of the month) is going to be very warm in the Eastern US. The last 3 +QBO years (2020, 2022, and 2024) all featured record warmth in the early part of November.
-
On 10/7/2026 at 6:19 PM, Birds~69 said:
Probably the same way we received a 2nd rounder for AJ Feeley back in the day. Everyone was scratching their head about that one. I think AJ had a couple good games and Miami took the bait...
Trade Details and Context- The Deal: Miami traded their 2005 second-round pick (No. 35 overall) for Feeley, who had been a backup and spot-starter for Philadelphia.
- The Expectations: Dolphins management hoped Feeley would compete with or replace incumbent starter Jay Fielder, signing him to a multi-year deal.
- The Outcome: Feeley struggled during the 2004 season, going 3–3 as a starter in a tumultuous year for the franchise.
- Subsequent Move: By October 2005, under new head coach Nick Saban, Feeley was traded again—sent to the San Diego Chargers in exchange for backup quarterback Cleo Lemon.
Man, that was rough. To add salt to the wound, the following offseason, the Dolphins passed up on Drew Brees and signed a washed Daunte Culpepper. The butterfly effect of this is that Saban left the Dolphins to join the Alabama Crimson Tide, where he created a dynasty.
-
1
-
3 hours ago, bluewave said:
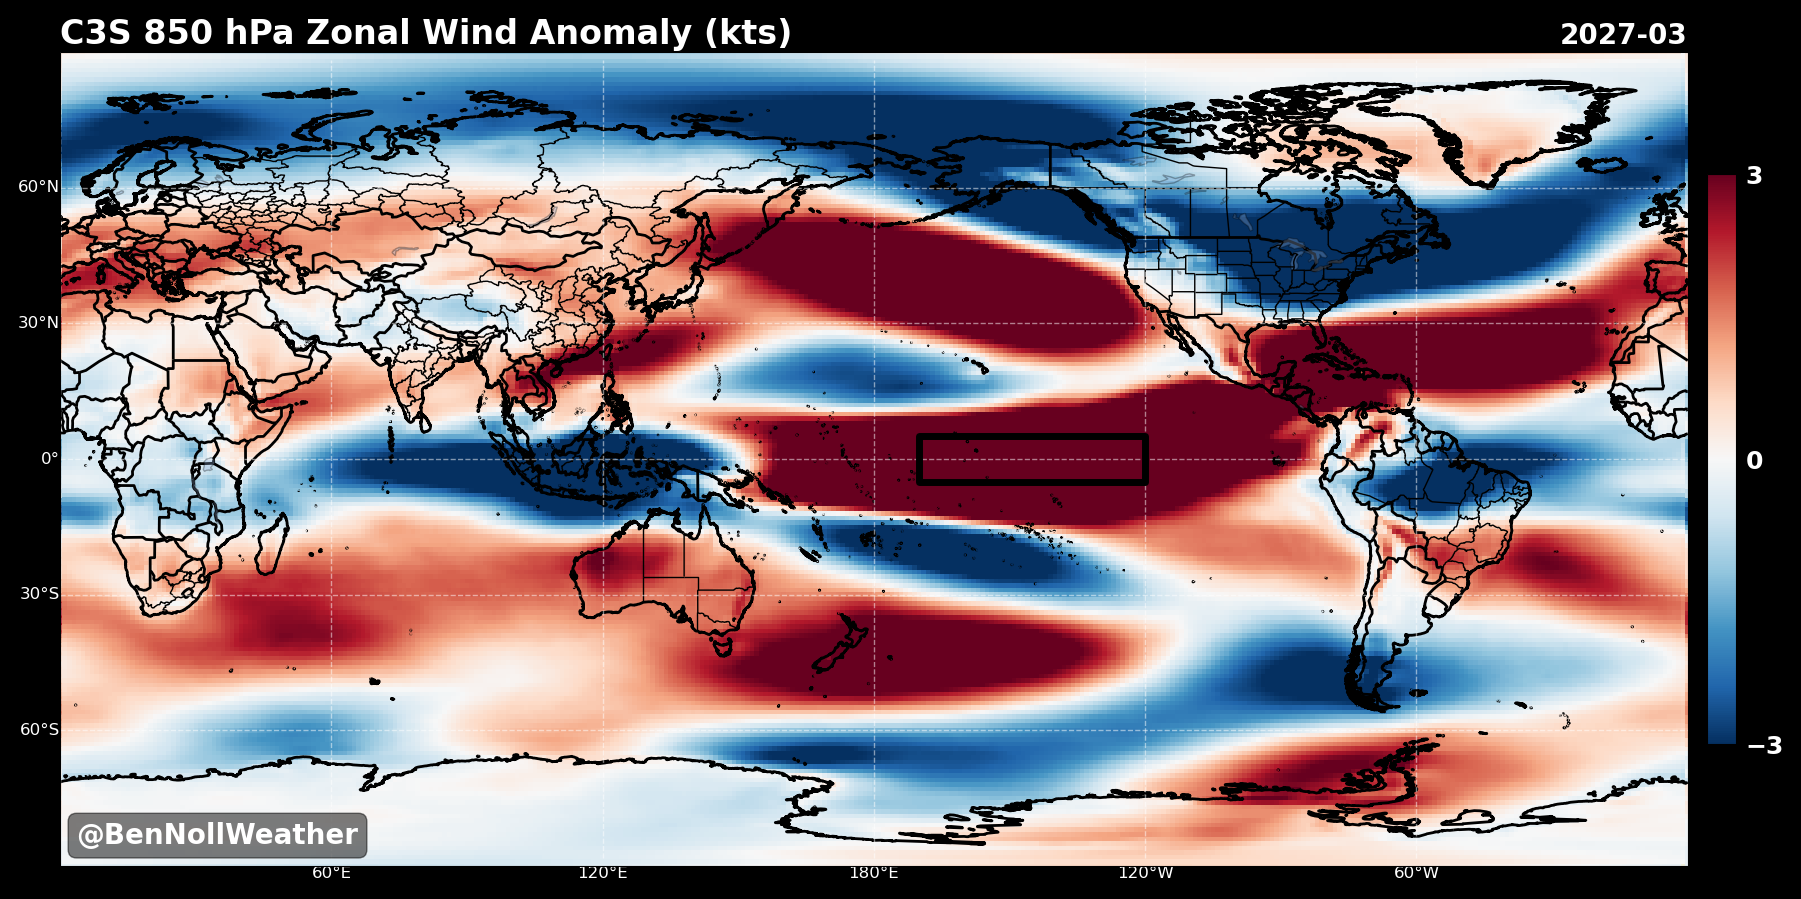
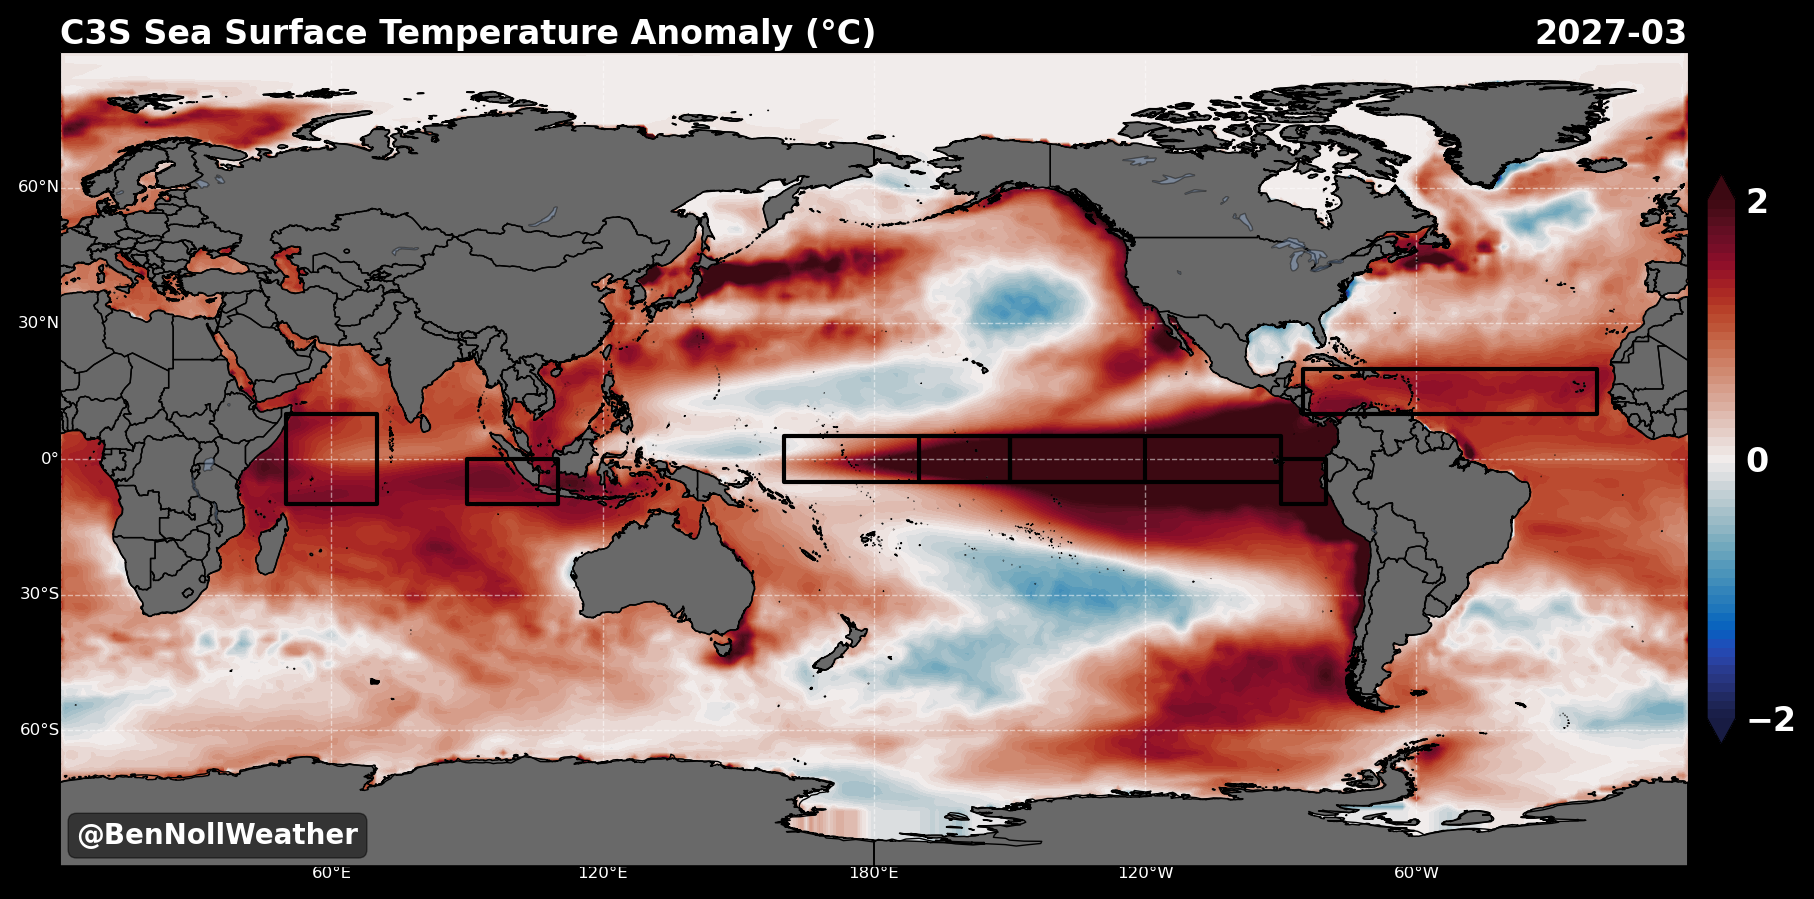
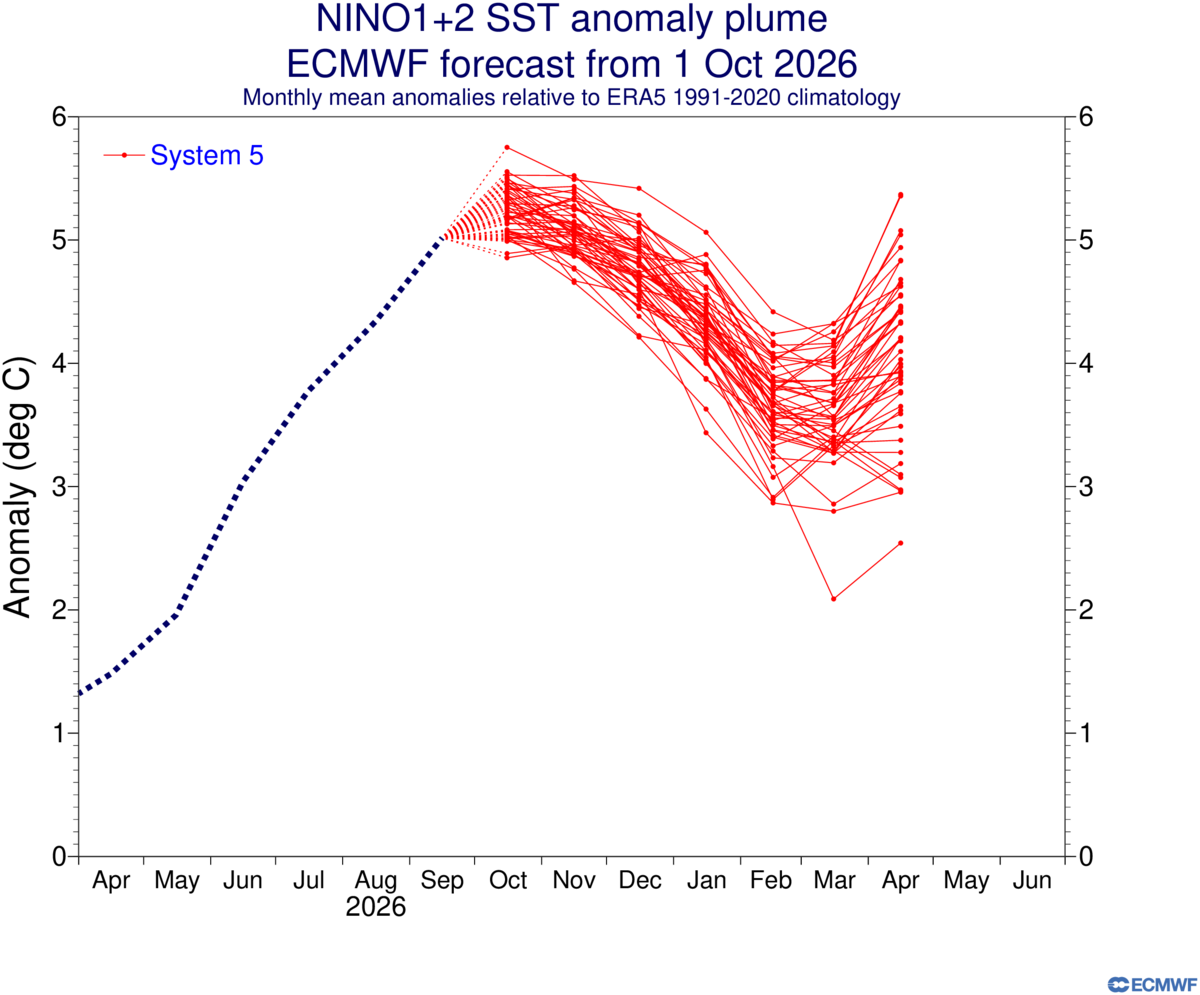
We don’t know the specific details that far out. But the latest Euro continues the record WWBs at least into next March. This is why the model is trying to develop a 2nd Nino 1+2 warming peak near the end of the run like the CFS.
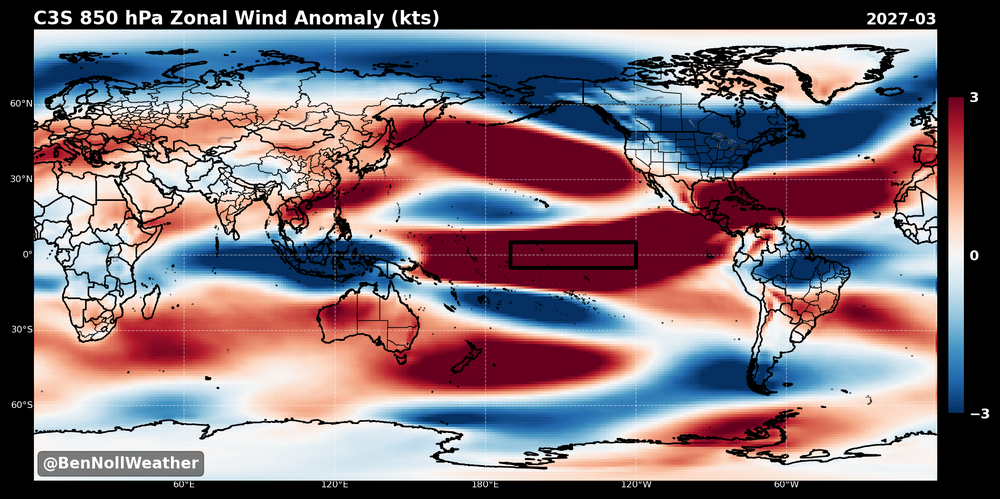
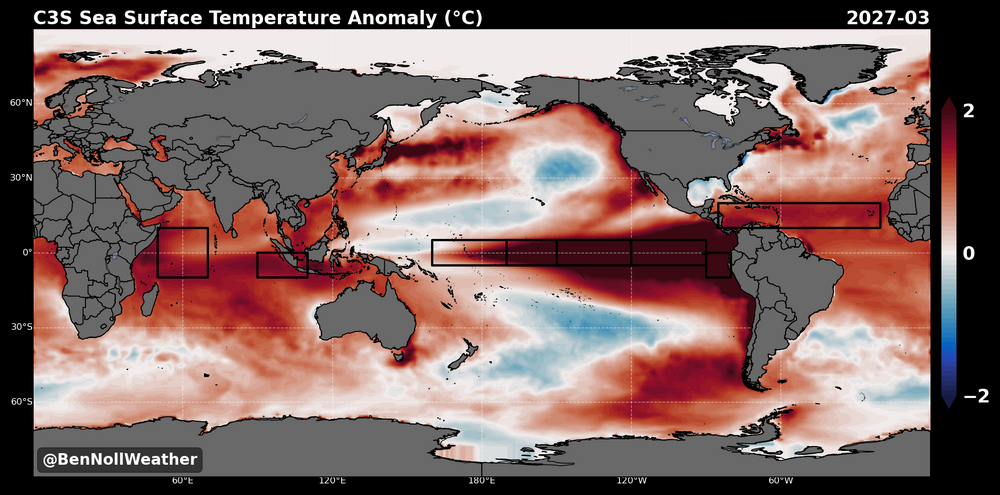
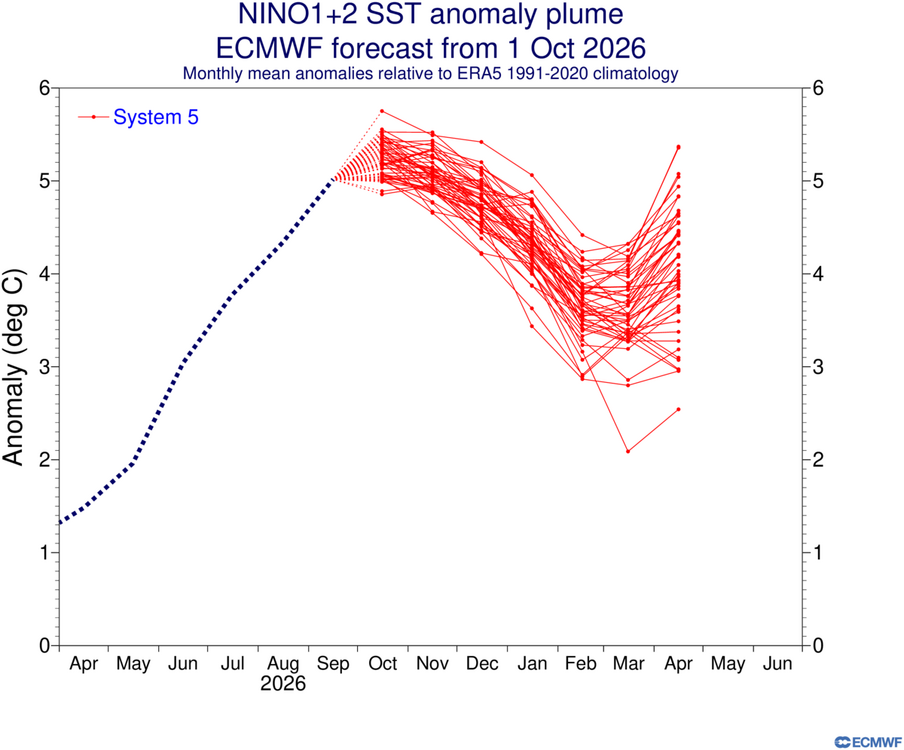
If this happens, then I like 1983 as an analog for next spring summer (as Nino 1+2 really warmed in the spring of 1983), and 1987-88 as an analog for next fall and winter (robust 2nd year el nino that peaked early in the season).
-
 1
1
-
-
Why is there even a flight from Atlanta to Tallahassee? That's within drivable distance.
-
1
-
-
Hurricane Simon Forecast Discussion
Advisory Number: 10
300 PM CST Fri Oct 09 2026000 WTPZ45 KNHC 092046 TCDEP5 Hurricane Simon Discussion Number 10 NWS National Hurricane Center Miami FL EP202026 300 PM CST Fri Oct 09 2026 An intermittent warm spot in the CDO of Simon has been present since this morning, co-located with a small pinhole-like eye noted in visible imagery. The initial intensity of 90 kt is based primarily on the latest TAFB Dvorak fix, though this is very uncertain due to the very small size of Simon and intensity estimates range from around 65 kt (DMINT) to 97 KT (RCM-1 SAR). The SAR data this morning indicated the system has an RMW near 5 n mi, highlighting how small it is. Simon has continued to strengthen today, although at a slightly slower rate since this morning. Further rapid intensification is still anticipated but the exact timing of when the rate might pick up again is highly uncertain. Small hurricanes like Simon are particularly susceptible to large and rapid fluctuations in intensity. In the short term, no changes of note were made to the NHC intensity forecast, which remains at the high end of the guidance envelope. The main challenge with this forecast is how sensitive it is to the exact track Simon takes over the next 2 days and whether or not it moves inland over the Mexican states of Colima and Jalisco. A track slightly east of the NHC official forecast track will cause Simon to quickly dissipate and minimize the threat of wind impacts farther north in Mexico. However, a track just to the west would likely allow Simon to move much farther north as a hurricane. At this time, the difference between these track scenarios is less than the average error of NHC forecasts. Most of the deterministic global models shifted slightly east this cycle, but ensemble guidance indicates both scenarios are still plausible. The NHC track and intensity forecast therefore is largely unchanged and continues to show Simon tracking farther north than it might realistically make it to emphasize that risk. Key Messages: 1. Catastrophic wind and life-threatening storm surge impacts are likely along a portion of the west-central coast of Mexico, and a Hurricane warning is in effect from Punta San Telmo to Punta Mita. Preparations to protect life and property should be completed by late today. 2. Heavy rainfall associated with Simon will impact portions of southwestern Mexico through this weekend. This rainfall will produce life-threatening flooding and mudslides, especially in areas of steep terrain. 3. Swells will affect portions of the southwestern and west-central coast of Mexico through the weekend. These swells are likely to cause life-threatening surf and rip current conditions. Please consult products from your local weather office. FORECAST POSITIONS AND MAX WINDS INIT 09/2100Z 16.2N 104.7W 90 KT 105 MPH 12H 10/0600Z 16.6N 104.9W 110 KT 125 MPH 24H 10/1800Z 17.5N 105.0W 125 KT 145 MPH 36H 11/0600Z 18.6N 105.1W 115 KT 130 MPH 48H 11/1800Z 20.0N 105.3W 95 KT 110 MPH...INLAND 60H 12/0600Z 21.4N 105.5W 75 KT 85 MPH...OVER WATER 72H 12/1800Z 22.8N 105.8W 60 KT 70 MPH...INLAND 96H 13/1800Z 24.6N 106.4W 30 KT 35 MPH...POST-TROP/INLAND 120H 14/1800Z...DISSIPATED $$ Forecaster D. Zelinsky
-
Imelda getting retired, but not Idalia, doesn't make sense though:
Imelda: Cat 1 (90 mph), 3 fatalities, 2 injuries, $10 million damage
Idalia: Cat 4 (145 mph), 12 fatalites (8 direct/4 indirect), $3.5 billion damage
Idalia was the stronger hurricane, caused more damage, and had more casulties. If Imelda was retired, Idalia should have been as well.
-
1
-
-
Of those storms, Lili is probably the best match/analog, as that happened during a high shear/low activity/el nino year. Opal and Dennis happened in low shear/hyperactive years, so they aren't really good matches.
-
27 minutes ago, NorthHillsWx said:
As for the football “controversy” noted, the earlier arrival time brings the worst weather in Alabama and Mississippi through before the games. That being said, I could see significant wind damage in Tuscaloosa tomorrow morning and the chance for widespread power outages. While weather during that game will be fine, the damage done prior would be my concern. 50-60 mph gusts will probably occur with the remnant eyewall wherever that ends up and combined with wet soils that should be pretty damaging. The games in Georgia and Carolina’s will be wet with severe weather and lightning causing possible delays. Given the magnitude of the game in Tuscaloosa and amount of people there it would probably be wise to maybe close the lots until 2 pm or something to keep people from trying to tailgate or drive during the worst weather when trees could potentially come down
If we care about safety, there should be no games in this area on Saturday. Forget the $$$, common sense and safety should come first. These games can be played on Sunday or even Monday.
Sandy made landfall on Monday (10/29/2012), and I didn't leave to go anywhere until Wednesday (10/31).
-
1
-
E PA/NJ/DE Autumn 2026 Obs/Discussion
in Philadelphia Region
Posted
Yes, 2 years ago, it didn't rain during the entire month of October.