

dallen7908
-
Posts
921 -
Joined
-
Last visited
Content Type
Profiles
Blogs
Forums
American Weather
Media Demo
Store
Gallery
Posts posted by dallen7908
-
-
https://journals.ametsoc.org/view/journals/bams/101/6/bamsD190014.xml
ok, only tangentially related, but if you're in the mood to read about some real cold - and Laura Ingalls Wilder - check out the link.
-
 4
4
-
-
https://www.cpc.ncep.noaa.gov/products/predictions/610day/fxus06.html
The amplified mid-level pattern leads to a generally confident precipitation
forecast, with better model agreement compared to yesterday regarding a more
suppressed storm track in the East. Therefore, the highest chances for
above-normal precipitation are highlighted across the Gulf Coast and coastal
Southeast. However, given the cold air in place, there is some concern for
wintry weather over some of these areas, as evidenced by the deterministic 12z
GFS and ECMWF.
-
2
-
-
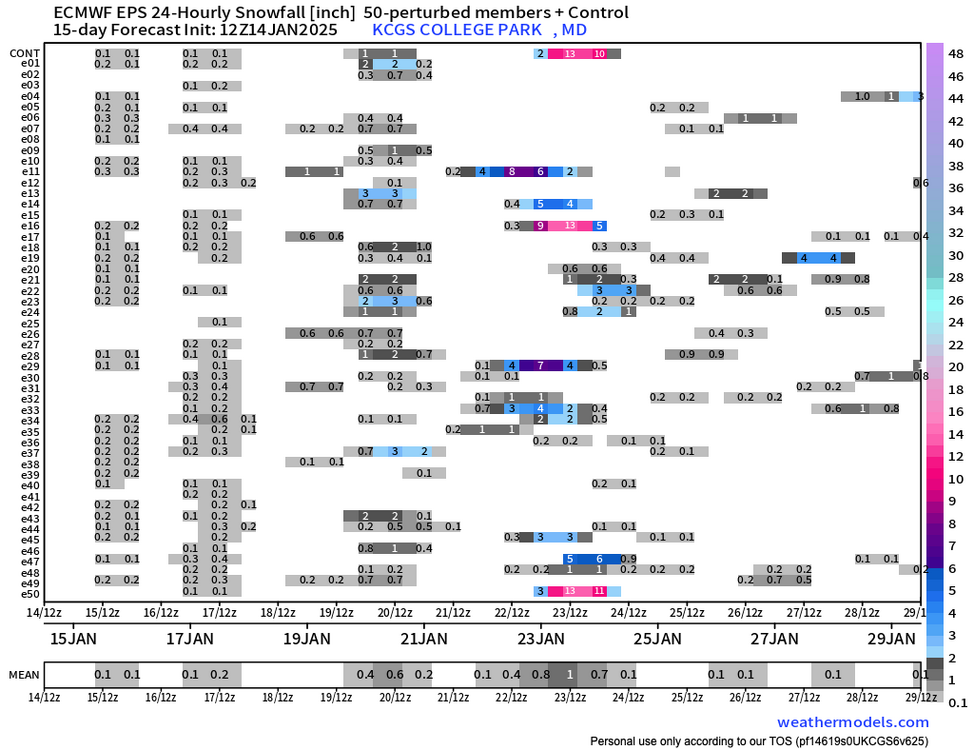
The control and 3 or 4 other members also show a MECS around the 23rd - so it's not just resolution driving the large snow amounts.
-
3
-
-
If summing, remember to divide by 2 as these are 24-hour precipitation values for six-hour periods with every other one shown.

-
2 hours ago, psuhoffman said:
They forecasted almost exactly what happened. There were a few localized spots in MD that jacked and got a few inches over the range but overall they nailed it. And there was a statement out specifying 2” per hour rates during rush hour! People made really bad decisions and then looked for someone else to blame “why didn’t you stop me” which isn’t uncommon unfortunately
I was in Seattle for the AMS meeting that week and recall that one of the lead CWG writers missed at least a half-day of the meeting because of the storm.
-
45 minutes ago, Terpeast said:
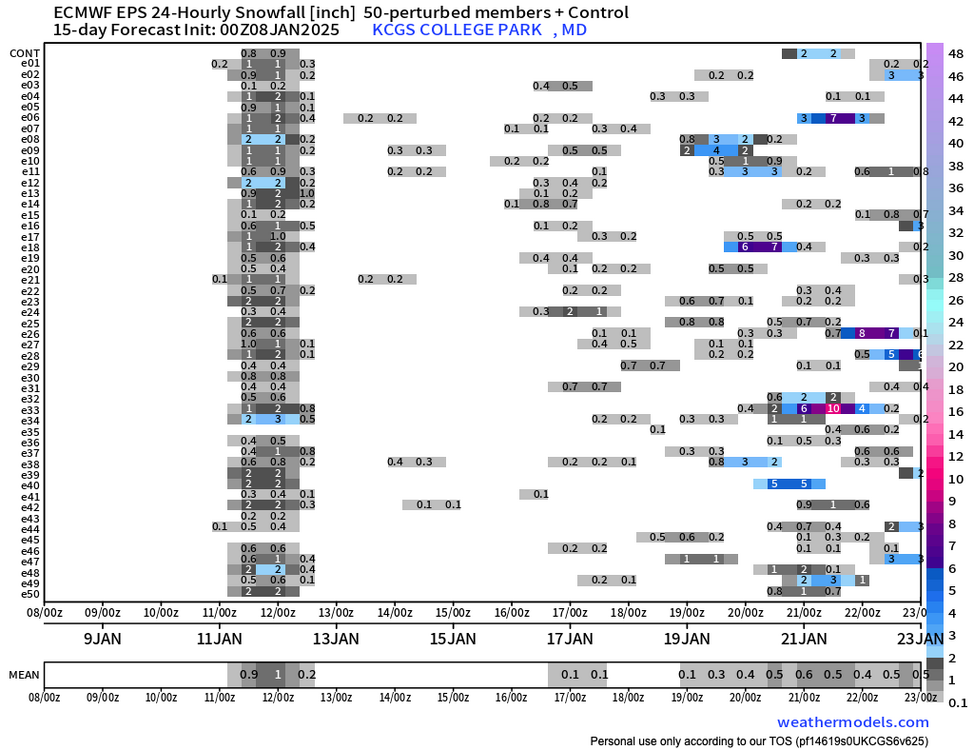
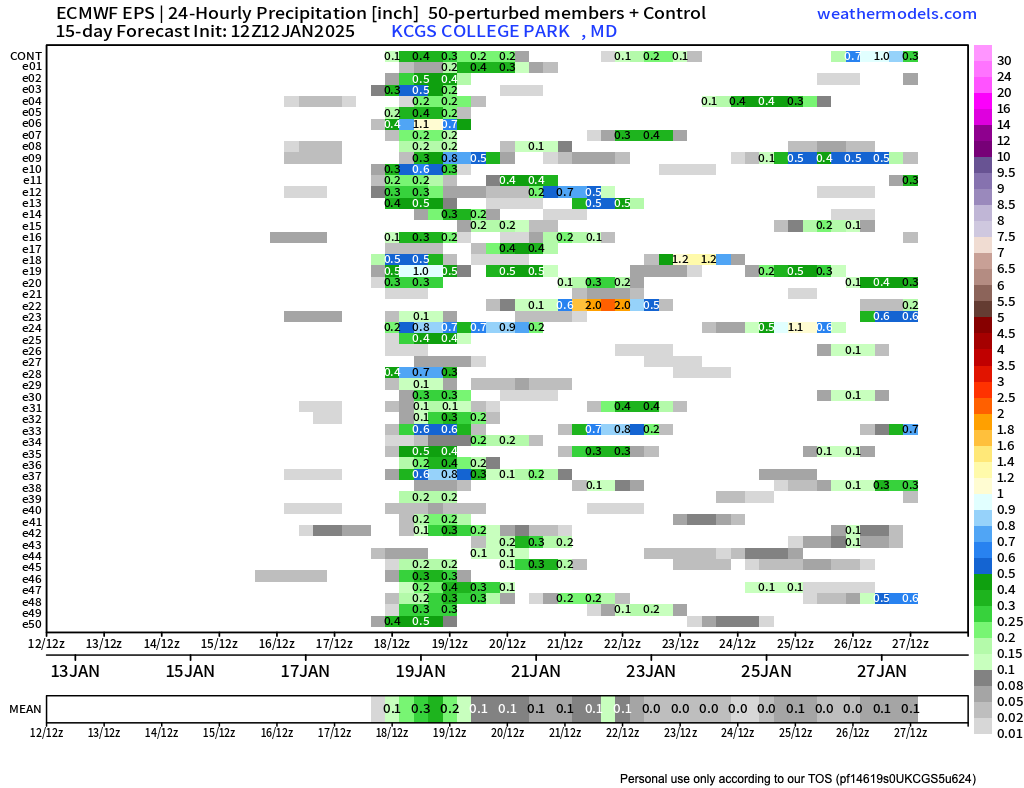
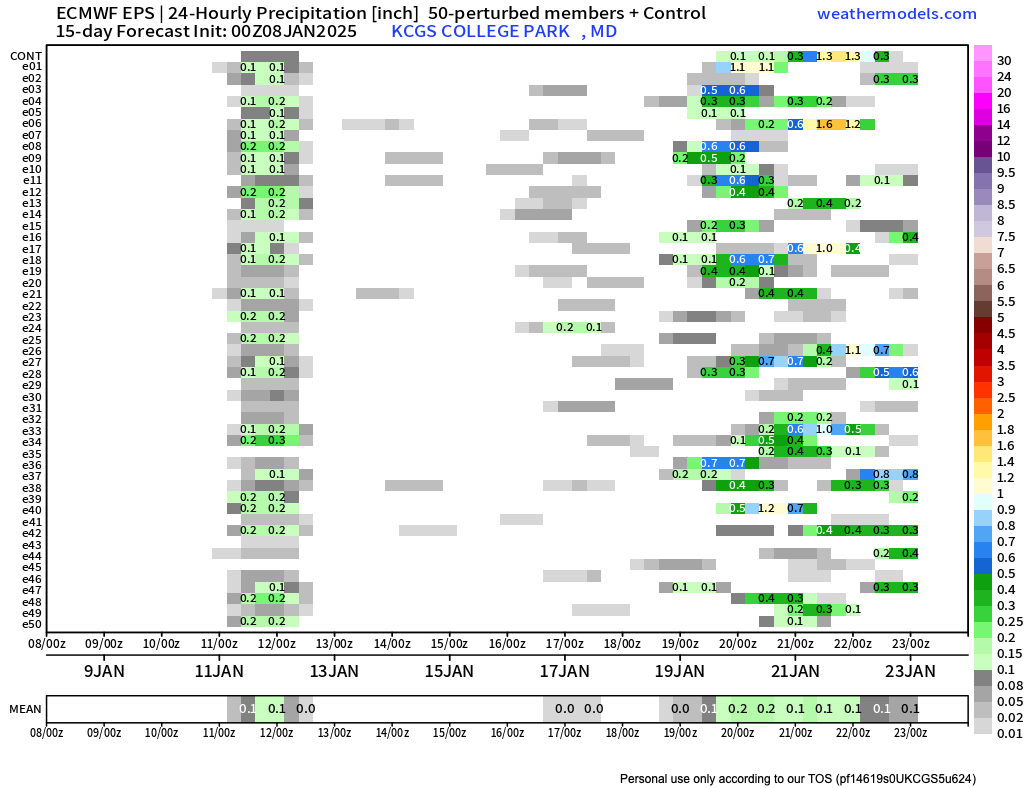
0z eps has a threat window around jan 20
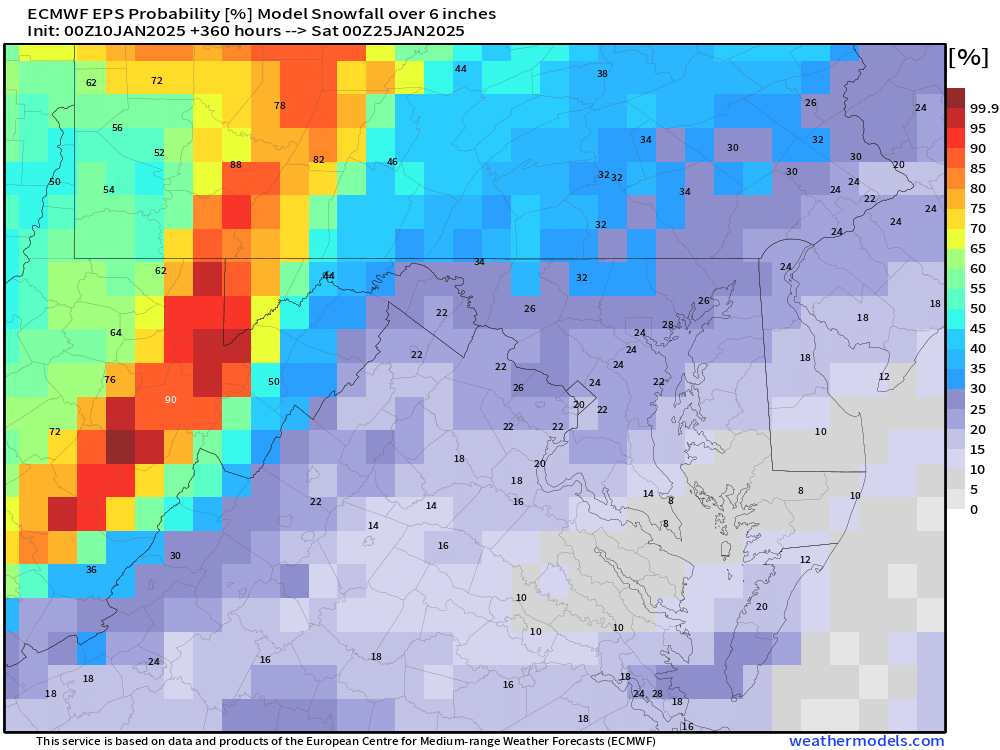
Correct, my statement was misleading. There are indeed two threat windows. The 6" threshold is only reached after the second.
-
Big game hunters should be excited about this map -Unfortunately, the best "threat" appears to be days 13-15 - see Bob Chill's caution about the decrease in predictability as we shift away from a blocking regime. Also, the 8-14 day outlook shows a confidence level of only 2 of 5 for the period.
-
3
-
-
5 minutes ago, RDM said:
The coldest I've ever experienced in my 63+ years is -38F - in N. Dakota. Everyone carried two sets of car keys because they had to leave their cars running when going somewhere or they'd never get them to start again in the cold. Was normal to see a parking lot full of cars and trucks running while everyone had dinner. Temperatures that cold do strange things to metal and mechanical machinery. We were lucky our Beechcraft started again when it was time to depart, after thawing out with a preheater for several hours. Don't ever care to repeat it.
Growing up in Ohio, one year we didn't get above freezing the entire month of Jan. (don't remember the year, think it was Jan 77 when DC got hit hard). The frost line went down 5 feet that year, which cracked foundations and caused mayhem with water mains. One of the worse jobs I've ever witnessed was those poor guys down in the bottom of trenches repairing busted water mains in -20+F weather. They had to thaw the frozen ground with blow torches and slowly skim away the thawed ground with backhoes and jackhammers to reach the busted pipes. Will never forget the look on their faces...
I grew up about 40 miles northeast of Waterloo. 1977 was the coolest January in the history of Waterloo, Iowa. The average daily high temperature was 11.7 °F, and the average low was -11.9 °F.
-
1
-
-
-
EPS Signal for the 20th - 22nd is still pretty weak. Note: Numbers show 24-hour snow fall totals for every other six-hour period Coloring shows 24-hour snow fall totals every six-hours.
-
3
-
-
Certainly fun searching for the yard stick.
-
1
-
-
6 minutes ago, WxUSAF said:
CWG bumped totals to 6-10” for most. 4-8” for M/D line crew and south of Stafford Va to St Mary’s MD.
Is it just me or have the CWG write ups been "dumbed down" since last year?
-
12 minutes ago, D-Train said:
Is the storm coming in quicker than originally forecast? NWS updated their timing and it looks like 3-4 hours earlier than what they had shown yesterday. Would appreciate the insight - we have events that go until 7pm tonight in Dulles and it will be right on the edge of the beginning of snow, based on the latest maps.
Both the 06 UTC GFS and ECWMF have the snow reaching DC by 11 PM but warm-advection snow often starts an hour or so before forecast. ... but go with the NWS as they look at more information than the above.
-
College Park area also flirting ...
-
Stolen from an add by Startorialist "Cheers to a new year, and a new orbit! This year, earth reached perihelion — our closest approach to the Sun — on January 4th at 8:22:32 AM EST."
Wonder how that will affect this weekend's storm!
-
1 hour ago, WVclimo said:
DC with greater than a 50% chance of 8”+


Wow, DC the favored low-land contender - I'm not sure I've seen that before. Is this a bias-adjusted best estimate of the chance or the percent of ensemble members giving 8 or more inches
-
Very dark and flizzardy here. Good time for a walk.
-
Yes, the anomaly correlation score tells us that the UKMET, GFS, and CMC do a comparable job with the prognostic variables but one could argue that the method of determining the diagnostic variables is more accurate with the GFS.
-
Depending on location, 20-30% of EPS members give MD (west of the Bay and east of the mountains) 3" or more of snow/sleet during the day 10-15 window
-
6
-
-
Ice pellets here a bit of freezing rain mixing in 29 degrees
-
https://www.cpc.ncep.noaa.gov/products/predictions/WK34/
Below normal but dry?
-
We now share the seasonal Maryland Climate Bulletin for fall 2024You can access the Bulletin from the following link:Points to highlight are:1) Fall 2024 was warmer and drier than normal (i.e., 1991-2020 averages) in Maryland (statewide), with warmer and drier than normal September, October, and November. Seasonally, the state has remained warmer than normal since the fall of 2023 and drier than normal since last summer.2) The mean temperature was warmer than normal everywhere in the state, particularly over Garrett County (up to 2.8°F), and Prince George’s, Anne Arundel, Charles, Calvert, Saint Mary’s, Kent, Queen Anne’s, Talbot, and western Dorchester counties (2.0‒2.4°F). Precipitation was below normal over the whole state, particularly over Cecil County and portions of Harford, Kent, Queen Anne’s, and Wicomico counties (8 inches deficit), and counties of the Coastal Plains on both sides of the Bay (6−7 inches deficit). The regions with maximum deficit had around 25−30% of their climatological fall precipitation, while those on both sides of the Bay received no more than 50%. Western Maryland over Allegany and Garrett counties received 55‒85% of their climatological precipitation.3) The partial water year 2025 (October − November 2024) started below normal over the entire state, especially over eastern Wicomico and northern Worcester counties (5.5 inches deficit), northern Harford and Cecil counties (5 inches deficit), and counties of the Piedmont and Coastal Plains (4‒4.5 inches deficit). Among these regions, the southern Eastern Shore had 25‒30% of their climatological water amount, and the rest had between 35 and 40% of theirs.4) Mean temperatures showed that fall 2024 was the eleventh warmest fall statewide and among the ten warmest in 14 counties. It was the fifth warmest fall for Calvert, Charles, Garrett, Prince George’s, and Saint Mary’s counties.5) Precipitation indicated that fall 2024 was the sixth driest fall statewide and among the ten driest for 17 counties. It was the fifth driest fall for Washington County, the fourth for Dorchester and Harford counties, the third driest for Somerset, Wicomico, and Worcester, the second driest for Caroline and Queen Anne’s counties, and the driest for Cecil and Kent counties.
-
1
-
 1
1
-
-
I believe you're thinking of Christmas Eve 2022 when the high was 20 but it felt much colder. The last Arctic outbreak I can remember was January 5 and 6th of 2018 when the high temperature failed to reach 20 in Baltimore. The last day with a sub-10 high was January 19 of 1994 when the high was 5. The lowest high ever (3 F) occurred on February 10, 1899 during "the greatest Arctic outbreak in history" according to David Ludlum. Temperatures fell to 0 F along the beaches of the Gulf Coast and ice flowed from the mouth of the Mississippi River into the Gulf ...
-
Here is November's climate bulletin from Alfredo. Will December be our first below-normal temperature month in over a year?
Good afternoon,
We now share the Maryland Climate Bulletin for November 2024.You can access the November Bulletin from the following link:Points to highlight are:1) Statewide averages show this month was warmer and drier than normal again. This is the twelfth consecutive month with warmer-than-normal temperatures and the seventh month drier than normal since April.
2) Regionally speaking, the mean temperature was warmer than normal over all the state, especially over Prince George’s, western Charles, southern Anne Arundel, northern Calvert, and western Talbot counties (4.8°F), and in general over the counties to the west of the Bay and central Eastern Shore and Garrett County (above 3.9°F). Precipitation was below normal in much of the state, especially over Frederick, Washington, eastern Allegany, eastern Caroline, Dorchester, Wicomico, and northern Worcester counties (1.4 to 1.6 inches deficit). These counties received between 45 and 55% of their climatological rainfall for the month, while the rest of the counties around the Bay didn’t get more than 60−70% of their climatological rainfall. Above-normal precipitation was observed over Garrett County only (1.2 inches maximum), accounting for 10−40% more than its climatological precipitation.
3) Drought conditions covered the whole state at the end of November. While extreme drought conditions over Garrett County at the end of October changed to severe, extreme drought conditions appeared over southern Cecil, eastern Kent, Queen Anne’s, the northern tip of Caroline, Wicomico, eastern Somerset, and western Worcester counties. Moderate to severe drought conditions covered around 91% of the state. Streams and rivers had below-normal streamflow in the severe to extreme drought areas along both sides of the Bay; above-normal streamflow was observed only over Garrett County streams.
4) Statewide minimum daily temperatures indicated that the number of freezing days with temperatures below 32, 28, and 24°F and their number of freezing spells (consecutive days with freezing days) were fewer than normal by the end of November for the calendar year. Most of the freezing days are found in January, February, and March, though.5) Statewide daily total precipitation showed that the number of dry spells (consecutive days with daily precipitation of no more than 0.04 inches) was less than normal by 10 dry spells (34 vs. 44) by the end of the month. However, the mean duration of the dry spells was larger than normal by 1 day (6 vs. 5), and the longest duration of the spells was larger than normal by 17 days (34 vs. 17); the longest dry spell started October 8.
6) Statewide mean, maximum, and minimum temperatures in November (50.2, 60.8, 39.5°F) were above their long-term (1895-2023) mean but far from their historical records of 51.7, 63.1, and 43.6°F set in 1985, 2001 and 1985, respectively. However, the three temperatures were within 10% of the highest recorded values. Statewide precipitation (2.08 inches) was below the long-term mean but far from the record of 0.60 inches in 1917.7) Statewide mean temperatures and precipitation indicated that November was the eighth hottest month on record, and it was among the ten hottest for 14 counties; this month was the forty-fourth driest statewide. This month was the fifth hottest for Charles County, the fourth for Talbot County, the third for Anne Arundel, Calvert, and Saint Mary’s counties, and the second hottest for Prince George’s County.
The bulletin is issued once per month and shows the state's recent monthly surface temperature and precipitation conditions in a simple format, helping Marylanders better understand regional climate variations.
Please help disseminate this bulletin.
Thanks,Alfredo-
2
-


January Banter 2025
in Mid Atlantic
Posted