

dallen7908
-
Posts
921 -
Joined
-
Last visited
Content Type
Profiles
Blogs
Forums
American Weather
Media Demo
Store
Gallery
Posts posted by dallen7908
-
-
4 minutes ago, Eskimo Joe said:
DCA reporting -SN. College Parks latest METAR w/ 5SM visiblity would imply -SN as well but that station may not have a precip identification sensor.
Yes it shifted from sleet to light snow about 10 minutes ago. 32.9 degrees
-
 1
1
-
-
Been sleeting in College Park for the last 5-10 minutes
-
Slowly rising surface temperature here. 29.7 at 6:40, 30.6 at 7:30, and now 31.5F
-
Euro 6z:
Verbatim (without looking at the soundings), Similar or very slight worse than 00 UT, for DC it shows snow beginning between 11 AM and noon changing to mixed precipitation between 2 and 3, surface temperature of 34 degrees.
Snow maximum still in central PA - just under 2 feet
-
In case anyone is wondering GDPS on the pivotal weather plot is the acronym for the operational "Canadian" model.
-
 3
3
-
-
4 minutes ago, DTWXRISK said:
One of the reasons why we have ENSEMBLES Is to check the validity of the operational or deterministic models. In this case the operational 12z GFS is completely flat with only a little bit of precip in Southeast Virginia on the 12Z run. But as I'm sure you have all seen by now the 12ZGFS ensemble looks exactly like 0z and 6z European runs....
This should be a big clue for everybody that the operational GFS for whatever reason is still completely clueless when it comes to this system on Monday. The differences between the 12z GEFS and the operational GFS is simply staggering at 48 hours before the event.
Are the ensembles still based off of the old GFS? If yes, it's less staggering
-
For comparison purposes here is the EPS panel, superficially they look similar ... although SE ridge is much stronger here - 50 N low too far east to help us?
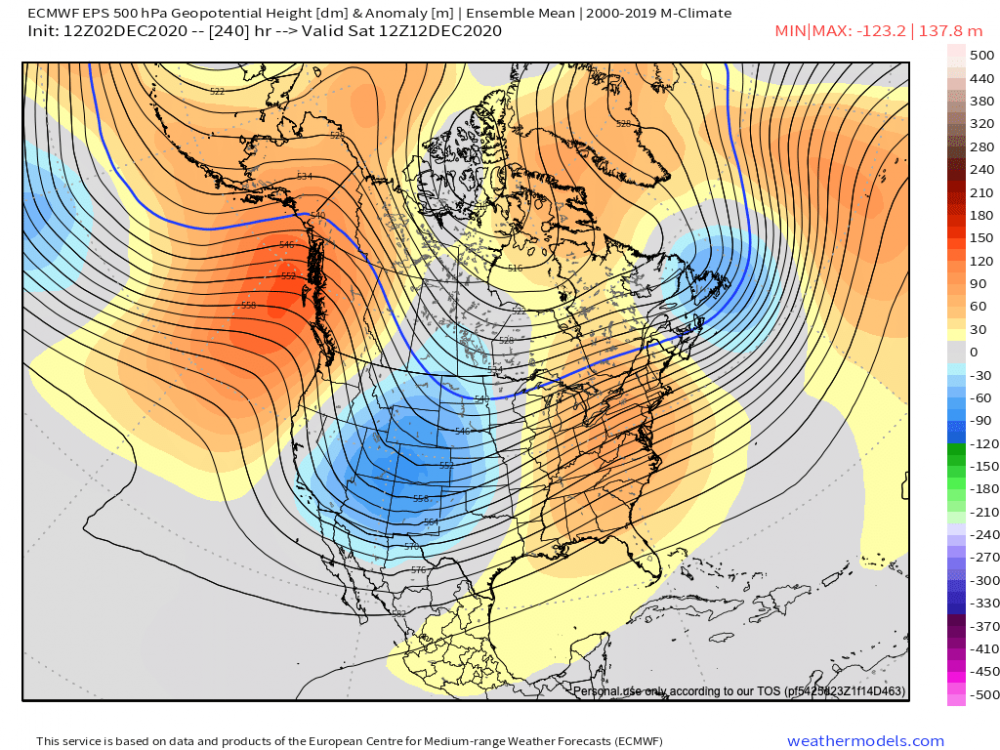
-
How about this ... the EPS shows a positive EPO for much of this period while the CPC 3-4 week outlook gives us a > 60% chance of above normal temperatures as La Nina reasserts itself.
-
Based on my limited knowledge of this ...
Warmings have strong correlation with winter temperatures in Europe; not so much in the northeastern U.S.. We'll have to wait and see. In any case, probably not much of a factor until mid-December
-
Saint Martin's summer; would use the more familiar Indian summer - if my back yard had experienced a freeze
-
1
-
-
The NWS forecast discussions out of Sterling are about to get more interesting - for snow lovers
-
From the NWS discussion:

Day    IAD high/high min BWI high/high min DCA high/high min
11/8:  77(1987)/57(1977) 80(1975)/62(1975) 81(1975)/63(1975)
11/9:  78(1994)/56(1987) 78(1994)/61(1945) 79(1994)/64(1895)
11/10: 75(1985)/60(1966) 75(1999)/62(1966) 76(1999)/60(1975)
11/11: 78(2006)/55(2002) 77(2006)/59(1970) 78(1949)/58(1970)
-
https://frontierweather.dtn.com/WinterClimateDrivers.pdf
Just in case you need background as to what a rising QBO value MAY mean for our winter weather.
-
1
-
-

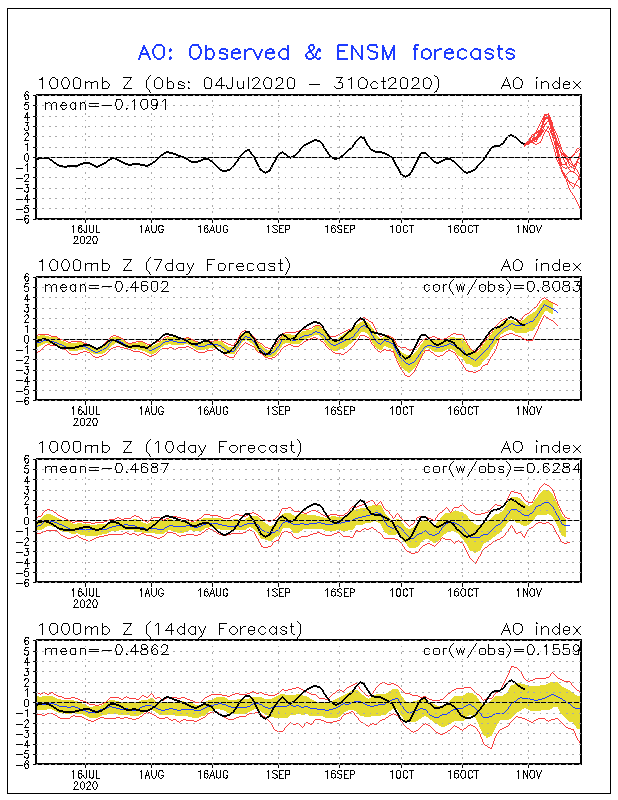
The high-bias in the forecast values reminds me of last winter. Could the bias be due to a poor coupling between the ocean model and the atmospheric model?
On the positive side, the high-bias may allow some fantasy storms to come up the coast. On the negative side, reality will be much more mundane.
Not that the AO forecast has much to say about it but I'm rooting for a warm November. My hunch is that the correlation between November temperatures and winter temperatures is negative - perhaps -0.02. I'll take any advantage I can get.
A depressing truth; the "smartest" forecast might be to use the ensemble with the most positive AO value.
Another depressing feature of the time series is that it goes negative about when the forecast skill goes to zero or at least to 0.16^2.
-
4.9" in my College Park rain gauge. Several neighbors are wet-vacuuming their cars - glad ours was up on our driveway
-
1
-
-
"The ensemble forecast combines models unconditional on particular interventions being in place with those conditional on certain social distancing measures continuing. To ensure consistency, only models with 4 week-ahead forecasts ahead are included in the ensemble."
-
UKMET not as optimistic as GGEM wrt snow chances
-
Thanks for the ensembles. Perhaps going forward continue ending them at 18Z 31 March.
Would be interesting to see if any of the perturbed members are more skillful. Of course, this would not be possible to determine this year when the least snowiest is almost always if not always the most accurate.
-
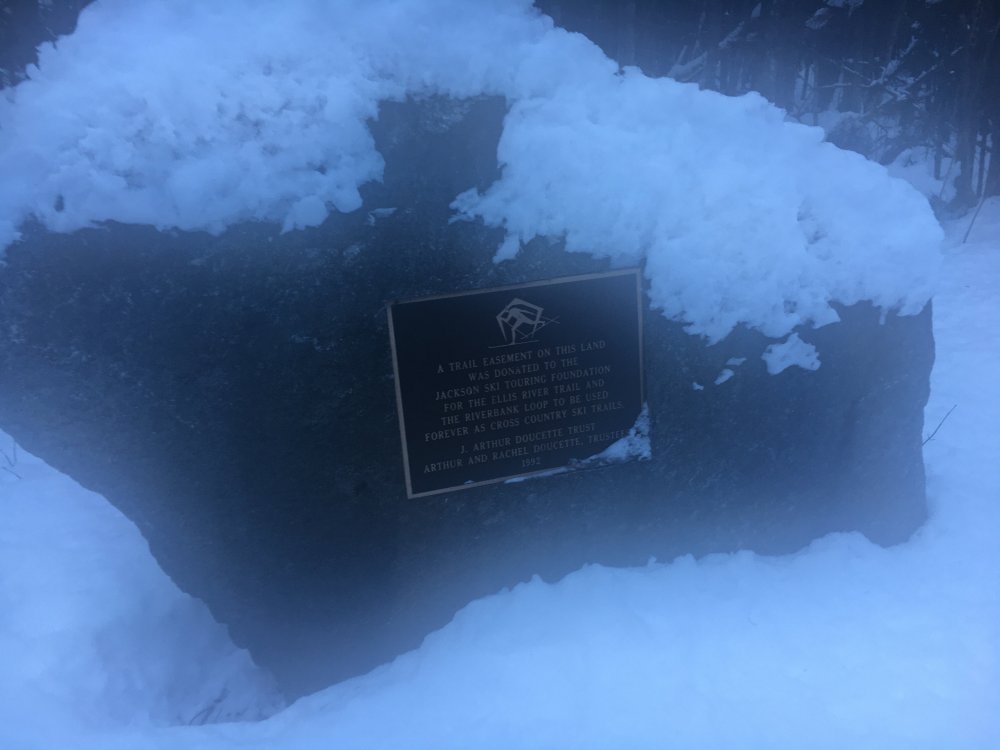
The climate change tangent got me thinking of nordic skiing and a sign I saw this past January.
Hopefully "forever" won't end sooner than the Doucettes' hope
-
 1
1
-
-
Low 40s and rain unless you head to Canaan Valley or Garrett County where accumulations of up to 6" are possible for the system according to the UMKMET through Saturday morning
-
1
-
-
1 hour ago, WinterWxLuvr said:
If you look at those maps, there is a 100% chance that I will see at least 1/2” of snow during the period. Anybody think a 100% probability is reasonable or descriptive of anything weather related?
Strictly speaking the maps give the percent of ensemble members showing at least a certain amount of snow/sleet. They are a tool not a forecast.
-
I'm heading to Colorado next week for a meeting followed by my third snow chase of the winter. My first two were North Conway, NH and Davis, WV. Any suggestions as to a good place to XC ski in the mountains west of the Denver/Boulder area?
-
Yes 3 of the 21 06 UT GEFS members give the DC area winter storm warning conditions just one week from today! None of the other members give us any snow during that time frame. Go big or go home.
Correction: one additional member gives us a trace next Thursday
-
The official published National Weather Service (NWS) Cooperative Weather/Climate station on Canaan Valley's floor (3,254 ft.) has only reported 55.1 inches of snow for the 2019-20 winter through February 25, 2020. This is one of the lowest snowfall totals to that date in the Valley's 76-year snowfall record (began 1944-45). The 7-inch maximum depth recorded so far this winter is also currently the lowest maximum winter snow depth ever recorded in any winter!
https://whitegrass.com/wp-content/uploads/2020/02/fearlessfeb26.txt-
1
-


December 16-17, 2020 Winter Storm Obs/Nowcasting
in Mid Atlantic
Posted
Finished? with 0.7" here in College Park - changed from snow to sleet to rain within the last hour. Surface temperature 32.4