

ORH_wxman
-
Posts
90,904 -
Joined
-
Last visited
Content Type
Profiles
Blogs
Forums
American Weather
Media Demo
Store
Gallery
Everything posted by ORH_wxman
-
Perhaps a Coastal Storm on March 2nd for SNE????
ORH_wxman replied to USCAPEWEATHERAF's topic in New England
That euro solution is pretty intense...awesome midlevels closing off and that would probably produce some awesome banding...so in a solution like that you don't want to get too obsessed with the QPF...could be some big totals on the northwest side of the tightest gradient. -
Perhaps a Coastal Storm on March 2nd for SNE????
ORH_wxman replied to USCAPEWEATHERAF's topic in New England
Wow huge hit. Esp for E areas. -
Perhaps a Coastal Storm on March 2nd for SNE????
ORH_wxman replied to USCAPEWEATHERAF's topic in New England
Wow. Euro is moving significantly NW of 12z through 42 hours. Snowing heavily into CT and RI by 12z Saturday. -
Perhaps a Coastal Storm on March 2nd for SNE????
ORH_wxman replied to USCAPEWEATHERAF's topic in New England
Through 30h, 18z euro has higher heights out ahead of the shortwave than 12z. This is probably gonna be a higher impact than the 12z run. -
Perhaps a Coastal Storm on March 2nd for SNE????
ORH_wxman replied to USCAPEWEATHERAF's topic in New England
Tried to slide E at the last second but still very good for SE areas. 6"+ from GHG to UUU with 10-12" around the canal. Gets 3" prob back to ORH and TOL. But that was reallly close to being a lot bigger. -
Perhaps a Coastal Storm on March 2nd for SNE????
ORH_wxman replied to USCAPEWEATHERAF's topic in New England
Here comes the 21z rpm now. It's gonna be massive for at least SE MA -
Perhaps a Coastal Storm on March 2nd for SNE????
ORH_wxman replied to USCAPEWEATHERAF's topic in New England
Gonna be warning snows for a good chunk of SNE this run. -
Perhaps a Coastal Storm on March 2nd for SNE????
ORH_wxman replied to USCAPEWEATHERAF's topic in New England
Yep, 18z GFS looks even more zonked than the already big 12z run. -
Perhaps a Coastal Storm on March 2nd for SNE????
ORH_wxman replied to USCAPEWEATHERAF's topic in New England
Looks like the 18z RGEM never ran....so we lose that piece of guidance for this cycle. -
Perhaps a Coastal Storm on March 2nd for SNE????
ORH_wxman replied to USCAPEWEATHERAF's topic in New England
Yeah it was a much better storm....the way it kind of shunted it east after it looked good to the south is kind of weird. I'd feel pretty good if i was down in SE MA or S RI. -
Perhaps a Coastal Storm on March 2nd for SNE????
ORH_wxman replied to USCAPEWEATHERAF's topic in New England
NAM actually has a much better storm and increased QPF down in S NJ and just offshore to there....it just gets kicked east at the last second, but I didn't hate that trend at all. I think more of that would get at least into SE areas than shown there. edit: Scooter kind of beat me to it already....saying the same thing for the most part -
Perhaps a Coastal Storm on March 2nd for SNE????
ORH_wxman replied to USCAPEWEATHERAF's topic in New England
Saturday will be the 14 year anniversary of the SE MA snowbomb on 3/1/05....the messenger special. I remember that one vividly back on WWBB. SE MA def stole my snow in that one....huge convective blob formed over E LI and the ocean just E of it and was heading toward SE MA....SE MA was expected to have some ptype issues (though still get accumulatins snow despite that) while the max would be 495 area to ORH with 8-12 forecast....instead, that convective blob that looked more like an MCS seemed to rob the system of it's usual midlevel circulation and what happened in SE MA was epic....we weren't sure if it was gonna be snow when it hit them.....but then I remember messenger was posting pics of like 100 foot vis, lol. PYM had like 16 inches of snow in 4-5 hours. It was insane. Back up this way, we limped home with like 5-6"....still a decent system, but it was a bust compared to the 8-12 forecast. Might as well do it again for SE MA on the anniversary this Saturday. -
Perhaps a Coastal Storm on March 2nd for SNE????
ORH_wxman replied to USCAPEWEATHERAF's topic in New England
Only place that might get a watch is SE MA....pretty close call there on the 50% chance at warning criteria in next 48 hours by the time we get to the PM shift. Plymouth/Barnstable counties...maybe Bristol and Newport county RI. Prob need another bump to get CT in on that type of confidence and the rest of us in E and C MA. -
Perhaps a Coastal Storm on March 2nd for SNE????
ORH_wxman replied to USCAPEWEATHERAF's topic in New England
Yeah ginxy, EPS were pretty jacked looking on the conventional plots. Didn't see qpf but your maps confirms that qpf matches. -
Perhaps a Coastal Storm on March 2nd for SNE????
ORH_wxman replied to USCAPEWEATHERAF's topic in New England
Cape has some mid-level issues...850 starts tickling above 0C there at the height....PRob want to be west of the Canal for the jack this run. Though its really close... -
Perhaps a Coastal Storm on March 2nd for SNE????
ORH_wxman replied to USCAPEWEATHERAF's topic in New England
Prob advisory snows for SE MA this run (like BOS to PVD and TAN)....not gonna jump right into the water and go big. Classic incremental but significant Euro move. Warning snows close to the canal maybe. Prob gets 2-3" back to 495. A solid move that we wanted to see form Dr. No. -
Perhaps a Coastal Storm on March 2nd for SNE????
ORH_wxman replied to USCAPEWEATHERAF's topic in New England
She's coming NW on the Euro through 36 hours. -
Perhaps a Coastal Storm on March 2nd for SNE????
ORH_wxman replied to USCAPEWEATHERAF's topic in New England
Euro was the first to toss the idea of a cutter for this storm...GFS was still cutting this thing even a couple days ago. -
Perhaps a Coastal Storm on March 2nd for SNE????
ORH_wxman replied to USCAPEWEATHERAF's topic in New England
Def a big improvement over 00z, but not as good as the GFS solution. If the Euro can make a pretty notable jump toward this today, I think we're in business...I wouldn't expect Dr. No to come all the way in one run...but a non-microscopic jump will be telling. I'm guessing it will...the 06z run actually looked decent aloft, but it wasn't really drawing that sfc reflection in toward it as well as the other models we've seen. -
Perhaps a Coastal Storm on March 2nd for SNE????
ORH_wxman replied to USCAPEWEATHERAF's topic in New England
Ukie looks borderline warning for SE MA on the 12z run.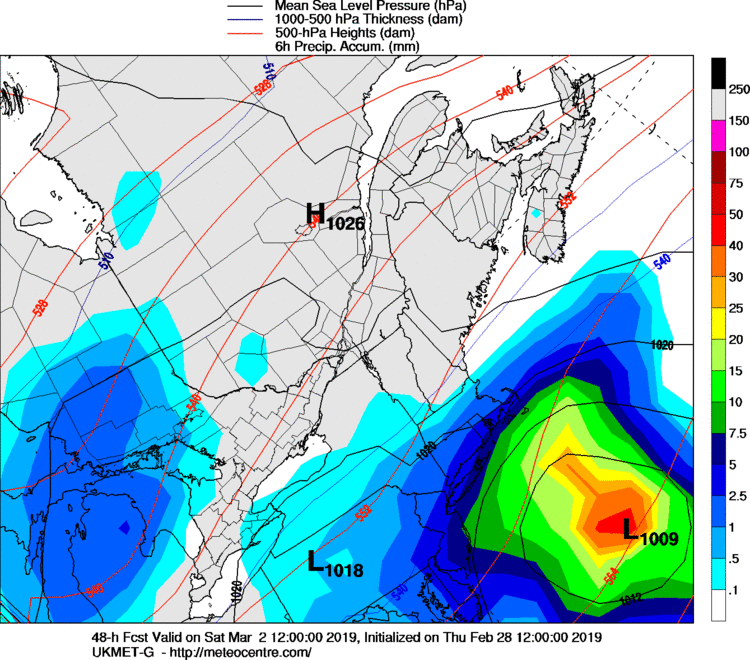
-
Perhaps a Coastal Storm on March 2nd for SNE????
ORH_wxman replied to USCAPEWEATHERAF's topic in New England
GFS has a nice commahead look to it...would probably even be a little better on the northwest side than the qpf maps think. -
Perhaps a Coastal Storm on March 2nd for SNE????
ORH_wxman replied to USCAPEWEATHERAF's topic in New England
Scooter bitching his way to a warning event Saturday?
-
I remember someone had written an overview of the 2013 Arctic melt season and I can't find it now...but either way it showed how much the loss of multiyear ice had changed the Arctic. The 2013 summer was the coldest in the Arctic basin since 1996...but yet we still had a min around 5 million sq km, which was lower than any min pre-2007...despite some really warm years like 2005 or 2002.
-
Yeah the interactive graph uses the 5 day mean....it's updated daily, so its a daily reading, but the data is a 5 day average. The single day reading is actually 4.56 million sq km today. Like I said before, I can't remember if they use that or the 1 day reading as the min...but looking back at past mins, I think they use the 5-day reading that's on the graph. I seem to remember them explaining that the single day jumps can be a bit volatile and produce faux numbers on the margins, so they prefer to smooth it out. JAXA actually does this too but they do it over a 2 day average. We'll know soon enough. Not that there is a big difference...
-
Bluewave, I think you are referencing the 5 day average....the daily on NSIDC did get as low as 4.55 million sq km. I'm actually not 100% sure what NSIDC uses...I think they might actually use the 5 day average as the min if I recall correctly, so your number might be more "official".
