

ORH_wxman
-
Posts
93,092 -
Joined
-
Last visited
Content Type
Profiles
Blogs
Forums
American Weather
Media Demo
Store
Gallery
Everything posted by ORH_wxman
-
Area already takes into account lower concentration. So if the pack is very fragmented, we will get lower area readings. I don't see any clear evidence why we should treat area as different than we normally do. This year is already quite low on area, so it isn't like area is showing something drastically different than what we'd expect given the very warm conditions thus far. If we get very hostile weather from here on out, we could still see a new record low this year. Right now, I'd bet against it, and settle on something in the top 3 or 4 instead. But there is still time for things to change.
-
The thing is....NSIDC area is measured by SSMI/S and that particular satellite gets "tricked" by melt ponds into thinking it is water. It's been measuring like this for decades so we have a consistent database. So if we are a few hundred thousand sq km behind 2012 on this measurement, it's likely because we have less melt ponding than that year. Since melt ponding in June is the best predictor of final extent/area, we closely monitor the SSMI/S area numbers.
-
Area is basically in a dead heat with 2016 right now. We'll see if it can pull ahead before the end of the month. Extent is harder to predict. It's a lot easier to predict final area. Extent obviously has the nuances of compaction...take 2015 vs 2010 for example. 2015 finished with greater area but far less extent since 2015 had an epic compaction occur in August/early September. That's probably why they missed the extent prediction the most of any of their forecasts. They correctly saw that there would likely be more ice area than some other years at the minimum but had no way of knowing how compacted it would be.
-
This is in line with area numbers...which is a proxy for melt ponds.
-
Here's the current breakdown of how other years compare to 2019 right now......i.e, 2018 had 370k sq km more ice than 2019 at this point. 2018: +370k 2017: +300k 2016: -20k 2015: +170k 2014: +390k 2013: +350k 2012: -280k 2011: +70k 2010: +50k 2009: +1.1 million 2008: +450k 2007: -20k What sticks out here is how closely bunched 2019 is with 2016, 2011, 2010, and 2007 (and how much more ice 2009 had at this point than the others). Those are big melt years, so this one is on track for a big year. But we're still clearly lagging 2012 and that gap probably will need to be closed significantly before the end of the month to have a chance at a new record. 2012 loses about 1.2 million sq km of area between now and 6/30, so we're gonna need to lose more than that....which is hard to do. Only 2010 and 2007 lost more between 6/19 and the end of the month than 2012 did. The pattern beyond D6-7 on the euro shows a very hostile setup for the ice....I think we'll need this to verify in order to keep within striking distance of 2012.
-
Area is currently about 300k behind 2012 right now. Still within striking distance but it needs to close the gap soon as 2012 goes cliff-diving again soon. We're running about 100k ahead of 2007 and nearly tied with 2016. So this year is definitely in that top 3-ish zone right now. I'm a bit skeptical of it keeping pace with 2012 looking at the medium range forecast...but the long range euro tries to go nuclear, so if that happened, then we'd have a chance. But I try and not get sucked into anything beyond D5-6 in the Arctic.
-
Need to see the arctic basin as a whole if we want data that predicts the future this summer...so include ESS/Laptev/Beaufort and Chukchi in those numbers....you'll see that 2019 is 3rd lowest if we do that, But there's been a recent slowdown in area loss that has seen it fall behind 2012...and it needs breathtaking losses to keep up with 2012 over the next 7-10 days. I don;'t see it happening. Today did see an acceleration again, so we'll see if that is the start of a June Cliff or not. The weather pattern doesn't look very conductive for monster losses. It looks like the Laptev and ESS could take a beating for several days, but then a vortex overtakes the arctic basin again.
-
Area is beginning to stall quite noticeably the last 3-4 days. 2012 was starting to go absolutely nuclear at this point. Starting to become skeptical of a record. We'll need that trend to reverse sharply in the second half of the month.
-
It was pretty obvious we weren't getting a 1995 minimum last year. The area data near the end of June did not support anything remotely close to that. I will post my prediction again this year. Here is last year's prediction: https://www.americanwx.com/bb/topic/48618-arctic-sea-ice-extent-area-and-volume/?do=findComment&comment=4953872
-
We'll have a better idea soon....the next 3 weeks will basically decide if a new record is possible in September. This is definitely our best shot since 2016....2016 just didn't quite have the melt ponding that 2012 did in June, so the momentum wasn't able to carry us to a new record. The last two years (2017 and 2018) haven't even been close. We knew those seasons would be pedestrian in the post-2007 sense by the end of June.
-
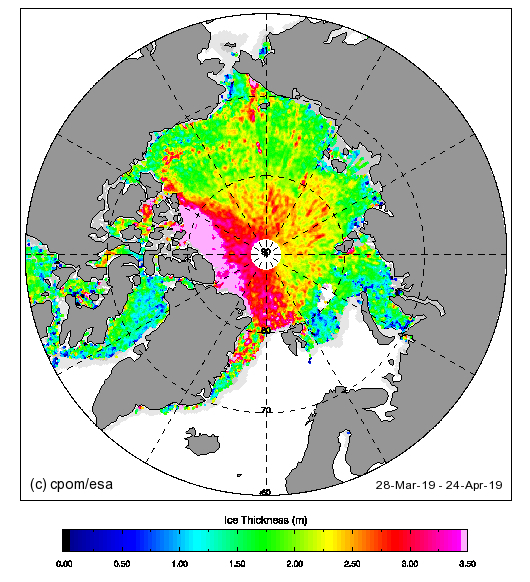
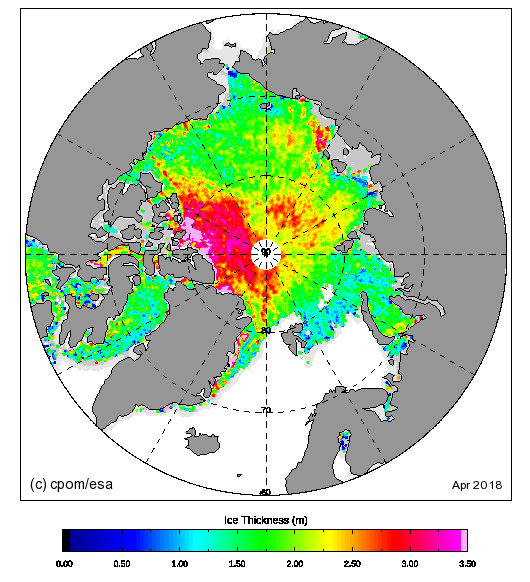
Looks like Cryosat2 is done scanning for the season....based on the prelim results this year, it looks like the Beaufort, Chukchi, and western ESS are thicker than last year, but the eastern ESS and parts of Laptev are thinner.
-
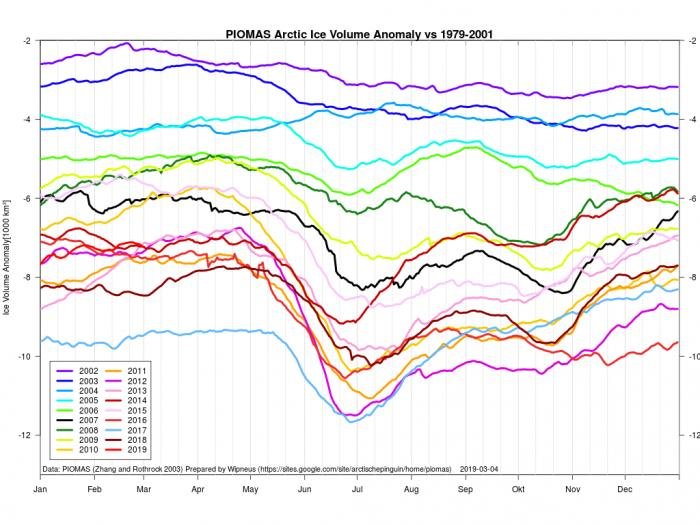
Still about another month to go before max volume....but February data is in and we're currently 7th lowest volume on record....between 2013 and 2014 right now. Spring volume is more predictive than extent/area this early, but it's still not nearly as good as area in the month of June. As an example, the highest volume since 2009 in spring was 2015 and that year had poor weather in summer bring it lower than many other years that were lower in the spring. We're not that far above 2012 either, and that year was by far the lowest on record by the time we got to September. Graph courtesy of user wipneus at arctic sea ice forum This is an anomaly graph, not a raw value graph
-
I remember someone had written an overview of the 2013 Arctic melt season and I can't find it now...but either way it showed how much the loss of multiyear ice had changed the Arctic. The 2013 summer was the coldest in the Arctic basin since 1996...but yet we still had a min around 5 million sq km, which was lower than any min pre-2007...despite some really warm years like 2005 or 2002.
-
Yeah the interactive graph uses the 5 day mean....it's updated daily, so its a daily reading, but the data is a 5 day average. The single day reading is actually 4.56 million sq km today. Like I said before, I can't remember if they use that or the 1 day reading as the min...but looking back at past mins, I think they use the 5-day reading that's on the graph. I seem to remember them explaining that the single day jumps can be a bit volatile and produce faux numbers on the margins, so they prefer to smooth it out. JAXA actually does this too but they do it over a 2 day average. We'll know soon enough. Not that there is a big difference...
-
Bluewave, I think you are referencing the 5 day average....the daily on NSIDC did get as low as 4.55 million sq km. I'm actually not 100% sure what NSIDC uses...I think they might actually use the 5 day average as the min if I recall correctly, so your number might be more "official".
-
Time to bump this as it looks like the NSIDC area minimum has been reached. The min area likely occurred 2 days ago at 3.17 million sq km. This ranks 9th lowest. My prediction above was for 3.3 million sq km +/- 200k...so this falls within that range. Taking the post-2007 average of area losses continues to be a better predictor than all previous years. The 3.17 million result was the 38th percentile of all the potential outcomes using only post-2007 area loss. This was around one half of a standard deviation, so not a strange result. The other typically less accurate prediction is extent. My NSIDC daily extent minimum prediction was 4.75 million sq km +/- 300k (and Jaxa would have been around 4.55 million sqkm). I'm not completely sure if the NSIDC extent min has occurred yet, but if it hasn't, the difference should be trivial from here on out. 2 days ago, the NSIDC extent bottomed out (for the time being at least) at 4.55 million sq km. It is still only 4.56 million sq km, so it's possible it falls back below 4.55 million sq km...though it is unlikely it will fall much below that if it does. The extent prediction was actually good this time as it falls within the margin set. In a strange nuance this year, jaxa extent is pretty close to NSIDC...usually it is close to 200k lower, but not this year. Jaxa min so far is 4.51 million sq km, so only 40k below NSIDC so far. So as a result, my jaxa prediction is really close to perfect. Again, these both could fall slightly more, but it's doubtful it would be more than trivial amounts. The current extent min on jaxa ranks 8th lowest, and the min on NSIDC ranks 6th lowest. 2017 and 2008 were both a little bit higher than 2018 on NSIDC extent.
-
Jaxa had a gain of 38k yesterday....so it's possible we have hit the extent minimum. If we have, then the jaxa min was 4.54 million sq km. This would rank 8th lowest above 2017, 2016, 2015, 2012, 2011, 2008, and 2007. Area loss is still crawling along (around 5k loss today)....area is currently at 3.2 million sq km. It is probably very close to the minimum but I will wait until it is reached to reconcile my predictions from the end of June data. If area loss doesn't change much more, then this would rank 9th lowest (same list as above, but area is higher than 2010 unlike extent).
-
Still falling for both area and extent but it's been very slow recently. We're around 3.4 million sq km on area and about 4.74 million sq km on jaxa for extent (prob about 200k higher than that on NSIDC). We are likely looking at a final extent somewhere in the 4.4-4.5 million range for jaxa (4.5-4.7 for NSIDC) and an area minimum of 3.1-3.3 million is my guess at this point. But there is still some time for a few minor surprises. The final outcome of this season though looks like it is going to be in line with what we thought in late June once it became apparent that melt ponding was not strong early in the season. I'll bump my predictions based on the melt ponding/area numbers once the minimums actually occur and compare the results.
-
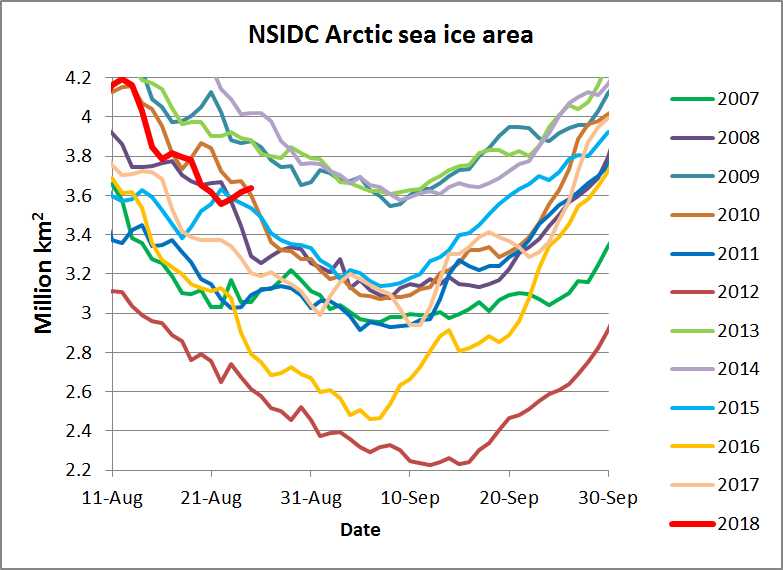
Jaxa extent is currently 7th lowest but the ice pack is pretty compact which is leading to area being only 9th lowest. I borrowed the area graph from Neven's Arctic sea ice forum for a better visual.
-
We have a very compact ice pack right now. The area numbers are on the higher side at the moment while extent is running lower. I expect this will produce a decent slowdown in extent loss fairly soon. Here's how other years compare to 2018's area right now: 2017: -187k 2016: -528k 2015: -354k 2014: +358k 2013: +314k 2012: -927k 2011: -490k 2010: -67k 2009: +238k 2008: +11k 2007: -612k You can see the in the post-2007 context, the only years noticeably ahead of 2018's area are the lower melt years of 2009, 2013, and 2014. Extent is already low though, so it is likely we will finish at least in the bottom 6 or 7 in extent...it remains to be seen if we can crack the top 5 at the end. I think it will be hard to go lower than 2012, 2016, 2015, 2011, and 2007....but it's possible if we keep the ice pack really compact like we did in 2015.
-
The winter of 2007-2008 was a big deal too...not just the 2007 melt season. At the end of 2007, the arctic still had a lot of MYI leftover, but a huge portion of it got exported in the winter. If it had been recycled back into the Beaufort gyre, then it's possible we would have reverted a little more to years like 2005. Still low, but not wiping out the pacific side almost every year. It would have eventually been wiped out with some of those years like 2011 and 2012, but who knows how the progression would have looked with more MYI...the temp profiles may have been different. Hard to say for sure. The first year ice doesn't get thick enough now in the Chukchi to protect the beaufort gyre from warmer waters. We started to see a recovery in the gyre with the very cold 2013 and 2014 seasons combined with decent winter patterns of lower export, but then 2015 had an epic July dipole that wiped out the MYI over there. I think the only way we'd get back to anything that looks like a pre-2007 year would be to have an anomalously cold winter up there combined with a cold melt season....but that type of sustained cold is nearly impossible to come by in the arctic...we only seem to be able to get it maybe 1-2 months at a time. Of course, a big volcanic eruption may do the trick too...the arctic tends to cool more rapidly than anywhere else from aerosols.
-
I wouldn't take the DMI volume data too seriously. PIOMAS has a better track record and more data. PIOMAS in mid-July had us neck and neck with 2013/2010/2016...above 2012, 2011, and 2017 and well below 2014. 2016 got destroyed from here on out so I won't be surprised if we are above that year by now since the last PIOMAS update....but I'm pretty sure we won't finish near 2014.
-
I still think the ice there has weakened quite a bit though...there's still some yellows mixed in there. But that area will def be crucial to how low 2018 goes. There isn't going to be much melt in the solid purple areas of the CAB since that region has seen very little melt ponding so it's going to come down to the "ESS arm". The central CAB was actually getting snow fairly recently....unlike 2015 where it was getting crushed by an epic high pressure all July. This is why I think it will be tough to get into a top 5 extent year.
-
Wow. A friv post...must mean something exciting is happening in melt season. All joking aside, I still appreciate the friv analysis...he even gets sh*t at neven's forum for not being alarmist enough. But i I agree with friv here...this is pretty impressive in the ESS. It's going to melt down far...more than what we thought possible even a few days ago. This is probably a combo of weak ice growth there and some intense warmth that happened early in July which wiped out the snow cover on the ice. The snow cover on the ice is an underrated aspect...esp in FYI. We may challenge a top 5 here...I think top 3 is still out of reach but a top 5 is possible. Esp in area. I think a top 3 in extent will be hard. 2015 compacted a lot and we would need to see big compaction again. Esp since the CAA is still pretty icy compared to the low years.
-
I wouldn't take the thickness map from dmi seriously...that area melts out almost every year. You could probably thicken it with some compression if everything was perfect but I'm quite skeptical it's real in an area that big.
