

purduewx80
-
Posts
1,554 -
Joined
Content Type
Profiles
Blogs
Forums
American Weather
Media Demo
Store
Gallery
Posts posted by purduewx80
-
-
There are positive depth change maps on pivotalweather+ for the ensembles (below), I think the GFS op is free. 10:1 and Kuchera ain't gonna cut it, and in reality, no snow map will capture the differences between what accumulates on trees/vegetation/grass vs pavement. Slower trends could put more of the snow into the day Sunday rather than Saturday night, which could limit accumulations on roadways outside of the mountains.
-
 1
1
-
 1
1
-
-
Peep the CPC MJO discussion for why the RMM plots are biased too weak in the extended. This discussion updates Monday afternoons. If that holds true, guidance showing a -PNA in early to mid-Feb will hold true.
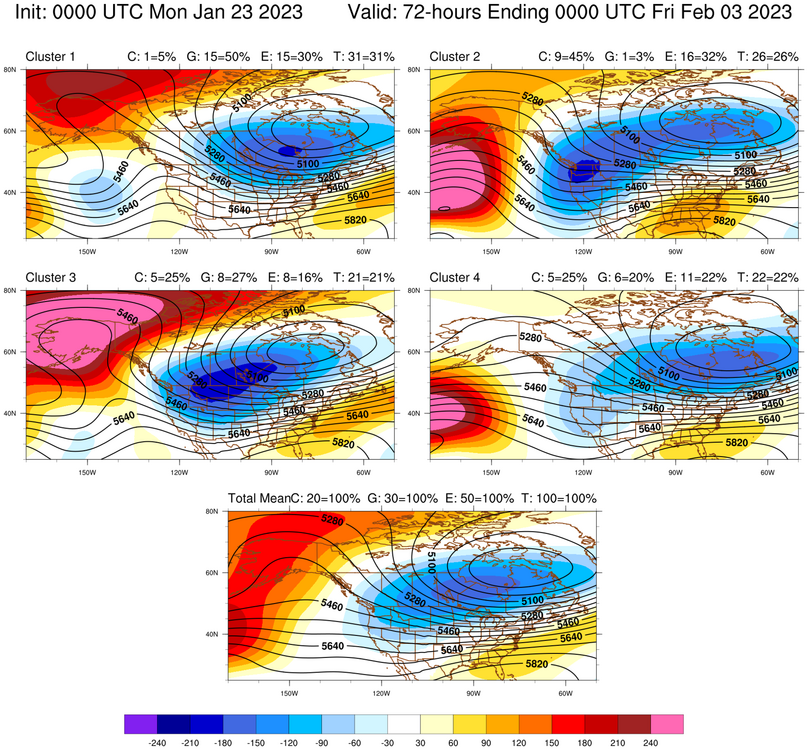
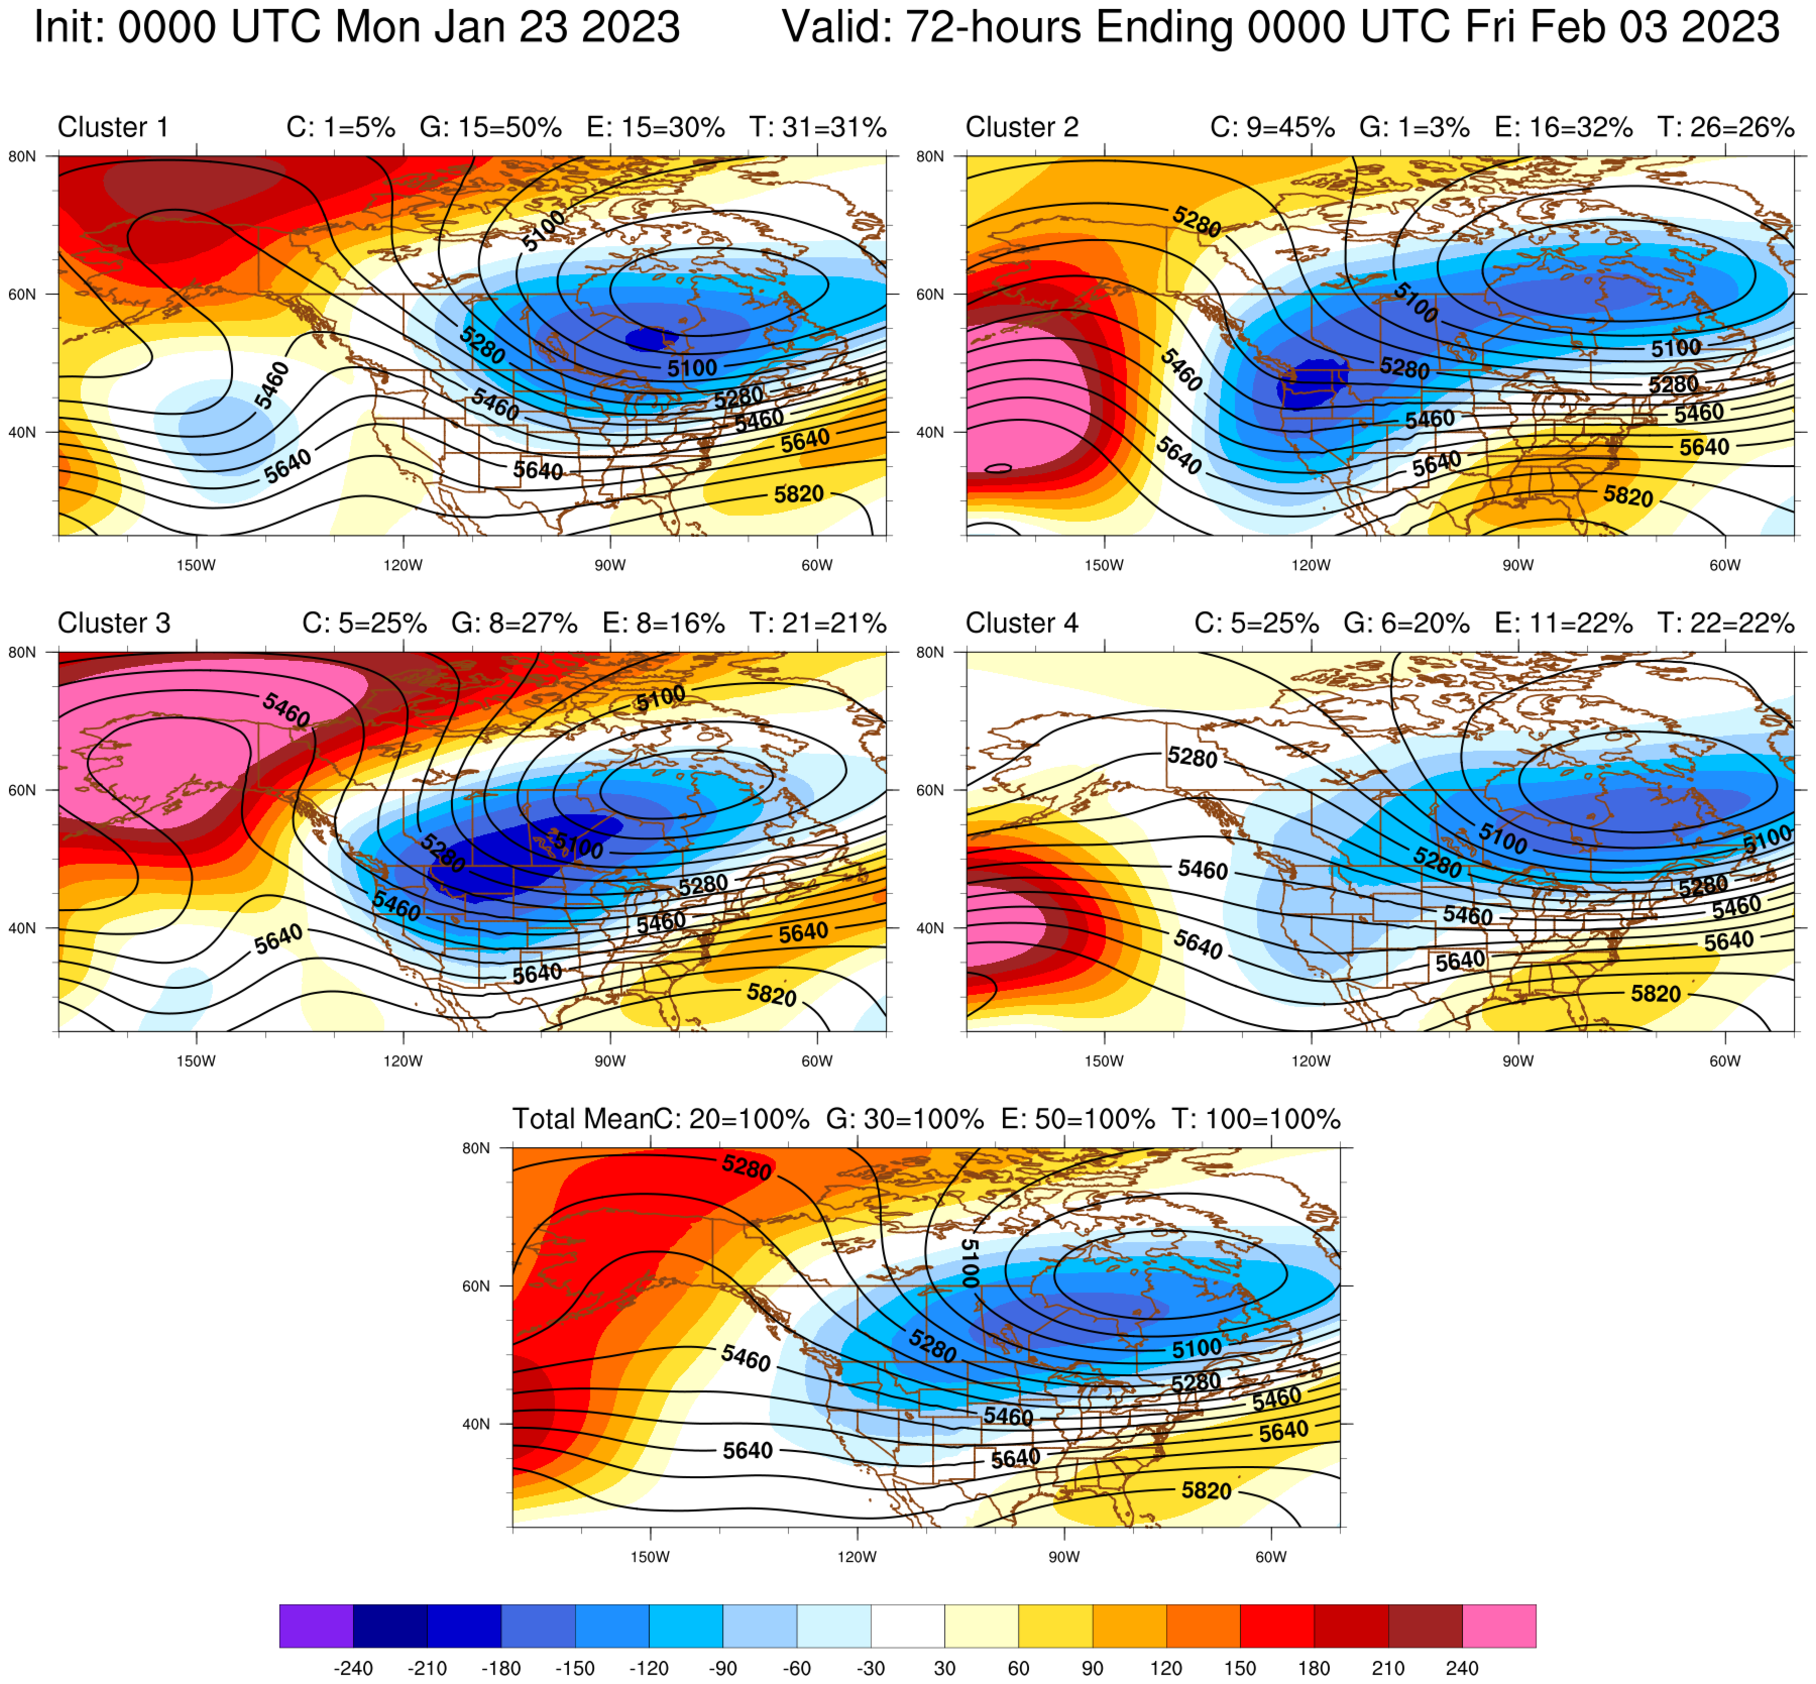
As for next week, here's a cluster analysis on the 8-to-10-day period. Think of the 4 top solutions as ensembles that are grouped together based on their similarity. No cluster is necessarily more likely than the other, but you can see the percentages of each ensemble that supports that mean. C - Canadian, G - GEFS, E - EPS. The full ensemble mean and anomalies are on the very bottom, so it's a good way to look at all the ensembles blended together. There are important differences in the Pacific, but you'll note that even with the blocking on some guidance over AK (cluster 3), all the cold air dumps into the West, Plains and Great Lakes during this period. If the Hudson Bay vortex ends up being two separate areas as is hinted at, that could open the door for more cold air damming to sneak in east of the mountains.
-
3
-
-
2 hours ago, GaWx said:
1) I find it very interesting that the heart of the very cold plunge in the SE will be during the MJO "warm" (MC) phases 4 and 5 and outside the COD! That is obviously not a common occurrence. This shows that the MJO, like most indices, is just one "tool" among many to utilize for forecasting and that by itself isn't necessarily going to be the main driver. The main drivers appear to be the continued very strong -AO along with a moderate +PNA.
The RMM indicates the MJO is just emerging from the unit circle and is forecast to evolve through phases 4/5/6 by most guidance heading into early January. More importantly, there is a 10-15 day lag between the RMM index and temperatures across the Southeast. The expected warmup towards the New Year is in line with what we're seeing here.
-
4
-
3
-
-
-
more excited for the chance of a thunderstorm late this evening than anything. will also be glad to get rid of most of the dirty snow/streets/sidewalks. hope the flooding doesn't get out of hand.
-
1
-
-
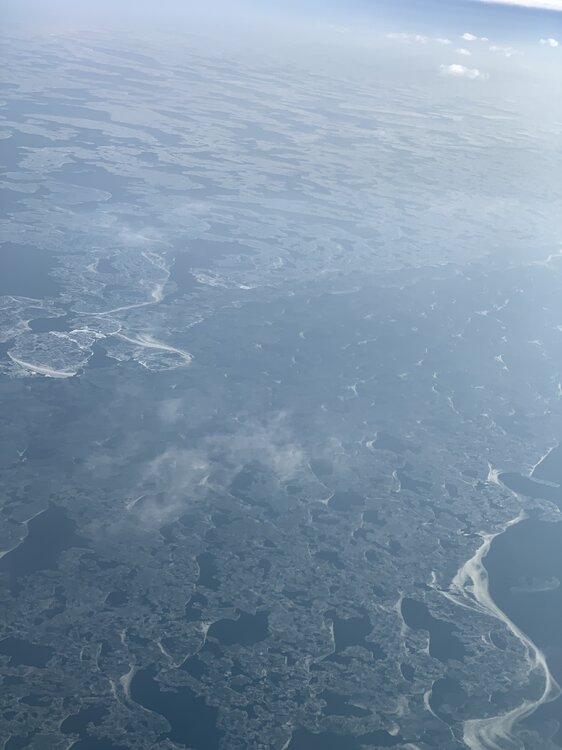
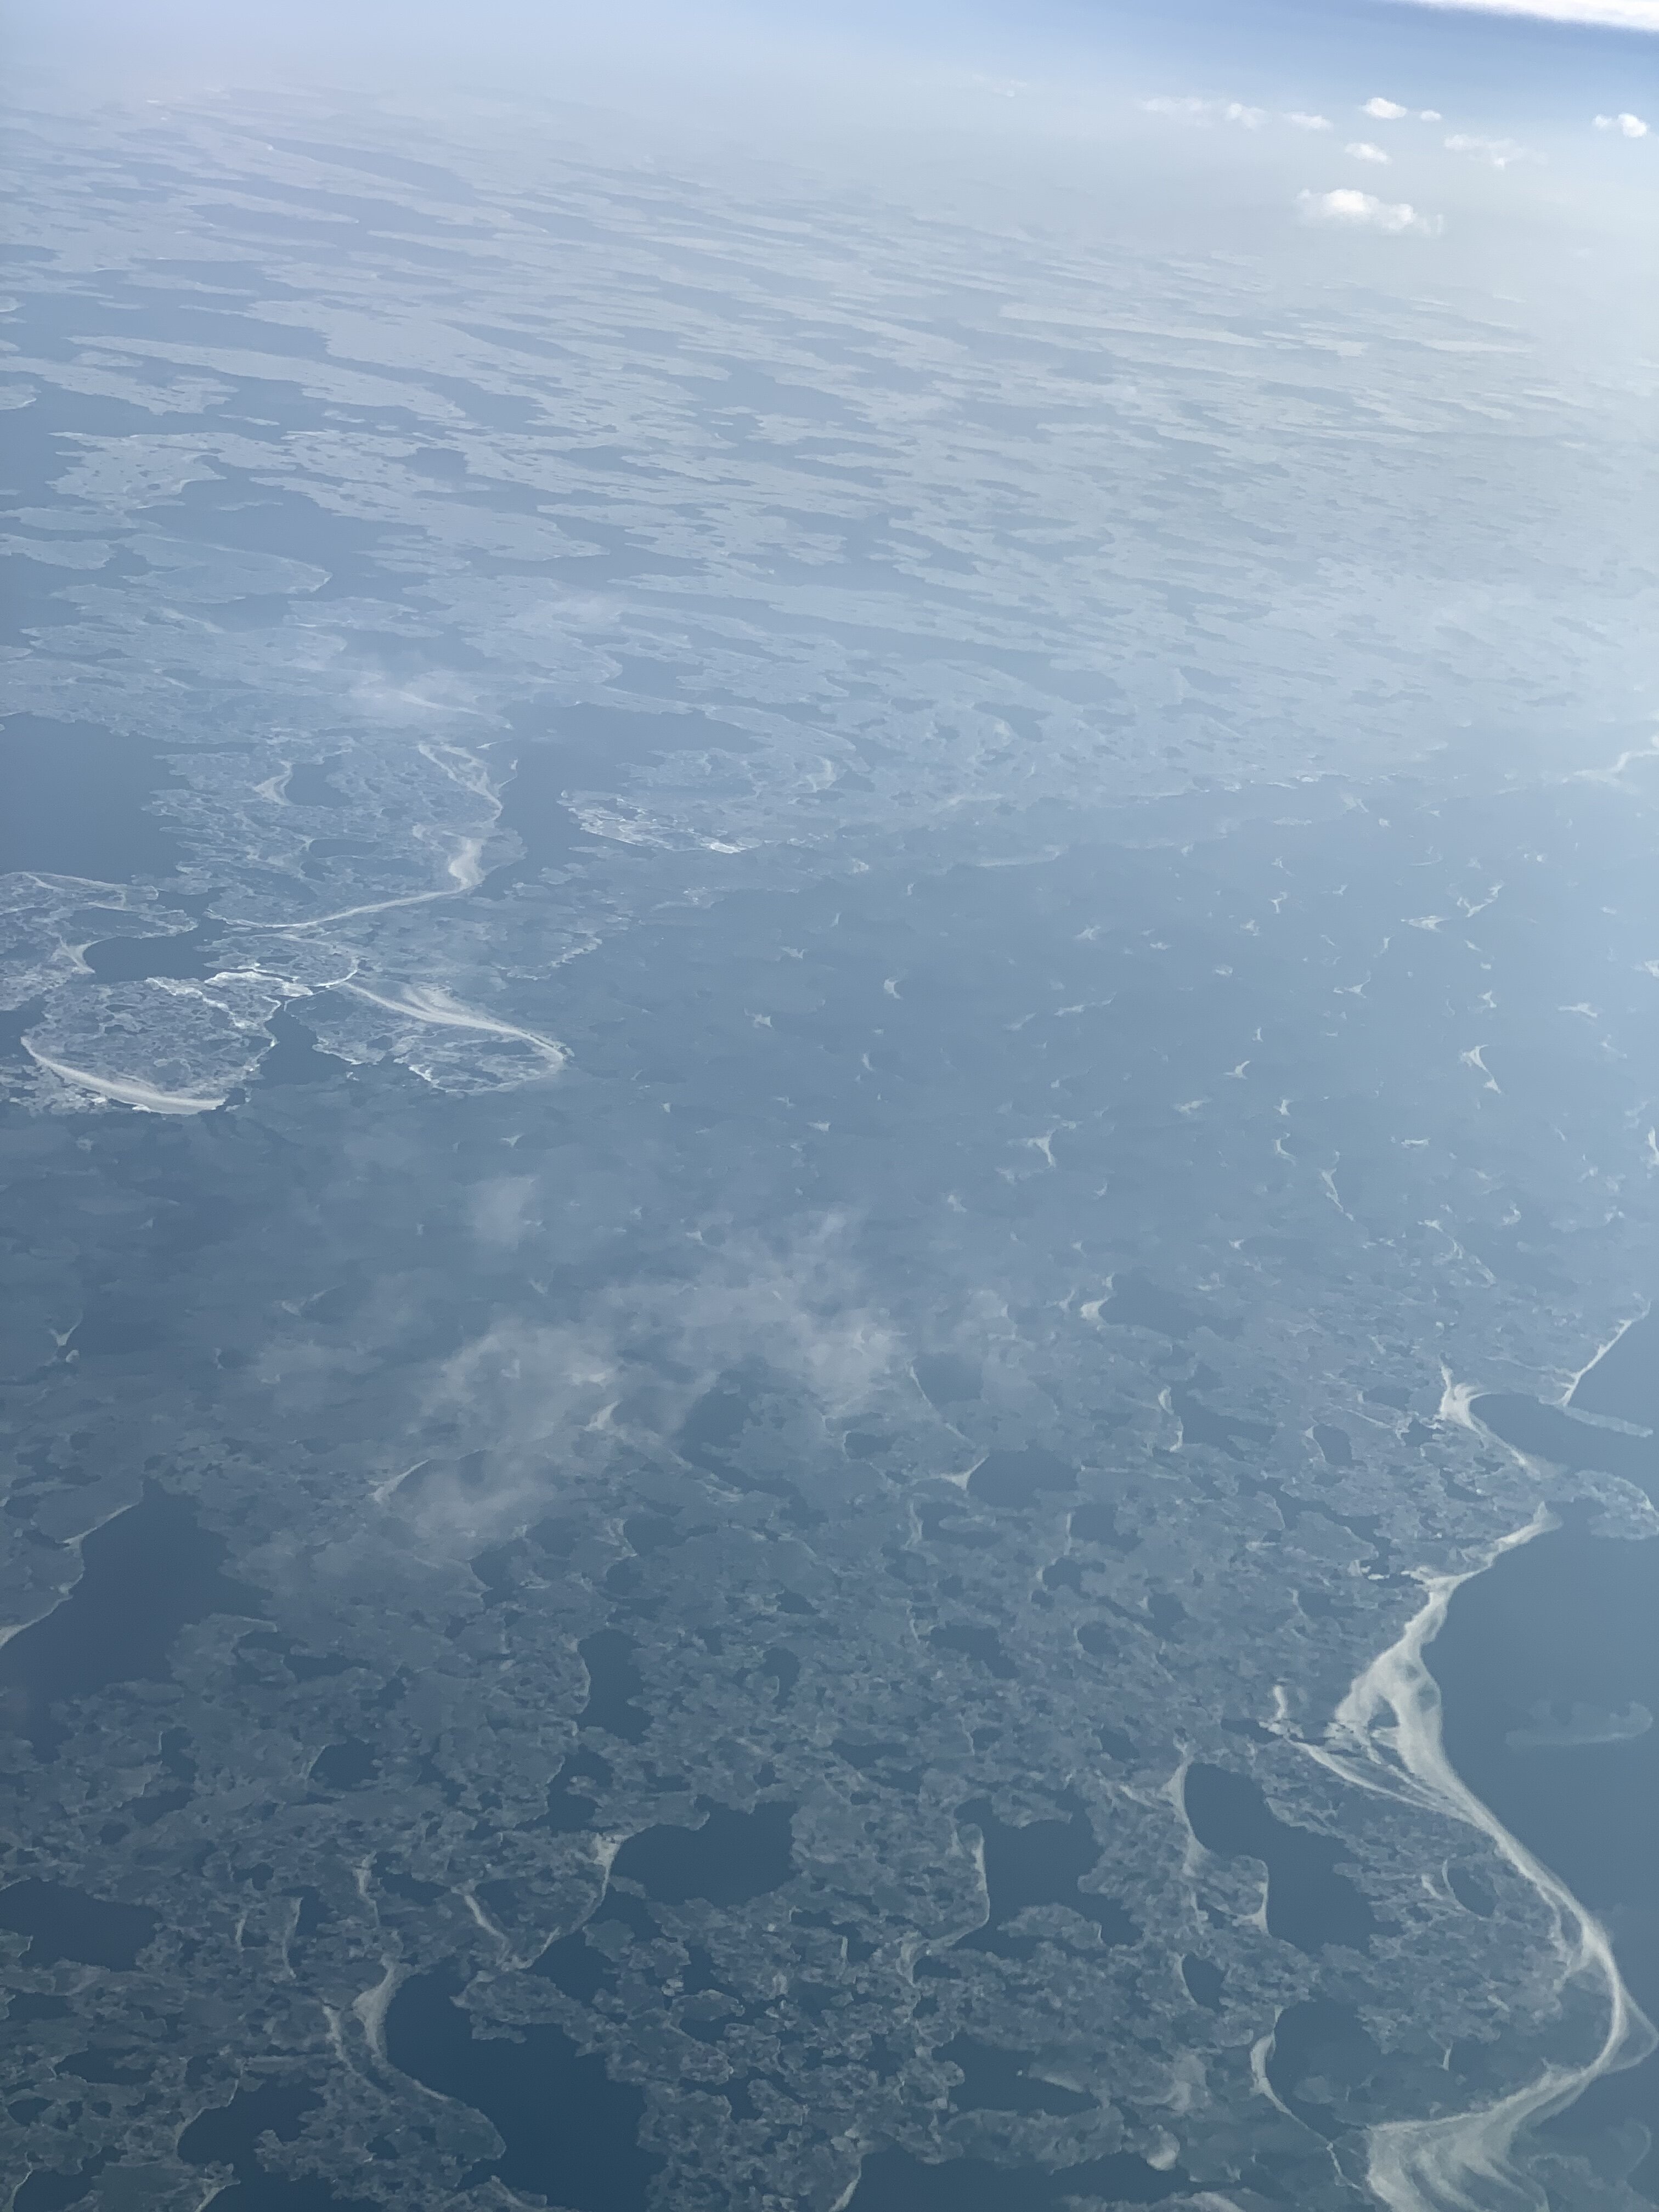
Lake ice is definitely shifting N on the S winds today (click to zoom). Most of this along the south shore and near Chicago will be gone after tomorrow's blustery, mild day. Not sure how much it'll matter for any lake enhancement, but it can't hurt to have more open water.
-
1
-
-
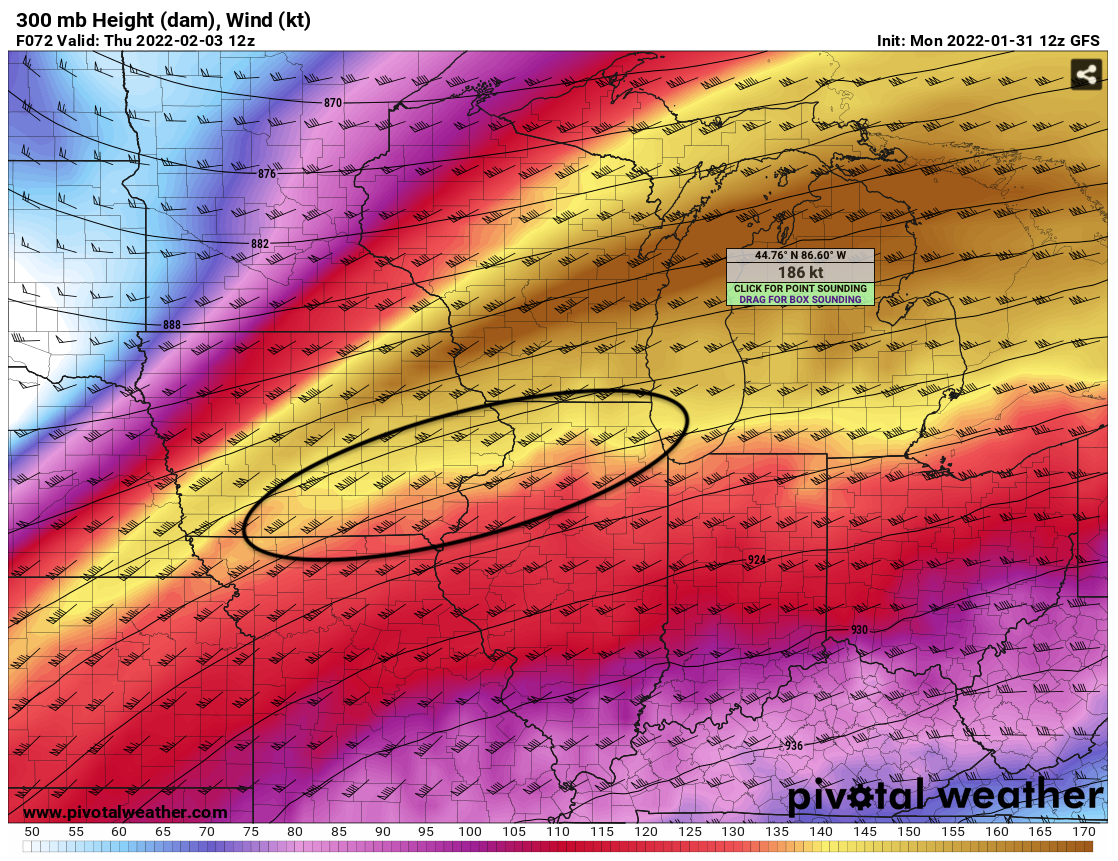
There are roughly three periods where northern areas will have favorable support from the upper jet dynamics. These setups usually produce banded snows, and it's not something you'll see on modeled QPF. How much snow they produce depends on whether the best frontogenesis and lift correspond with the DGZ.
The most impressive period for this setup is on Thursday - circled below is the right rear quad of a ~190KT jet streak. Should some of the more southern solutions verify (with a less amped SE/E Coast ridge and a pig-headed PV over Ontario/Quebec instead of Hudson Bay), these dynamics end up farther south.

-
3
-
5
-
-
10 minutes ago, Chicago Storm said:
@purduewx80made a quick mention a day or so ago. But yes, it is definitely something that will factor in.
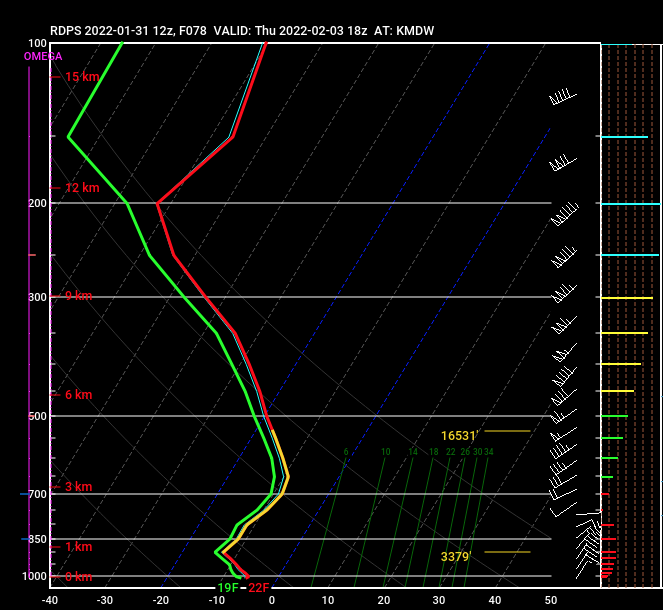
Yep, the lake will contribute for sure but almost certainly not to the degree of last Feb's system. If this were lake effect alone, inversion heights are shallow and the boundary layer cloud depths just tap into the DGZ, so it wouldn't be anything wild. Given synoptic support/seeding and a lack of shear in the boundary layer, I think it'll still be an efficient process.
-
1
-
-
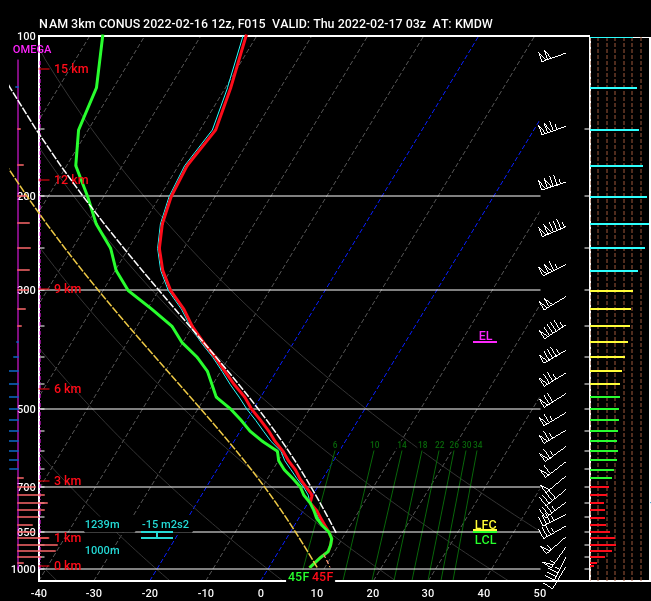
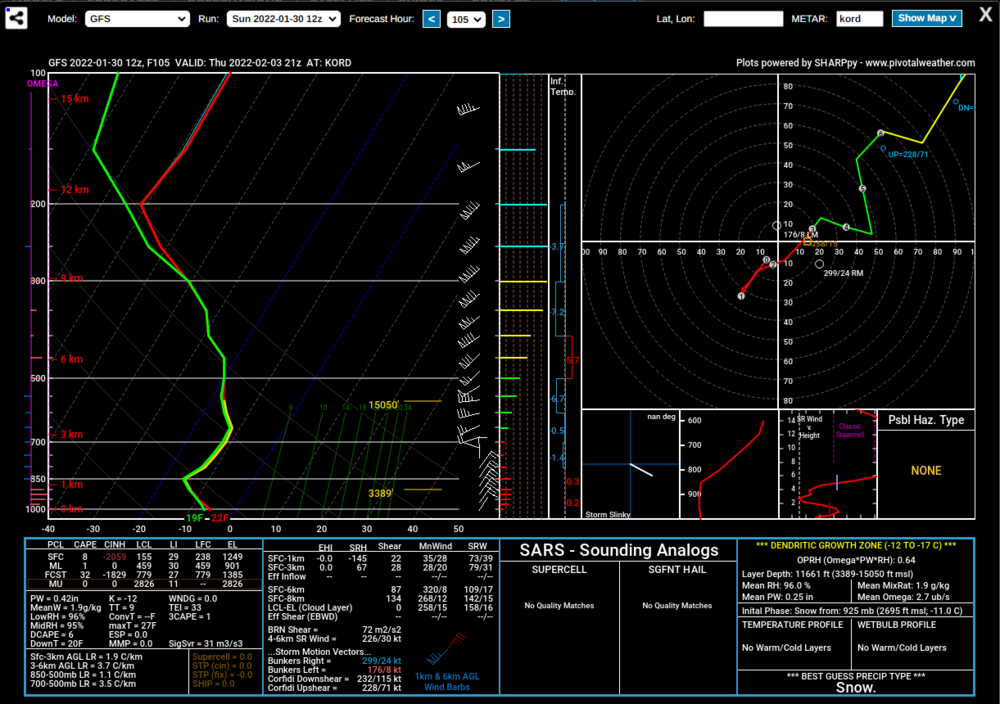
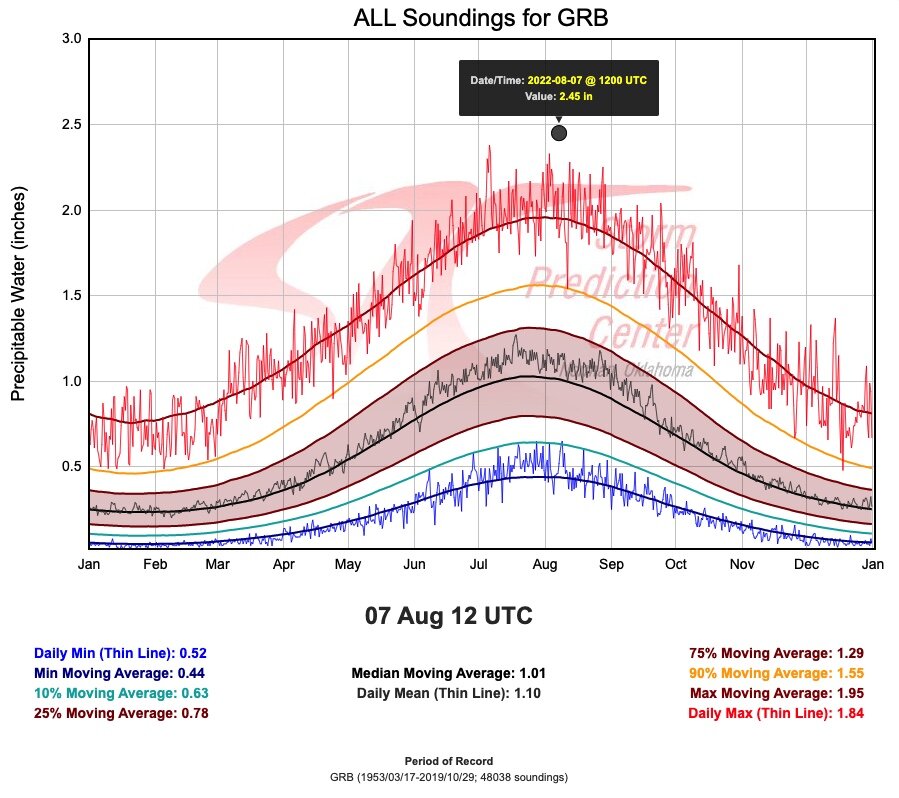
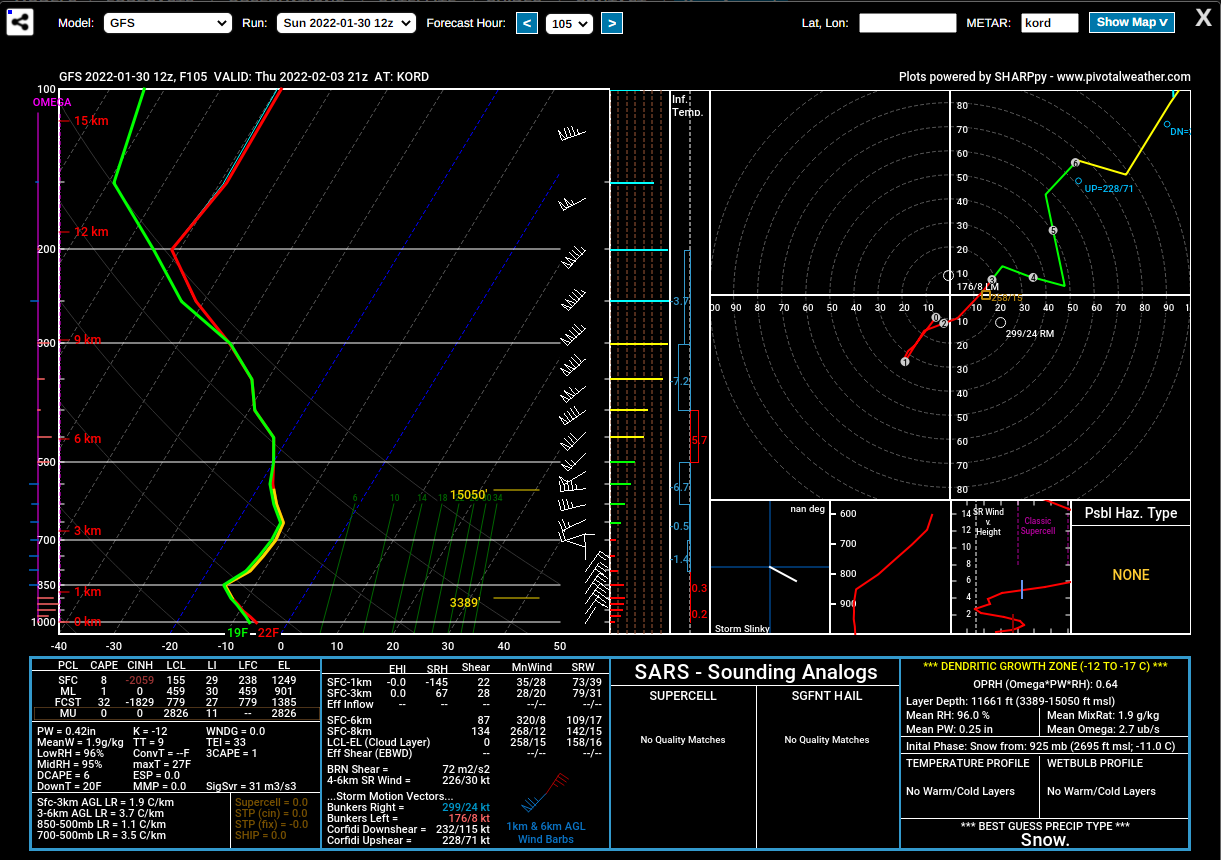
The lake contribution would be excellent with this temp profile; super deep saturation and DGZ:
-
2
-
-
2.5" the past hour in Humboldt, vis well below 1/4SM. Just over 3" total so far.
-
2
-
-
Good bit of ice on the lake near the shore.
-
4 hours ago, Hoosier said:
Well, 00z Euro bullseyes downtown Chicago with the lake effect.
That is probably a lower probability scenario, but can't rule anything out. If I had to guess, the jackpot is likely to be south of downtown in Cook county or in Lake county IN. I feel that Porter county is a somewhat lower probability scenario to jackpot as residence time looks shorter there.
If other guidance trends heavier with East Coast snow like it has, it will more likely end up in IL. There’s a pretty strong correlation to this type of Nor’easter and Chicago lake effect because of the more NE vs N flow.
-
1
-
-
Have yet to see any blowing snow or accumulating snow in the city. There is barely 1-2" left that partially melted yesterday when it was above freezing for 12+ hours and then crusted over this morning.
-
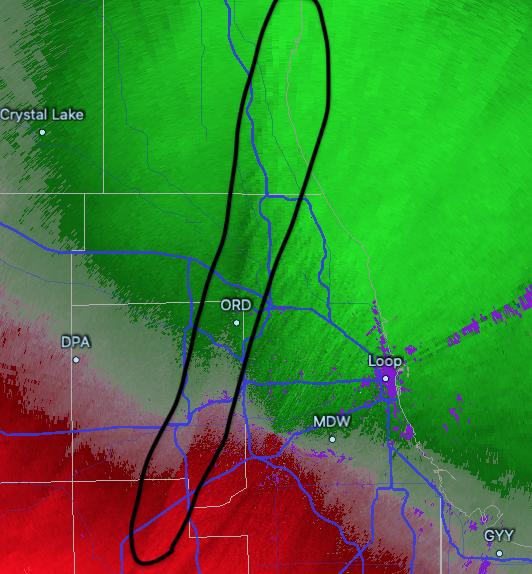
One of the main convergent bands so far is setting up near where models have the max totals. Kenosha and Racine Counties east of 94 should have the best overlap of synoptic seeding and lake effect cloud top temps favorable for dendrites. Lake (IL) and far N Cook should do p well, too.
-
2
-
-
1 hour ago, Thundersnow12 said:
P sure plumes are not 10:1, slick.
Correct. It's their other web graphics that use 10:1.
QuoteStorm Prediction Center SLR Scheme (SREF Plumes)
WHERE: http://www.spc.ncep.noaa.gov/exper/sref/fplumes/
The SPC uses the equation (via Israel Jirak): SLR = 1000 / (100 + 6T)
based on a paper by Boone and Etchevers (2001; eq. 6). T is the warmest saturated temperature (in oC) (using a dewpoint depression < 2oC) in the lowest 300 mb AGL. A cap is set at 40:1 for temperatures colder than -12.5oC (9.5oF). The wind component of the original equation is ignored, as it led to conservative estimates. The coefficient was modified (from the
original 109 to 100) to converge at 10:1 for T=0oC, and has remained unchanged since its inception.
-
1
-
-
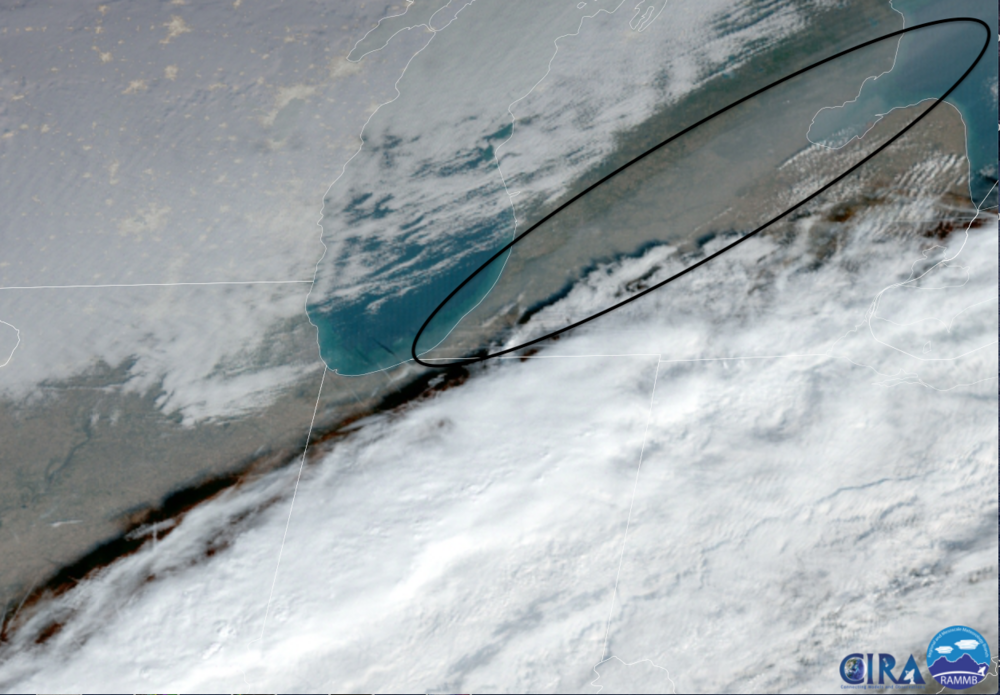
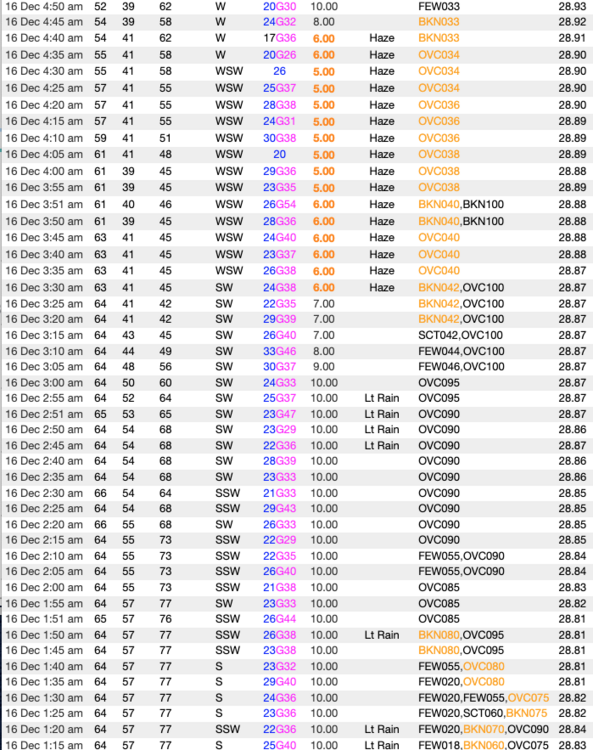
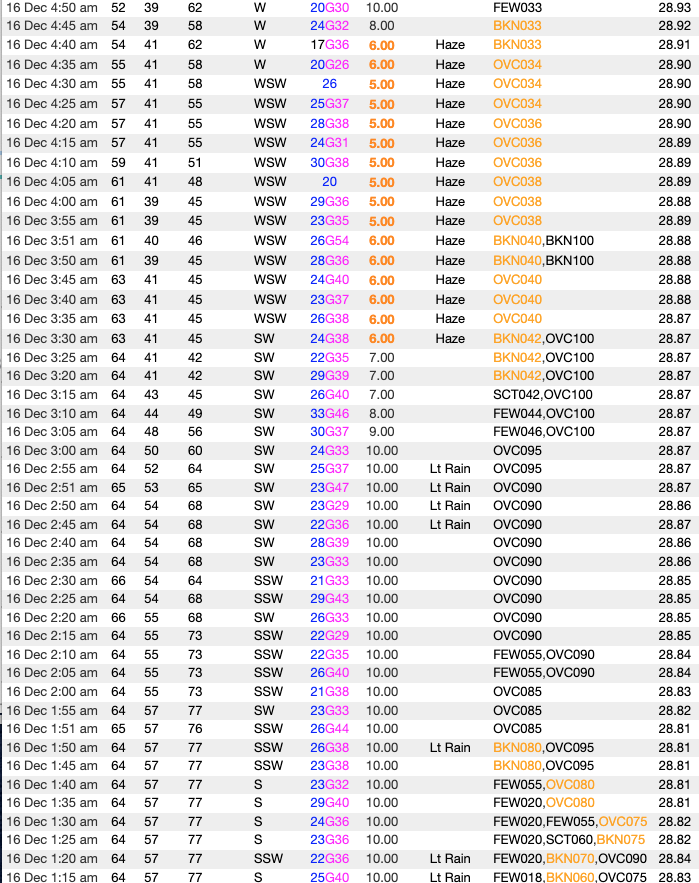
Pretty interesting evolution locally last night. In the GeoColor CIRA image below, there is some wildfire smoke (and possibly dust) evident over the Great Lakes, which no doubt came from the Plains late yesterday. All the local obs dropped below 6SM in HZ as dry air surged in (subsidence? dry line?) behind the remnant showers. Note the pressure rises, drop in dews and slow temperature fall at ORD.
-
1
-
-
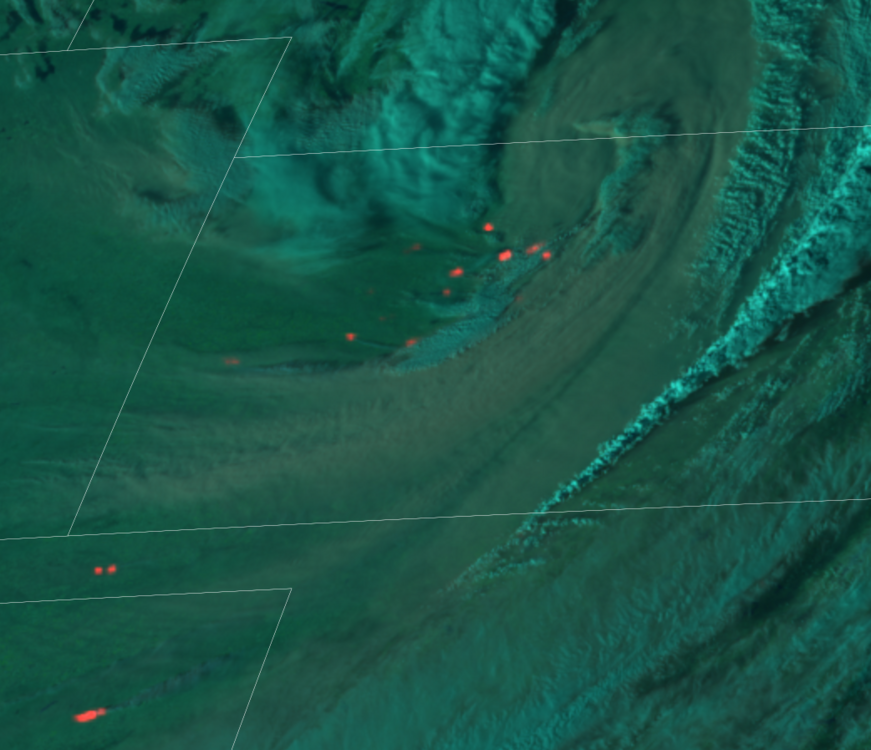
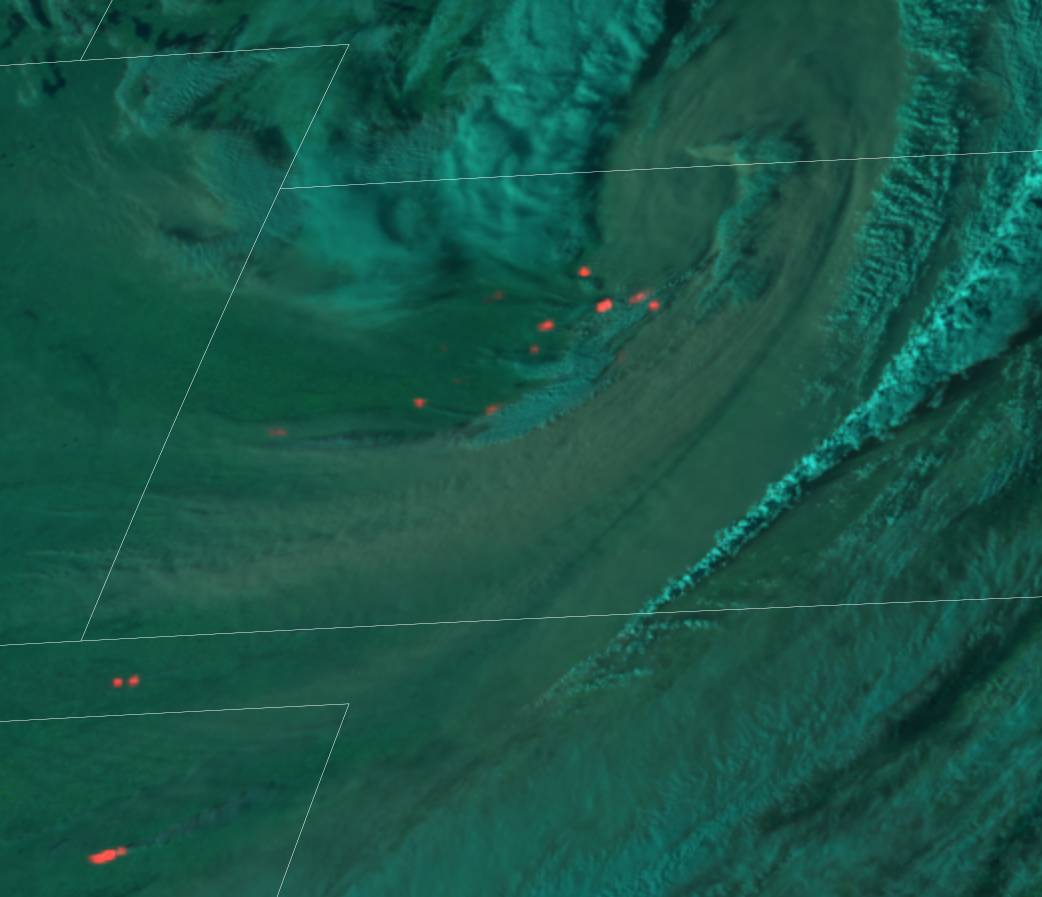
The sting jet is evident w/ CAA back in KS. Have been some 65-75KT+ wind gusts reported with it. Numerous, large wildfires are flaring up as a result of the very windy & dry conditions.
-
2
-
-
Obviously going to be a struggle for the warning mets today, everything is changing so quickly and every little notch in the line has some rotation to it. Quite a few TDS-confirmed tornadoes already are occurring.
-
17 hours ago, hlcater said:
This setup has almost everything going for it except MLCAPE.
CAMs playing catch up.
-
1
-
-
50 minutes ago, Chicago Storm said:
Agree, 10% hatched tor and 45% hatched wind look good. I’d expect wind probabilities to be expanded a bit for the next update.
Very curious to see how the SPC and WFOs handle that tonight. LOT already forecasting severe wind gusts with the showers. About as much lead time as you'll ever see in a TAF.
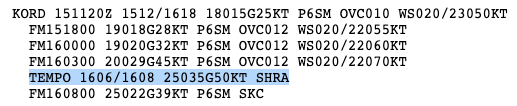
-
Hatched tor probs look good. Think supercells are a bit more likely in NW/NC IA into SC/SE MN just S/SW of Minneapolis - this is where deep layer shear is a little more perpendicular to the dryline/pre-frontal trough. MOD is definitely warranted for the wind. Derecho followed by strong synoptic winds and then cold weather is going to be ugly.
-
My dad was doing some work on their property today and found this photo. Took my mom ~2 hours to find its owner on a Facebook group. It traveled about 168 miles from the Eddyville, KY, area, near the north end of Land Between the Lakes.

-
4
-
-
1 minute ago, hlcater said:
Surprised you're so bullish given the lack of substantial instability. That said, at 75kt RM, any tornado that persists for more than 10 minutes will be a longer tracked tornado.
The army of long tracked EF0s is upon us.
I was trying and apparently failed to say the caveat is definitely instability. The Gulf is wide open, and the Euro shows what is possible. The EPS has been showing increasing probs for a high end event, as well. I'm not saying there will be a lot of tornadoes, but some of the LEWPs embedded in the line should have no trouble producing. Widespread severe winds is the slam dunk here.
-
1
-
-
41 minutes ago, CheeselandSkies said:
Tomorrow's system is of the type that could create a substantial regional tornado outbreak if it were April with a wide open Gulf (thinking here of a certain date in 1965).
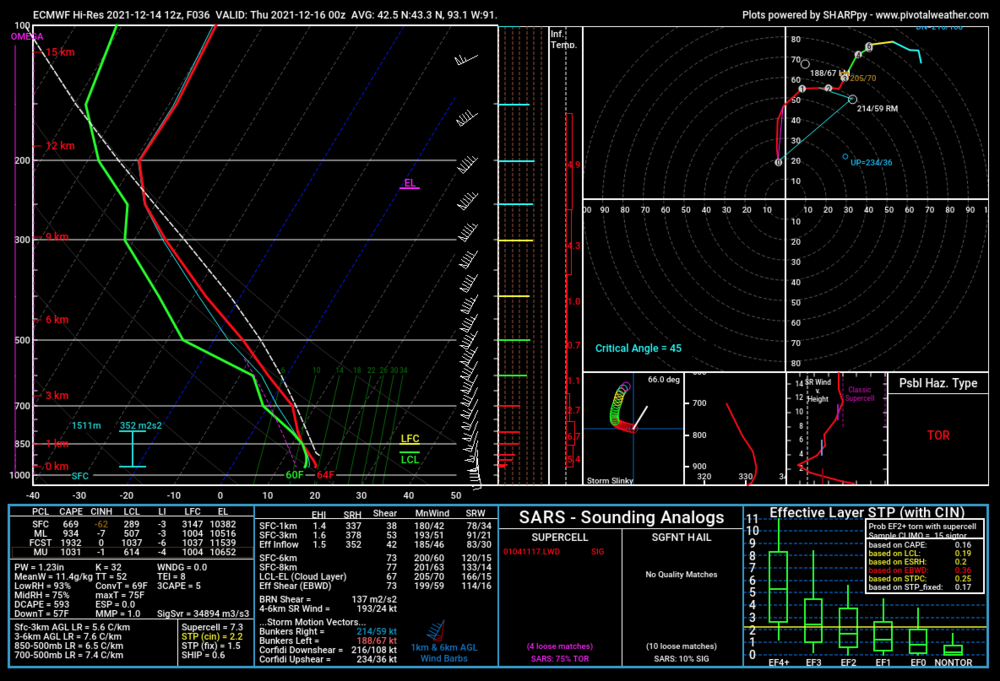
Decent chance it will. Low-level shear is outrageous but deep-layer shear suggests storms will quickly line out. Could be a mix of sups and LEWPs that produce after dark tomorrow imo. There are many indicators for long-trackers should the Euro's forecast instability materialize. Any capping there would easily be overcome by the dynamics ahead of the rapidly deepening, neg tilt 500mb wave. Below is an area avg sounding from the NE ~quarter of IA at 00Z tmrw eve.
-
1
-


February 11-12 ULL Winter Storm
in Southeastern States
Posted
There is almost better agreement on the freezing rain potential than for snow. A surface high over the Mid-Atlantic could maintain just enough dry air to wet bulb surface temps down to or below freezing near the Blue Ridge (esp. sheltered valleys and some ridge tops) as the heaviest precip moves through. The TROWAL (trough of warm air aloft) provides the melting aloft for that and also contributes to the upright instability that will be crucial for flipping rain over to snow despite marginal boundary layer temps for elevations below ~1500'. The favored zone for heavy snow will be just northwest of the core of the closed 700/500mb circulations, but predicting where and when convection occurs this far out, even on hi-res guidance, is next to impossible. That's why ensembles are still a good tool for a marginal situation like this.