

etudiant
-
Posts
718 -
Joined
-
Last visited
Content Type
Profiles
Blogs
Forums
American Weather
Media Demo
Store
Gallery
Posts posted by etudiant
-
-
9 hours ago, IrishRob17 said:
I had the heat on this week and it was killing me! Not because of the measly cost, which ain't much compared to the heart of winter but the fact that it was warming up the house. My mother in law, who retired to GA years ago is visiting her blood is pretty thin nowadays. Gorgeous morning out there.
Surely an electric heater would have served you better.
Recommend the oil core heaters, gentle heat, no fire risk, keeps the room cozy without heating the whole house.
-
48 minutes ago, George001 said:
Paul Roundy thinks a super nino is coming. He’s not always right but the Nino is indeed building from east to west like he said, it’s already +.4 and not even June yet so there is plenty of time for the nino to drastically increase in strength. What is your current thoughts on the expected peak? I’m thinking a range of around +1.4 to +1.8.
Is +1.4-1.8 really a Super El Nino?
Or is there an accepted measure for the overall excess heat content of the tropical Pacific ocean? We do seem to be migrating towards a warm belt across the tropical Pacific, so less pressure differentials. Are there any accessible models for this?
-
Interesting that Antarctic sea ice is building up much more slowly than usual, to the point that global sea ice extent is at record lows for the date.
-
3 hours ago, Ed, snow and hurricane fan said:
Adjusted to 10.5/ 4.5/ 2
On 5/12/2023 at 7:53 PM, Ed, snow and hurricane fan said:9/4/2. Betting on a 97 El Nino.
11 years since Sandy, I teach statistics and probability, I know 'due' is not science, but I don't care, NY/New England are due. One of the 4, maybe even the 2, through E Nassau and into Connecticut, and just W of the river into Massachusetts.
Aiui, the most comparable event to Sandy for NYC was the 1821 hurricane, so statistically we're ok this century.
-
 1
1
-
-
1 hour ago, IrishRob17 said:
As I was driving home from being over your way I was driving into the haze as there were blue skies behind me.
Has to be just stunning burn area, we are at least 1000 miles away from the source of the smoke,
-
26 minutes ago, raindancewx said:
I don't think anyone is actually dumb enough to forecast seasonally just based on ENSO.
I have a seven factor method for seasonal stuff nationally. Then once the general idea is determined, I try to narrow it on the monthly patterns. But that's much harder.
The atmospheric river thing in La Nina is not really new though either. The Great Flood of 1862 in the West was not an El Nino as an example. These are not new patterns.
https://en.wikipedia.org/wiki/Great_Flood_of_1862
Any of this sound familiar?
The Great Flood of 1862 was the largest flood in the recorded history of California, Oregon, and Nevada, inundating the western United States and portions of British Columbia and Mexico. It was preceded by weeks of continuous rains and snows that began in Oregon in November 1861 and continued into January 1862. This was followed by a record amount of rain from January 9–12, and contributed to a flood that extended from the Columbia River southward in western Oregon, and through California to San Diego, and extended as far inland as Idaho in the Washington Territory, Nevada and Utah in the Utah Territory, and Arizona in the western New Mexico Territory. The event dumped an equivalent of 10 feet (3.0 m) of water in California, in the form of rain and snow, over a period of 43 days.[3][4] Immense snowfalls in the mountains of far western North America caused more flooding in Idaho, Arizona, New Mexico, as well as in Baja California and Sonora, Mexico the following spring and summer, as the snow melted.
...The weather pattern that caused this flood was not from an El Niño-type event, and from the existing Army and private weather records, it has been determined that the polar jet stream was to the north, as the Pacific Northwest experienced a mild rainy pattern for the first half of December 1861. In 2012, hydrologists and meteorologists concluded that the precipitation was likely caused by a series of atmospheric rivers that hit the Western United States along the entire West Coast, from Oregon to Southern California.[6]
An atmospheric river is a wind-borne, deep layer of water vapor with origins in the tropics, extending from the surface to high altitudes, often above 10,000 feet, and concentrated into a relatively narrow band, typically about 400 to 600 kilometres (250 to 370 mi) wide, usually running ahead of a frontal boundary, or merging into it.[7][8] With the right dynamics in place to provide lift, an atmospheric river can produce astonishing amounts of precipitation, especially if it stalls over an area for any length of time.
...The floods followed a 20-year-long drought.[9] During November, prior to the flooding, Oregon had steady but heavier-than-normal rainfall, with heavier snow in the mountains.[10]: 76–83 Researchers believe the jet stream had slipped south, accompanied by freezing conditions reported at Oregon stations by December 25. Heavy rainfall began falling in California as the longwave trough moved south over the state, remaining there until the end of January 1862, causing precipitation to fall everywhere in the state for nearly 40 days. Eventually, the trough moved even further south, causing snow to fall in the Central Valley and surrounding mountain ranges (15 feet of snow in the Sierra Nevada).[11][12]
Thank you for posting this.
We don't pay enough attention to these historical extremes of weather, so we get caught out when they happen again.
-
14 hours ago, Will - Rutgers said:
no idea how we evolved to have allergies i am ready to kill myself and end the bloodline
No need.
Just wear a P100 mask, you'll at least breather easier. In these post Covid days, you'll simply appear prudent.
No claims though that your eyes will be any less irritated.
-
9 hours ago, donsutherland1 said:
Today was a historic day in Spain. A new national and European April record high temperature was set.
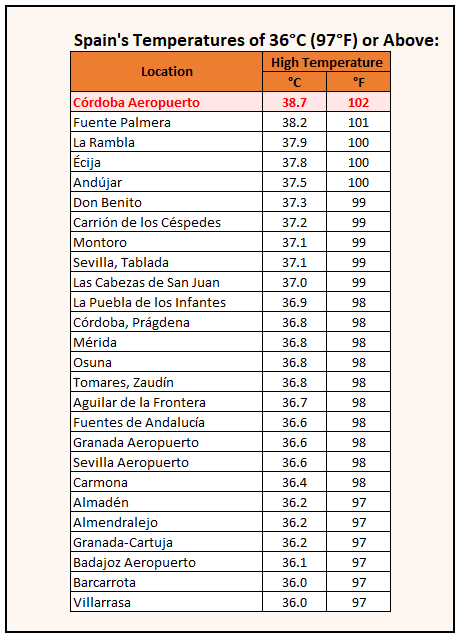
They are also in a multi year dry spell so their reservoirs are seriously depleted. This is supposed to be their rainy season, so they face a difficult summer.
-
1
-
-
3 hours ago, 40/70 Benchmark said:
There is a periodicity to those super events...1972, 1982, 1997, 2015....8 years is too soon.
Why not, the interval was only 10 years '82 - '92.
I see no reason why 8 years would not suffice, so help me understand please.
-
2 hours ago, roardog said:
I know most people here don’t care about summer but I wonder if the extra water vapor plus developing El Niño could lead to a cooler, wet summer this year.
Why cooler? Hotter and more soggy seems equally likely?
-
3 hours ago, Wannabehippie said:
JB is also all about the page clicks these days, as it generates revenue. No one wants to hear about boring, warm, dry weather. They want to hear about cold, snow. Hot, stormy, etc. So that is what he looks for in the models, looking for something in them so he can come up with a cold, snowy forecast.
How does that work given that he is on a pay for access site?
-
55 minutes ago, tmagan said:
0.9" each day.
I remember a useful book 'How to lie with statistics', by Darrell Huff.
I'm glad it is on the NY Central Park mandatory reading list.
-
 1
1
-
-
Will await the results, but Bastardi did project exceptional weather for March a little while back.
His forecast was held up to ridicule, perhaps prematurely?.
-
Thus far just very light snow in Manhattan, nothing sticking, too warm.
-
Is there any model which predicted the mild winter we are enjoying in NYC?
What surprises me is that none of them appear to have adjusted to the reality of a really low snow environment.
The Bastardi 'Hail Mary' March chill forecast is right in line with all the other models, just a bit more extreme in its focus on the model rather than what's actually happening. Qualitatively though they are all in the same boat, at least as far as I can tell. Maybe we need a new paradigm for modeling the seasonal forecasts.
-
55 minutes ago, LibertyBell said:
I quit reading JB after 2001-02
No one should have read anything written by him after that debacle.
I started following him because of Sandy, which he evaluated correctly, plus he held on to his stance despite extensive criticism.
Don't follow him any longer, $270/yr is too rich for my blood, but I respect his insights. The concern is, as Don noted above, that his approach may be misleading him in the warming climate we are seeing.
-
2 hours ago, donsutherland1 said:
One day, there will be case studies on the energy industry. It will be an example of a very low innovation industry. The principal factor responsible is likely the subsidization of fossil fuels that takes place. No industry has ever received the scale of subsidization (direct and indirect) that is enjoyed by the fossil fuel industry. Annual subsidies exceed more than $5 trillion per year globally (IMF estimate of externalities borne by society). Had the fossil fuel producers been responsible to cover the full costs of their hazardous products, the prices would have been much higher. That, alone, would have provided powerful incentives for innovation away from the hazardous burning of fossil fuels, as the industry would face the existential need of either innovating or perishing as substitutes arose.
Agree on the basic premise, think the problem is that it is a public service, so the political priority is for it to be 'lowest possible cost'.
Gasoline of course can be taxed freely, while blaming the oil companies, but juice is from public utilities. They don't like to make waves.
-
25 minutes ago, chubbs said:
Same old clown story from JB. On a more optimistic note. Solar is dominating electricity addition in the US. The writing is on the wall for fossil fuels.
"Nearly two-thirds of US generating capacity additions in the next three years will be fulfilled by solar, with the technology’s share of power generation in the country set to almost double, according to a report from the Federal Energy Regulatory Commission (FERC). "
“Moreover, if the current trajectory persists or accelerates, generating capacity by the mix of all renewables should overtake that of natural gas before 2030 and possibly much sooner.”
https://www.pv-tech.org/solar-to-dominate-us-capacity-additions-73gw-expected-through-2025/
Not enough, unfortunately.
The actual baseline capacity of renewables is a fraction of their rating, so we need multiples of the rated levels to get reliable power from renewables.
An effective system for energy storage is desperately needed to make renewables economically viable.
-
Weird, the GISS map shows the Lat Am west coast areas that have the most cooling for Bastardi and the most heating in the reanalysis to be essentially lukewarm.
If we can't even get agreement on the historical record, it seems unlikely that there can be agreement as to the future outlook.
-
19 minutes ago, psv88 said:
My god this winter blows
NYC looks poised to set a new all time record for consecutive days without snow, so it likely is an historic season, even if it does not meet our expectations.
-
1
-
-
Think it is actually a very major event, that the forecasting and modeling is good enough to project a season with some confidence.
Thus far such forecasts have usually shown little skill, so a correct forecast made well in advance of the season end is significant imho.
-
2 hours ago, WestBabylonWeather said:
Any worse then this and I’ll be cutting grass in January
Think positive, you'd love to be picking flowers in January. So bring it on!
-
2
-
1
-
-
California gets massive rains from atmospheric rivers periodically.
When Leland Stamford was sworn in as Governor in 1862, Sacramento was so flooded he had to take a boat to his inaugural.
William Brewer, hired by the State to survey the area, reported extensively on the event, which left the Central Valley under 30 feet of water. See his notes in 'Up and down California'.
Imho, the interesting element is his offhand comment that the native Indians had all moved to higher ground before the event, so they knew what was coming, unlike the incoming settlers.
-
 1
1
-
-
California has a record of really impressive rain events, presumably driven by atmospheric rivers.
Case in point is the 1862 experience, which left the Central Valley flooded over 300 miles long, 20 miles wide and 30 feet deep for half a year.
The event was carefully documented by William H Brewer, hired by the Legislature to perform the first botanical survey of the region.
More recent studies suggest similar events would be capable of causing damage in the $1 trillion class.
The ray of light is that there has not been the kind of really extended drought that seems to prefigure the extreme rainfalls.
Interior NW & NE Burbs 2023
in New York City Metro
Posted
Just awful, but surely not the heater's fault if the electric wiring it is plugged into goes up in flames.
As an airplane designer once said: It is really hard to make something fool proof because we keep getting better fools.