raindancewx
-
Posts
3,853 -
Joined
-
Last visited
Content Type
Profiles
Blogs
Forums
American Weather
Media Demo
Store
Gallery
Everything posted by raindancewx
-
If it makes any sense, I think the pattern of 1983-84 is a decent match, but the warmer Earth/less ice against 1983-84 is part of why I have the winter fairly backloaded away from the east coast. I had NM/AZ and much of the interior west/mountainous areas warm Oct-Dec. Doesn't really look wrong. I do think TX starts to cool off a week or two before we do though. The cold coming off Asia should eventually cool the Pacific enough to allow the Arctic ice to build up pretty rapidly - especially since I think this winter has real blocking...but it is transient and no where near permanent.
-
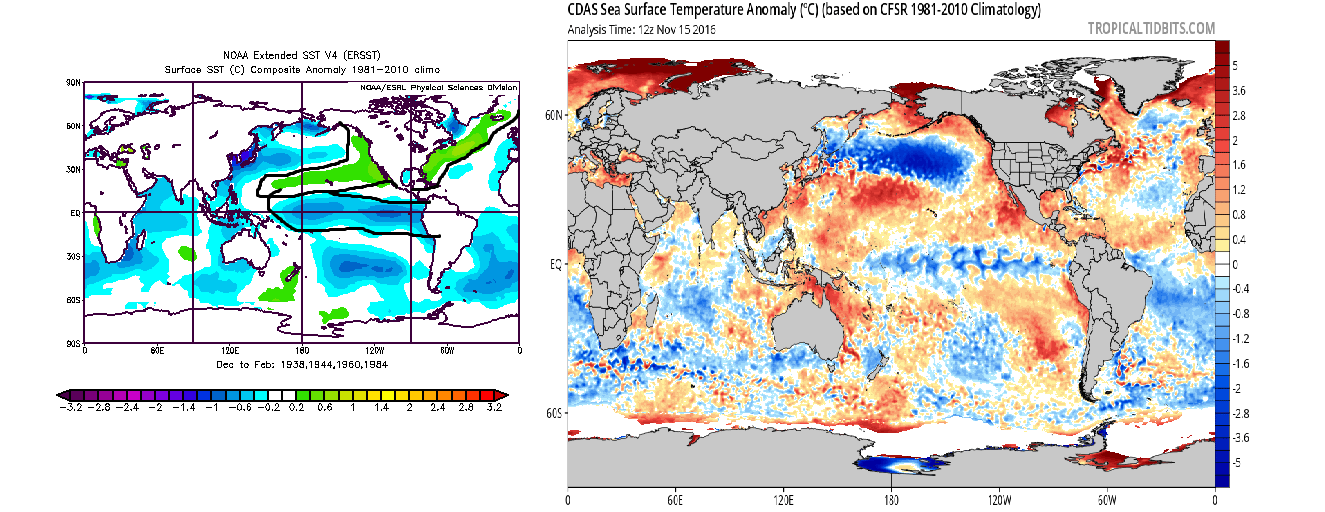
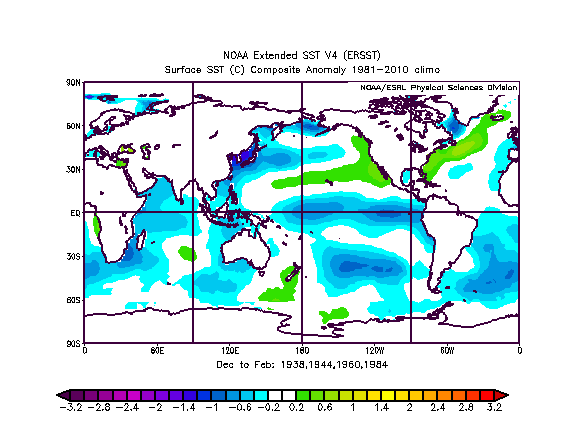
The PDO went up in October (JISAO) to 0.56 It took me a while, but Dec-Feb 1937-38, 1943-44, 1959-60, 1983-84 work well as a good match for the oceanic pattern right now. Those years had a PDO value in Nov-Apr of 0.58, an ONI value of -0.28 in DJF, and an AMO value of 0.146 from Nov-Apr. Central/Modoki La Nina, weak, cool pool off Japan & Russia, West Coast warmth wrapping west south of Japan cold pool, stripe of warmth along US east coast, cooler in eastern Atlantic. Oceans fairly cold south of the equator. It's not a perfect match, but eyeballing it, I'd say it's 80-85%?

-
Looks to me like the PDO is heading positive again, with the AMO weakening a bit. Both good for New Mexico & the SW. The La Nina is still pretty clearly a Modoki, and weak. Not sure how long it lasts either, I think it may peak Oct-Dec, or Nov-Jan.
-
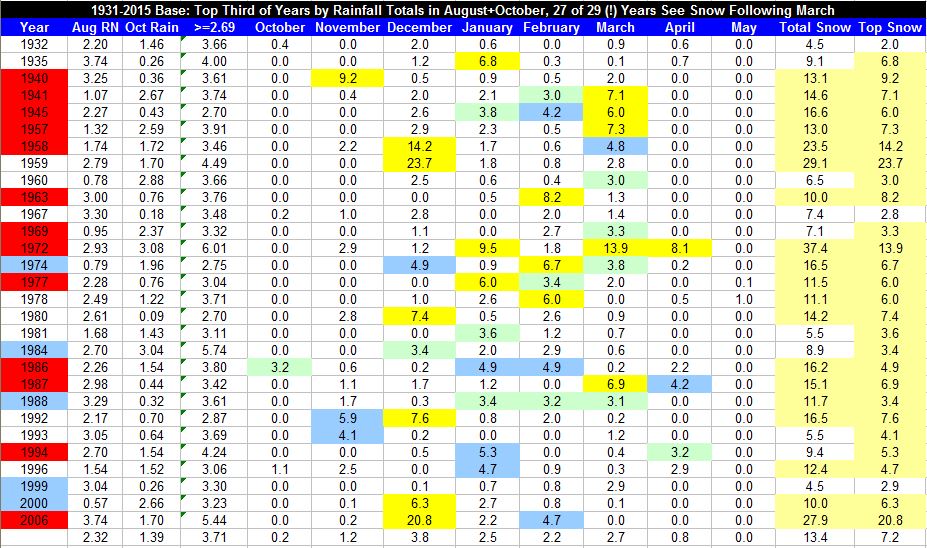
This will be the latest it's ever dropped to 40F or lower in ABQ too. Can't speak for TX, but warm Octobers, especially if October is nearly as warm as Sept, tend to favor big snow late (Jan-Apr) and cold/snowy February in particular. This actually seems to be known, as it is a saying. Haven't tested the other folklore though. http://www.stormfax.com/wxfolk.htm We've had (already) a wet November here - which is pretty rare in La Nina / Neutral years, but it does tend to favor near normal snow overall.
-
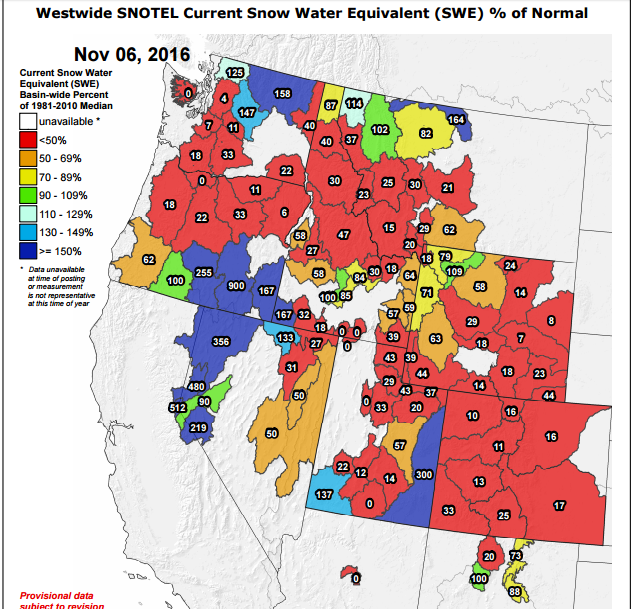
Albuquerque (airport) got 0.66" precip Nov 1-5. That's already well above our monthly average of 0.46" precip. I'm a bit worried about my call for a warm November now. Every inch of precipitation in November lowers the mean high in November by 3.9F historically, so we're now favored to be a degree or so below normal for the month - and that's assuming it doesn't rain or snow again for the rest of the month. The most similar years since 1931 with this much precip in early November here are 1933, 1946, 1957, 1986, 1990...and those years averaged 0.97" precipitation. Snowpack also recovered a fair bit with the recent moisture.
-
The CPC had weak La Nina conditions for the second tri-monthly period in a row. July-Sept has been updated to -0.6C (from -0.5C) and Aug-Oct is listed as -0.7C. I'm expecting the La Nina to peak in Sept-Nov, hold fairly steady in Oct-Dec, and then weaken rather quickly. May make a good run at -1.0C though (could peak at -0.9C or so). Should be a "stronger" La Nina than the 2014-2015 El Nino was in terms of deviations from 0.0C anomalies. Part of me thinks we go into a stronger La Nina next year after a brief warm up, but there isn't a whole lot of evidence for that at the moment. It's definitely a Modoki - Nino 1.2 is currently around +0.7C by tropical tidbits, and the western tropical Pacific is warm too.
-
February 1964 was incredibly cold in the Southwest too, after being very warm in October. We're finishing our 4th warmest October (mean highs) and 2nd warmest October (mean temps) in ABQ. For whatever reason, February seems to favored for snow in the Southwest if the warmth of September lingers into October, or just generally if October is very warm. If nothing else, in ABQ our ten warmest Octobers don't seem to indicate warm winters at any especially high rate - it's 2/10 that are at least +2F for mean highs, against 18/75 for winters following an October that is near normal or cold. Not statistically significant. I still like warm Oct-Dec, cold in either Jan or Feb, and a decent snowstorm in late Jan or early Feb for my area, and probably for much of TX & AZ. I think for ABQ mean highs end up very close to normal (49.5F) for Dec-Feb, even after a warm start in Dec.
-
I had the southern 1/3 of the US wet in Nov, and the East Coast wet in Nov, so this is promising to me:
-
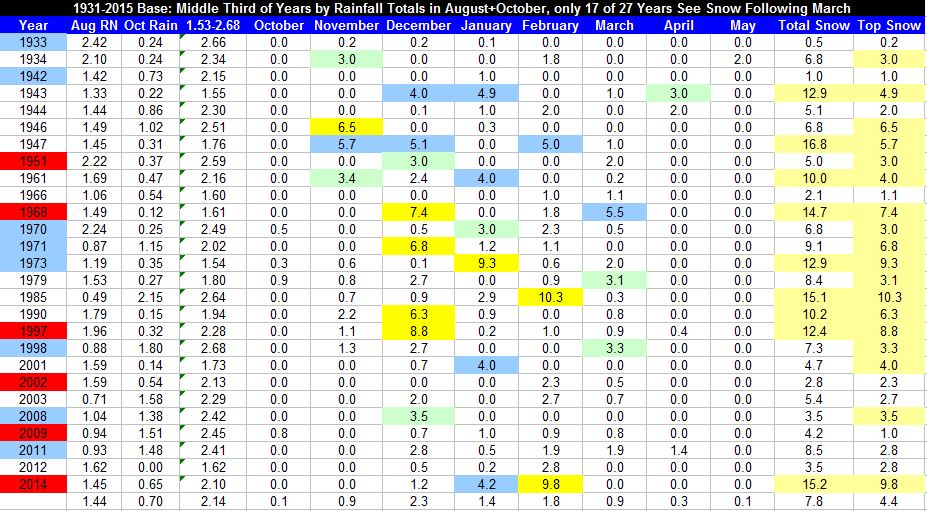
For what it's worth, Albuquerque (5,350 feet at the airport) hasn't had a freeze yet either. First freeze date (<=32F) varies a lot here, but is always in Oct or Nov, and usually right around Halloween here. Our coldest temperature this fall is still from Sept - got down to 42F...on Sept 24th...a month ago (!). First freeze will hopefully come by Nov 10. For mean highs since 1931 in Albuquerque, this is likely to be the fourth hottest October - behind 1950, 1952, and 1979. The period from July 1947 to June 1957 was incredibly dry here, with notoriously warm late summers and early falls, so the 50s being over-represented makes sense to me, and the late 70s had very hot/dry Julys too. For whatever reason though, a warm October (for mean highs) is actually pretty decent for winter snowfall here - but it does take a while to cool off, not til Jan/Feb. These are the warmest Octobers in Albuquerque, followed by snow. Also worth noting, when the mean high drops off by a small amount from Sept to Oct, (Sept mean high-Oct mean high<=9.6F) Feb snow is favored here too. The 2016 Sept to Oct drop off will be 83.2F to ~76F. Snow of over 3" in February isn't super common here, so the difference between heavy snow following a very warm Oct, when highs avg over 75F, and all other Februaries is statistically significant, 5 out of 10 against 14 out of 75, generates a P value under 0.05.
-
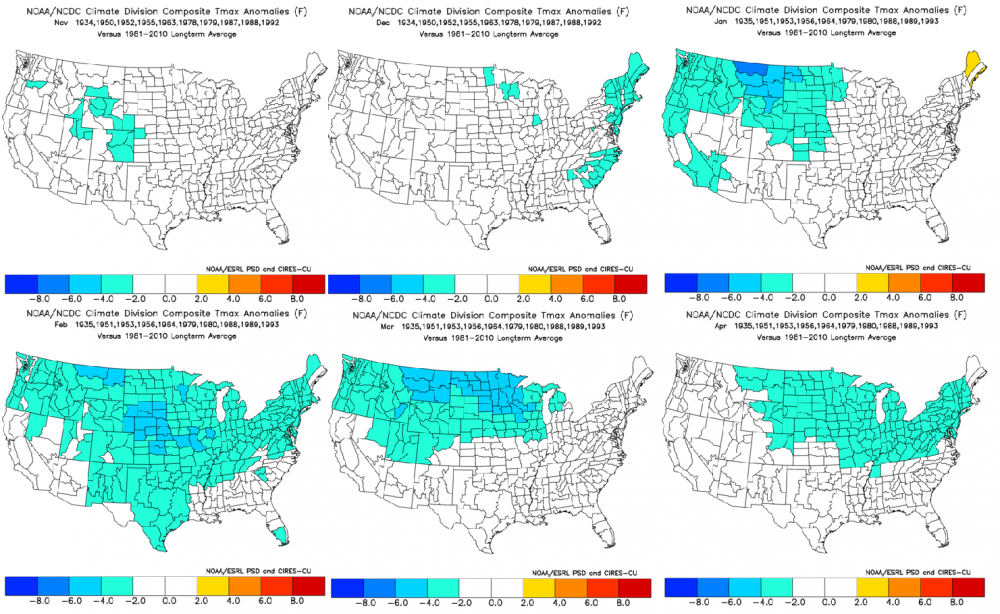
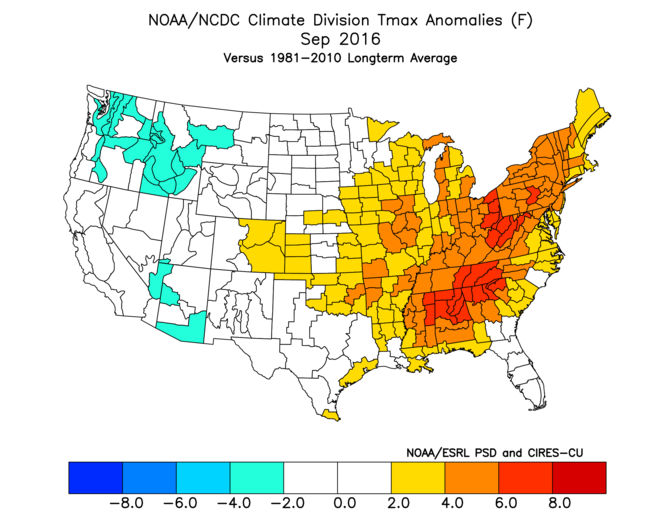
I think the warmth is definitely part of the winter pattern, my idea has been that the West would be quite warm in Nov, and especially Dec, with the east quite warm in January and to some extent into February. My issue with permanent warmth is the Summer - there were cold spots, and they were widespread at times and they moved a lot. I think we see a lot of movement in where the cold is this winter too. September also saw incredible heat in the East, with the West relatively cool, which I think bodes well for March or April.
-
There is a long post associated with this, but Weather Trends 360 says 1960-61, 1966-67, 1983-84, 2010-2011, 2014-2015 is fairly similar as a blend to their official forecast for Nov-Apr. Does favor a fairly cold winter for NM & CO, with much of the rest of the West warm/near average. Those years are pretty cold overall. Similar idea to what I had early, East Coast cold Nov, it backs west Dec, reaches SW for January. I think the east is warmer and the cold is further west in Jan-Feb though. March I think will be a bit more crazy looking, and then April I'm pretty different for that, but it's early. Overall, I like the idea they have, just think the cold is centered further west.
-
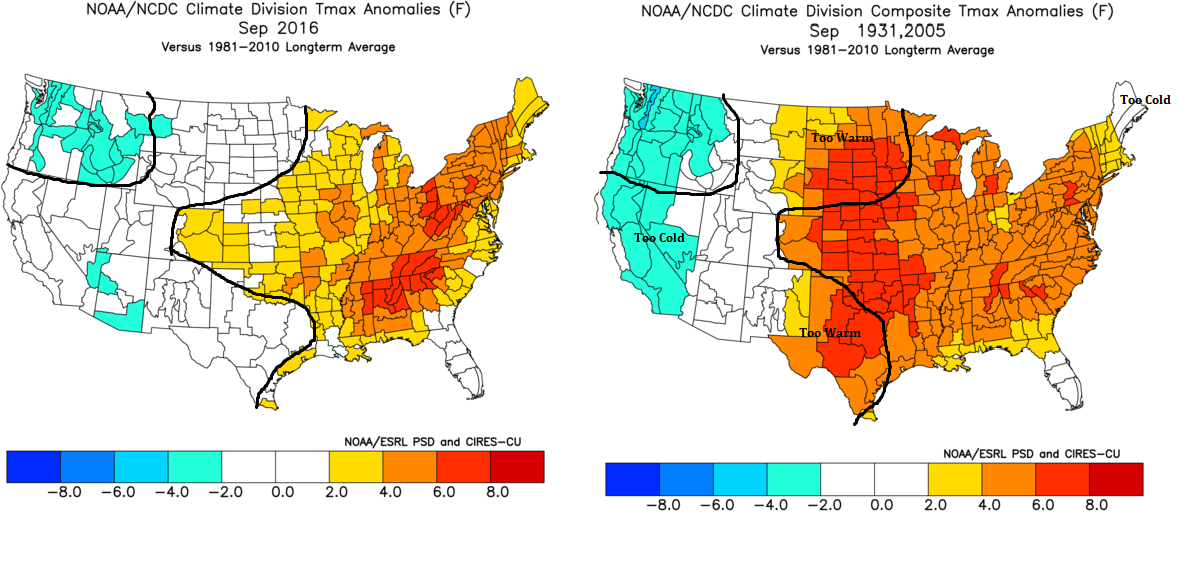
Looks like Sept 2016 is a pretty good match for Sept 1931 + Sept 2005. Usually a lot harder to produce a decent match than from just using two years. Those of you in TX shouldn't look at the winter though...

-
This thread needs a bump. Starting to get a bit psyched for the winter - had highs in the low 60s the other day. August & October is already wetter than last year, which favors bigger late season snows here. In Albuquerque we're up to 1.58" for Aug & Oct, and nearly at the monthly average for October rainfall already. If we get another 1.1" precipitation in October, March starts to look good for us in the SW.
-
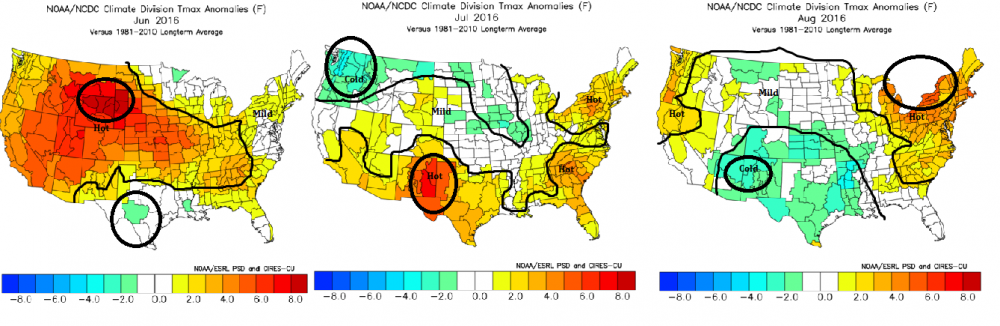
Here is my Monsoon season (June 16-Sept 30) review for Albuquerque, with some early thoughts on winter: Monsoon Highlights for Albuquerque: June & July: Hot Enough To Make the Devil Cry: - Mean Highs in June & July were 3-4F above normal - 32 days with highs of 95F or hotter in June & July (1931-2015 normal: 18) - Extremely dry from June 16-July 28: 0.30" rain...against 1.75" normal The Wet Week: - July 29 - Aug 4: 1.34" rain (normal: 0.42") August: - Not that wet in Albuquerque (0.86") but wet almost everywhere else in NM - Cold: Lowest temperature of 55F was w/in 5F of August record low (1931-2015) - Cold: Lowest mean lows since 1992 - Cold: Mean high of 85.8F well below 1931-2015 mean of 89.3F (-3.5F) September: - Moist: 1.04" precipitation in Albuquerque (exactly 1931-2015 average) - Mild: Mean high of 83.2F (Historical Sept mean high = 82.6F) - Warm: After not reaching 95F in Aug, it got to >=90F in ABQ two times - Vs. Last Sept: Much colder - it never dropped below 55F in Sept 2015, was >=90F nine times (!) - Near Record Cold: Lowest temperature of 42F was within 7F of Sept record low (1931-2015) Overall June 16-Sept 30 2016: - 3.09" rain (4.31" = 1931-2015 normal) - Biggest mean high drop off ever from July to August (1892-2015), 95.6F to 85.8F - June 16-July 28: 17.1% of normal rain - July 29-Aug 4: 3.2x normal rain - Aug 5-Sept 30: 1.47" rain (2.42" normal) - Near reverse of June-Sept 2015: Hot early, cool late. Early Winter Thoughts: - Oct/Nov snow unlikely - a warm/very wet Oct would favor a big Feb-Mar for snow though. Nov may be wet. - December likely warm & dry (it tends to behave similarly to June 16-July 15) - January likely cold and wet (tends to be similar to July 16-Aug 15) - February likely near average (mild, moist). Snowy if Oct mean highs drop <=9.6F from Sept mean highs - March likely mild & dry (moisture favored when Aug & Oct see lots of rain, Aug was dry in ABQ) - April likely cold & moist (one notable snow (>=2") more likely than usual) - May likely mild & dry (we've had three cold Mays in a row) - Pattern of frequent light snow, not one or two big storms - Outside chance pattern mimicks 1958/1959 and we get a huge snowstorm in December, in a very warm Dec. - Years of most similar Summer high temperatures (June-Sept) favor a lot of snow in Feb. - If winter highs mimicked Summer, would see near record heat early (Dec) follwed by major cold snap (Jan/Feb). - If lows mimicked Summer, would see near/record lows late in season Jan 15-Mar 15. - Pattern looks disfavorable to snow during the day, but should be efficient for snow at night. If significant snow is to fall, best bet is Jan 15-Apr 15. Oct-May season likely below average though. Will release a cold season (Oct-May) forecast soon. Spring likely dry.
-
I wrote to Nate Mantua earlier this week, and he said the PDO value for August was 0.52, even though it hasn't updated on here - http://research.jisao.washington.edu/pdo/PDO.latest I'm going with a neutral (slightly positive) PDO for the winter. It does look pretty mixed up at the moment with the cold ring along the West coast that is consistent with a -PDO half there, but half not, and the patches of warm/cool anomalies not truly positive everywhere.
-
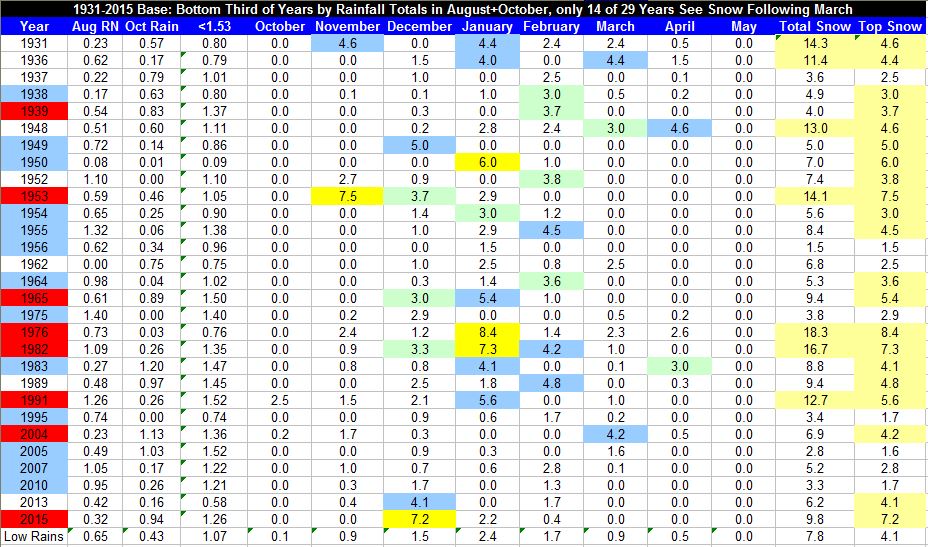
I was playing around with some stuff earlier - seems like all but one of Albuquerque's greatest snows in February are clustered following years when the mean high at the airport drops by <=9.6F from Sept->Oct. October mean high ranges from even with September to 21F colder than September here, so <=9.6F is actually the smallest third of the drop-offs. We actually average 2.7" inches of snow in February with a small drop off, against only 1.2" in years with a big drop off (>=12.9F). Will be interesting to see how that plays out with Sept/Oct. The mean high here is likely to be ~82F to 84F for September, so a low drop (<=9.6F) from Sept to Oct would favor a warm or near average (not cold) October and a cold October would likely favor less snow in February (0-6"). The five >=6" Februarys all fall in years when the mean high drops ~7.7F to ~9.8F Sept-->Oct. The flip-side is...if we have a huge drop off in temperature Sept-->Oct, it is likely because it rained a lot in October. So if we drop off a lot but get say, 1.8"+ precipitation, that would favor March snow, not February. Our greatest March snowstorms come when rain in August and rain in October total >=2.69". Ideal really would be a warm/wet October - 2 inches of rain, down only 8F-9F or so from September. Would favor February & March for 3"+ snowstorms.
-
My best guess in Texas will see a couple incredible cold shots in the winter, but overall a warm winter (>=2F+) from Dallas and south. This is what I have tentatively. I want to see the Aug PDO number - my local NWS says it is 0.52 for August (Univ Wash) but the figure isn't in yet when I go to the site. I was playing around with the PDO and the tendency is quite clear from 1951-2010: PDO+: Cold in the East, mild from El Paso to Billings, warm west of El Paso to Billings PDO-: Cold west of the continental divide, warm east of the continental divide PDO=: Cold centered on TX, but from the NM/AZ border to Louisiana, and then up to Iowa and Wyoming, with everyone else warm. Essentially...PDO borderline positive/neutral (average to cold for us!) offset by La Nina (warm to average for us!), offset by warm AMO/SE ridge for much of Texas.
-
Central/Western Medium-Long Range Discussion
raindancewx replied to andyhb's topic in Central/Western States
I have done a bunch of research for this winter and I generally have the following observations: - Cold shots tend to migrate from west to east to west to east in PDO neutral years. This favors Midwest cold. - NYC, Philly, DC, Richmond - they've all had three winters in a row of above average snowfall. It's hard to get four historically (should occur 2-3 times a century statistically, 0.40^4). - Places like Flagstaff and others west of the Continental Divide have had two to four bad years in a row for snow. Unlikely to continue. - Hasn't been cold in the East in December in several years, hasn't been warm in December in the West for several years. All in all, I like the Central third of the US, particularly north of Chicago and Cheyenne for cold/lots of snow this winter. -
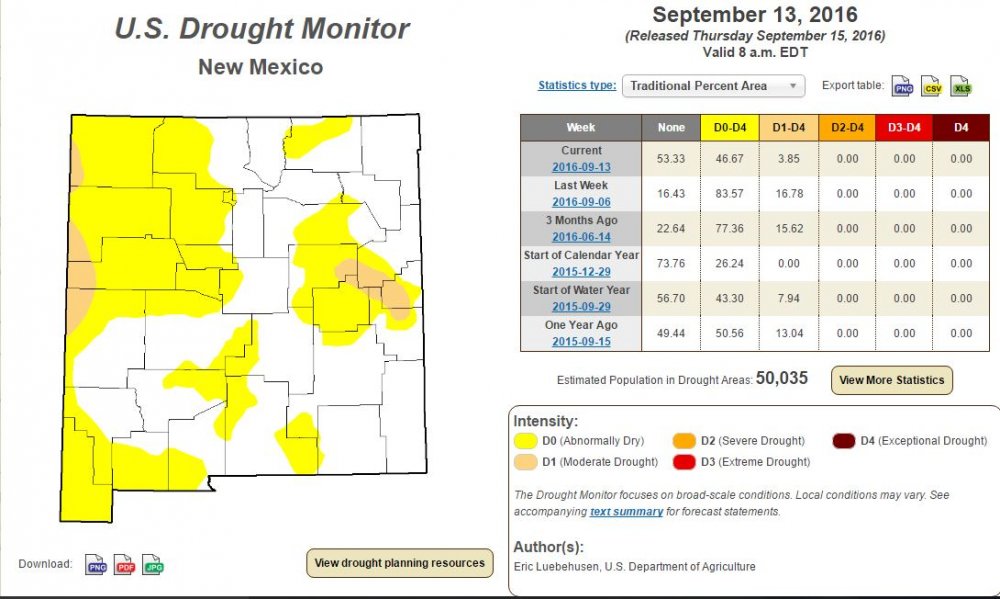
Rains last week were pretty good at killing some of the drought in Southern/Eastern New Mexico. Also, the JMA (Japan) has agreed with NOAA that the PDO had a big drop from July to August - both show the PDO at essentially neutral (near 0) for August 2016. Still waiting on JISAO.
-
Pretty good rains today for much of Northern New Mexico. Monsoon for Albuquerque has corrected back towards normal substantially after today: now its ~bottom quarter rather than ~bottom 15%. May get more rains this week. Odds of a wet monsoon are back up to ~11.7% for Albuquerque.
-
I only went back to 1931, but the years closest to ONI in JJA 2016 (-0.3), i.e. -0.2 to -0.4, are 1945, 1946, 1948, 1959, 1978, 1981, 1984, 1989, 1995, 1996, 2007, 2008, 2011, 2013. In the DJF season after the JJA season, those years averaged -0.42 for DJF, and the median is like -0.45. I'm expecting ONI in DJF to be between 0.0 and -1.0 - so for me I like weak La Nina years and cold Neutral years as analogs. Also think the peak (in La Nina territory) may come early, say SON, or OND, at -0.6 or -0.7 before fading to -0.3 or -0.4 for DJF.
-
Hurricane Newton is about to hit Mexico - should bring a lot of rain to Southern AZ/Southern NM and squash any attempt of the ridge of death from scouring out moisture after a relatively cold/wet August. September is wetter than the long-term average in La Nina years in Albuquerque, so will be curious to see if we knock out a quick inch from Newton. I'm a bit conflicted, last year we were having a bone-dry Aug/Sept and then a tropical depression saved September, and pushed the monsoon from "dry" to "wet". Completely screwed up my snow calculator in Albuquerque based on summer conditions - jumped from 10"-->15.7" once we topped 4.3" rain on Sept 22...and we got 10".
-
Weatherbell put up like five analog packages for the winter: DJF - consensus between D'aleo/Bastardi/Downs DJF - pioneer model (based on D'aleo correlating zones in the oceans w/ winter temps) DJF - "sensible analogs" combining a weak Modoki La Nina with a warm western Atlantic NDJ - analogs JFM - analogs The maps are interesting - they have a sharp split in NM, with the ~NE 1/4 of NM snowier than normal, but the SW 1/2 of NM less snowy than normal. I would say I'm right on the edge of being "normal" and "below normal". That does seem about right, most of the objective comparisons I come up with have ~7-9" for Albuquerque, against a long-term normal of 9.6". 7-9" is actually above average for a La Nina though. The maps have North Texas and most of Oklahoma doing well for snow. The pioneer model does match SW precipitation patterns pretty well this monsoon, even though it is too cool for July / too warm for Aug against what we observed, but seems like the best match for winter. Seems like it's a slightly warm winter in NM - but the warmth (+3 to +5F) is centered near the NV/ID border. New Mexico is more like +0 to +2F.
-
Have to keep our eyes on the tropics nowadays - the system moving into the Gulf of Mexico could still veer west to LA/TX. Looks like August 2016 is going to be just about the same temperature as September 2015 - which means it's a pretty cold month. We're at 86.2F through 28 days for the mean high, tied with September 2015 - with three more days for the mean high to drop slightly. Mean low is still a touch warmer than Sept 2015 here, but will likely end up very close to Sept 15 too. I figure w/ the Aug mean high colder than Sept 15, and the mean low warmer than Sept 15, the mean temperature for Aug 16 should just about equal Sept 15.
-
Central/Western Medium-Long Range Discussion
raindancewx replied to andyhb's topic in Central/Western States
I was running some figures for the SW, and it seems like in most locations, September is always colder than August in terms of mean highs. That favors September being either near average or cold out here. From 1931-2015, every September in Albuquerque was 1F to 12F colder than August. "Cold" Augusts in La Nina and Neutral years seem to drop off by ~1-8F over the past 85 years. If you blend it all together, the best bet would be a drop of 5F, with September ending up ~1.5F below normal, after August ends up ~2.5 to ~3.5 below normal. The years I'm looking at are 1933, 1935, 1961, 1967, 1971, 1974, 1988, 1989, 1990, 1999 for August in the SW. My somewhat rigorous odds imply ~5% chance of a warm September in the SW (>=+2F v. mean highs) and maybe a 55% chance of near normal (+/-2F) and a ~40% chance of cooler than normal (-2F or less v. mean highs).