WxMidwest Posted October 17, 2014 Share Posted October 17, 2014 A Winter North Atlantic Oscillation Predictor in the North Pacific ONLY during El Nino Events. Here is a bit of climate research from the summer of 2004. It ONLY works during El Nino years defined with the 1971-2000 base period Oceanic Nino Index. From here we look to the North Pacific Sea Level Pressure status throughout October to be deterministic of the December-March North Atlantic Oscillation (NAO). October SLP's below 1013-hPa indicate a higher likelihood of a -NAO, while SLP's above indicate a higher likelihood of a +NAO or Neutral NAO. Now, the problem for the winter 2014-2015 is we don't know if we will have an official El Nino event as defined by the ONI (5 trimonthly periods of 0.5C or higher in Nino Region 3.4). Some models are predicting an El Nino, some are not. Right now, according to climatology I have used, the only type of +ENSO events that really can occur is a weak event, with a very outside chance of moderate. Update: Since the Nino event is looking more favorable into the winter, likely a Weak Nino. I just checked the daily average SLP of "The Box" from October 1st-15th. Right Now it is at 1010.8mb, well below the 1013mb theshold which indicates a -NAO winter. Of course, we need the entire month of October calculated until this is set in stone. Looking at things, the Aluetian Low in place, it's going to be hard to go back over the 1013mb threshold. Link to comment Share on other sites More sharing options...
IntenseBlizzard2014 Posted October 17, 2014 Share Posted October 17, 2014 A Winter North Atlantic Oscillation Predictor in the North Pacific ONLY during El Nino Events. Here is a bit of climate research from the summer of 2004. It ONLY works during El Nino years defined with the 1971-2000 base period Oceanic Nino Index. From here we look to the North Pacific Sea Level Pressure status throughout October to be deterministic of the December-March North Atlantic Oscillation (NAO). October SLP's below 1013-hPa indicate a higher likelihood of a -NAO, while SLP's above indicate a higher likelihood of a +NAO or Neutral NAO. Now, the problem for the winter 2014-2015 is we don't know if we will have an official El Nino event as defined by the ONI (5 trimonthly periods of 0.5C or higher in Nino Region 3.4). Some models are predicting an El Nino, some are not. Right now, according to climatology I have used, the only type of +ENSO events that really can occur is a weak event, with a very outside chance of moderate. Update: Since the Nino event is looking more favorable into the winter, likely a Weak Nino. I just checked the daily average SLP of "The Box" from October 1st-15th. Right Now it is at 1010.8mb, well below the 1013mb theshold which indicates a -NAO winter. Of course, we need the entire month of October calculated until this is set in stone. Looking at things, the Aluetian Low in place, it's going to be hard to go back over the 1013mb threshold. Wow. I'm glad you brought this up because there's a possible Coastal Low coming up next week and this is very useful for the occasion. Thanks. Link to comment Share on other sites More sharing options...
GaWx Posted October 17, 2014 Share Posted October 17, 2014 Wow, I'm just now vaguely remembering this from past posts. This is fascinating stuff and there may very well be a pretty sig. partial correlation between Oct. Npac SLP and winter NAO for Nino's IF the SLP data shown here is verified to be accurate. One thing I'd like to know asap: can we trust these past Npac SLP's? From where did these #'s come? SLP of "The Box" link? Without verification that these #'s aren't made up, this is useless. However, with verification, this could be quite useful. Aside: I use this for NAO: http://www.cpc.ncep.noaa.gov/products/precip/CWlink/pna/norm.nao.monthly.b5001.current.ascii.table All of your NAO #'s are a good bit more negative than those from this table. However I don't see a problem as it isn't biasing one side in favor of the other. So, that's ok. From where do you get your NAO's? Edit: exactly what are the box's lat/long boundaries? TIA Link to comment Share on other sites More sharing options...
WxMidwest Posted October 17, 2014 Author Share Posted October 17, 2014 1st of all I'm using this NAO dataset: http://www.esrl.noaa.gov/psd/data/correlation/nao.data the NPAC SLP's generally after 1950 can be trusted in the Kalnay et al. 1996 Reanaylsis dataset, where I calculated the SLP's using the bounds on the bottom of the graphic posted. Using this link with correct bounds and SLP, 10th column of values after the years is October http://www.esrl.noaa.gov/psd/cgi-bin/data/timeseries/timeseries.pl?ntype=1&var=Sea+Level+Pressure&level=2000&lat1=65&lat2=30&lon1=160&lon2=220&iseas=0&mon1=9&mon2=9&iarea=1&typeout=1&Submit=Create+Timeseries I don't put anything out there if it's crap data... Link to comment Share on other sites More sharing options...
WxMidwest Posted October 17, 2014 Author Share Posted October 17, 2014 GaWx this has also verified quite well with regards to NAO sign, I used it in 06 and 09 here.... Link to comment Share on other sites More sharing options...
GaWx Posted October 17, 2014 Share Posted October 17, 2014 1st of all I'm using this NAO dataset: http://www.esrl.noaa.gov/psd/data/correlation/nao.data the NPAC SLP's generally after 1950 can be trusted in the Kalnay et al. 1996 Reanaylsis dataset, where I calculated the SLP's using the bounds on the bottom of the graphic posted. Using this link with correct bounds and SLP, 10th column of values after the years is October http://www.esrl.noaa.gov/psd/cgi-bin/data/timeseries/timeseries.pl?ntype=1&var=Sea+Level+Pressure&level=2000&lat1=65&lat2=30&lon1=160&lon2=220&iseas=0&mon1=9&mon2=9&iarea=1&typeout=1&Submit=Create+Timeseries I don't put anything out there if it's crap data... Thanks. Also, 9/2014 was well below avg. for Sep., which correlates to lower than avg. for Oct. With it being only at 1010.8 for 10/1-15 and when looking at forecasts, it is very likely it will end up well below 1013. Also, Anna may play a small role on recurve. The thing that's odd about this is that each set of SLP data is so flat. It really bothers me from a statistician point of view. Do you see what I'm saying? Link to comment Share on other sites More sharing options...
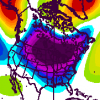
WxMidwest Posted October 18, 2014 Author Share Posted October 18, 2014 I don't really see it as a problem, especially if you pair the statistics with graphical depiction of the SLP pattern in the bounded box. You can see the difference... Oct SLP Analogs below 1013mb Oct SLP Analogs above 1013mb Link to comment Share on other sites More sharing options...
ORH_wxman Posted November 3, 2014 Share Posted November 3, 2014 Wxmidwest, Do we know what the final number is? At first glance, I'd think it favors a modestly -NAO, but that is just eyballing it. The pressures were quite low on the northeast portion of "the box" but high to the south...but the magnitude to the northeast was greater. Link to comment Share on other sites More sharing options...
Mallow Posted November 3, 2014 Share Posted November 3, 2014 Using the data from here (Oct 1 - Oct 31, 2014, http://www.esrl.noaa.gov/psd/data/composites/day/ ): http://www.esrl.noaa.gov/psd/tmp/composites/compday.6InDI1mQcs.txt If you don't weight by latitude (area), you get a mean value of 1011.6 If you do weight by latitude (area), you get 1012.4 Looks like the methodology does weight by area. But either way, if it is indeed a Nino, this argues for a -NAO. Link to comment Share on other sites More sharing options...
ORH_wxman Posted November 3, 2014 Share Posted November 3, 2014 Using the data from here (Oct 1 - Oct 31, 2014, http://www.esrl.noaa.gov/psd/data/composites/day/ ): http://www.esrl.noaa.gov/psd/tmp/composites/compday.6InDI1mQcs.txt If you don't weight by latitude (area), you get a mean value of 1011.6 If you do weight by latitude (area), you get 1012.4 Looks like the methodology does weight by area. But either way, if it is indeed a Nino, this argues for a -NAO. Sweet, thanks for the info. -NAO is pretty important in El Nino, so I like to look at it. You figure it would probably be negative if the AO is, but it doesn't always work. Link to comment Share on other sites More sharing options...
WxMidwest Posted November 5, 2014 Author Share Posted November 5, 2014 Using Monthly reanalysis data, I got 1012.36mb which is near mallow's calculation with weighting... So definitely favors a DJFM -NAO Link to comment Share on other sites More sharing options...

Recommended Posts
Archived
This topic is now archived and is closed to further replies.