
lookingnorth
-
Posts
462 -
Joined
-
Last visited
Content Type
Profiles
Blogs
Forums
American Weather
Media Demo
Store
Gallery
Posts posted by lookingnorth
-
-
Raleigh's up to a 29% chance of blanking this winter just given climo on no measurable snow thru the 25th. Meanwhile, OKC luckily avoided blanking on winter with a whopping 0.1" of snow on the morning of the 22nd when I was asleep.
-
I wonder if OKC will get their fourth sub-3" snowfall winter in five years. So far, that seems pretty likely.
-
 1
1
-
-
It was the third warmest year on record in the UAH dataset:
https://www.drroyspencer.com/2020/01/uah-global-temperature-update-for-december-2019-0-56-deg-c/
-
I just wanna pop in from Oklahoma and say that we've been doing poorly in the snow department as well. Oklahoma City averages 8" of snow a winter and has only gotten 9.5" total since March 2015. That's more like what you'd expect from a place like Dallas.
And the past two winters had below-normal temperatures, so we've just had a lot of dry, windy cold, which is annoying
-
The 5-day mean is still in third place for lowest extent, but it's near a lot of other years.
-
1
-
-
On 11/11/2019 at 4:40 PM, LibertyBell said:
It did? As far as I'm aware the coldest temp ever recorded in the lower 48 is still -70 at Wolf Creek Pass.
Did you not read that it was just a record for October.
-
1
-
-
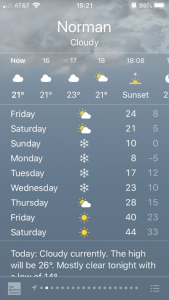
I saw about six snowflakes and some very light freezing drizzle in Norman this morning, but now it's just cloudy, cold, windy, and dry.
-
On 11/6/2019 at 10:08 AM, Typhoon Tip said:
And I want folks to note that cool relative offset region over N/A.
I've noted some 2/3rd of the months since 2000 have features a relative cool region somewhere over our continent, and more the majority of that ~ 2/3rd have had said region over SE Canada and NE conus regions.
It's enabling in a way... We are still in the top 3 contributors to anthropogenic gassing off all industrial peers on the planet, and we are consummately being protected from the "edge" extremes of warming.
I wonder how much longer that will last. I do find it interesting how every month from July 2018 to now except September 2019 has been below normal in OKC, yet the planet as a whole is experiencing near-record to record warmth.
-
1
-
-
Oklahoma set a new snowfall record for the month of October!
https://twitter.com/NWSNorman/status/1187780076026249216
It was just depressingly cold and rainy here in Norman, but I'd rather not have snow until after Thanksgiving anyway, so I can't be too disappointed.
-
1
-
-
We might get one of our earliest freezes on record here in the OKC/Norman area, depending on how cold it gets tonight.
-
We may finally get below 60F for the first time this fall in about a week. It would be the latest first sub-60F low on record by about 5 days.
-
7 hours ago, bluewave said:
10k daily NSIDC extent decline moves 2019 into 3rd place place on 9-15. Only 6k behind the 2nd place 2007.
Currently in 3rd place for NSIDC extent.
3.387....2012-9-17
4.155....2007-9-18
4.161....2019
4.165....2016-9-10
4.344....2011-9-11
4.433....2015-9-9
4.586....2008-9-19
4.615....2010-9-21
4.656....2018-9-23
4.665....2017-9-13
What's the margin of error for these measurements? Is there any significant difference between the 2007, 2016, and 2019 extents or is it a statistical tie?
-
7 hours ago, bluewave said:
One of the largest NSIDC daily extent losses for the month of September on the 4th. The 112 k daily drop moves 2019 into 4th place. The late August stall followed by accelerated losses is a first for the post 2007 Arctic. It shows how volatile the Arctic pressure patterns have become.
3.387....2012-9-17
4.155....2007-9-18
4.165....2016-9-10
4.286.....2019
4.344....2011-9-11
4.433....2015-9-9
4.586....2018-9-23
4.615....2010-9-21
4.656....2018-9-23
4.665....2017-9-13
Why is 2018 in there twice?
-
It looks like with the possible exception of 1980, we just had the smallest Aug 13-29 sea ice extent drop on record.
-
 1
1
-
-
On 8/27/2019 at 10:35 AM, JoMo said:
Frigid and Snowy this winter says the Farmer's Almanac?
I feel like they say that every year. I'm betting on dry and mostly snowless, given the way past winters have gone.
-
18 hours ago, Chinook said:
Maybe Oklahoma City is getting a very wet August? By the way, 87mph wind report near Piedmont, OK. I have heard that there was a probable tornado near Edmond.

Yeah we had a bunch of storms last night, but it was worse just north of me. The OKC airport had its fifth wettest August on record (data since 1948).
-
We got some nice thunderstorms here in Norman last night. It was the most significant rain we got since I returned here in late June. I really liked the cool weather this morning. Also, am I the only person from Oklahoma and states north on this forum? I feel like there's almost no one from my area for whatever reason.
-
Bluewave hasn't updated for today, so I'll mention that it looks like 2019 is having a bit of trouble falling below 5 million on the extent value.
NSIDC extent
Date.....2012......2019........2019 difference
8-4.......5.990.... .5.762.....+228k lead
8-5.......5.768......5.596.....+172k lead
8-6.......5.632......5.510......+122k lead
8-7.......5.467......5.388......+79k lead
8-8.......5.256.....5.390......-134k behind
8-9.......5.088......5.259......-171k behind
8-10.....5.118......5.093......+25k ahead
8-11.....5.021......5.113.......-92k behind
8-12.....4.938......5.063.......-125k behind
8-13.....4.889
8-14.....4.724
8-15.....4.679
8-16.....4.619
8-17.....4.545
8-18.....4.520
8-19.....4.405
8-20.....4.313
-
9 hours ago, bluewave said:
NSIDC extent held steady on August 8th. 2019 has fallen behind 2012 by 134 k during the period of the Great Arctic Cyclone. 2019 needs an average daily loss rate of 123k next few days to hold even with 2012 by the 11th. The weather will determine if 2019 can catch up with 2012 again. But this was the period when 2012 pulled ahead of all other years.
NSIDC extent
Date....2012......2019....2019 difference
8-4......5.990.... .5.762.....+228k lead
8-5......5.768......5.596.....+172k lead
8-6......5.632......5.510......+122k lead
8-7......5.467......5.388......+79k lead
8-8......5.256.....5.390......-134k behind
8-9......5.088
8-10....5.118
8-11....5.021
When I go to the NSIDC website I get different numbers that are higher for both years so I'm confused. I'm using the Charctic tool to view the data.
-
12 hours ago, bdgwx said:
I like the new NSIDC sea ice extent chart. You can add the ±2σ band to the display now.
But I don't like the new colors because I was so used to the old version.
-
20 minutes ago, ORH_wxman said:
I agree with the low chance of beating 2012 at this point. I wanted to see a pretty good sized lead heading into late July/early August.
I might go higher than 3% on extent but not by a lot. Maybe 10-20%.
For area I probably wouldn't go higher though as we slightly trail 2012 in area.
What would you say the odds are of beating 2007 or 2016?
-
Sorry if this has been covered elsewhere in this forum, but is there a good place for me to learn about Arctic ice melt forecasting?
I hear you guys talking about a dipole a lot, and I would guess that that means high pressure in one place and low pressure in another place, but what does that mean for melting exactly?
-
It seems like there hasn't been dramatic ice melt in recent years, so I'm going with 2026 being the year the 2012 sea ice record gets broken.
I doubt there will be a minimum greater than 2013 in my lifetime, but if it happens I'm going with 2021.
Also whoever made this poll didn't consider that some of us are hoping to live past 2050. I'll only be 52 at the start of 2051.
-
I was looking at the GFS and it shows a lot of lower 500 mb heights over the Arctic Ocean in the next couple of weeks. Will that slow the rate of melting a lot?
MO/KS/AR/OK 2019-2020 Winter Wonderland Discussion
in Central/Western States
Posted
In OKC we're having what would be average for Dallas, with a grand total of 9.6" of snow and four days of snow cover since March of 2015. Wait that's actually below normal even for Dallas. Lol. Tulsa's doing even worse than us, and they even average slightly more snow.
Springfield is also having snow amounts that are more in line with normal for Little Rock, and Wichita is having what would be considered below-normal years in OKC.