

jconsor
-
Posts
953 -
Joined
-
Last visited
Content Type
Profiles
Blogs
Forums
American Weather
Media Demo
Store
Gallery
Posts posted by jconsor
-
-
ECMWF and Australian BOM models (amongst other seasonal models) suggesting a Central Atlantic NIno developing. This, along with portion of the very warm anomalies west of Europe gradually bleeding SW the Canary Islands and eastern tropical Atlantic, could help ramp up activity in the deep tropics, particularly west of 40W.
-
 2
2
-
-
8 hours ago, Stormchaserchuck1 said:
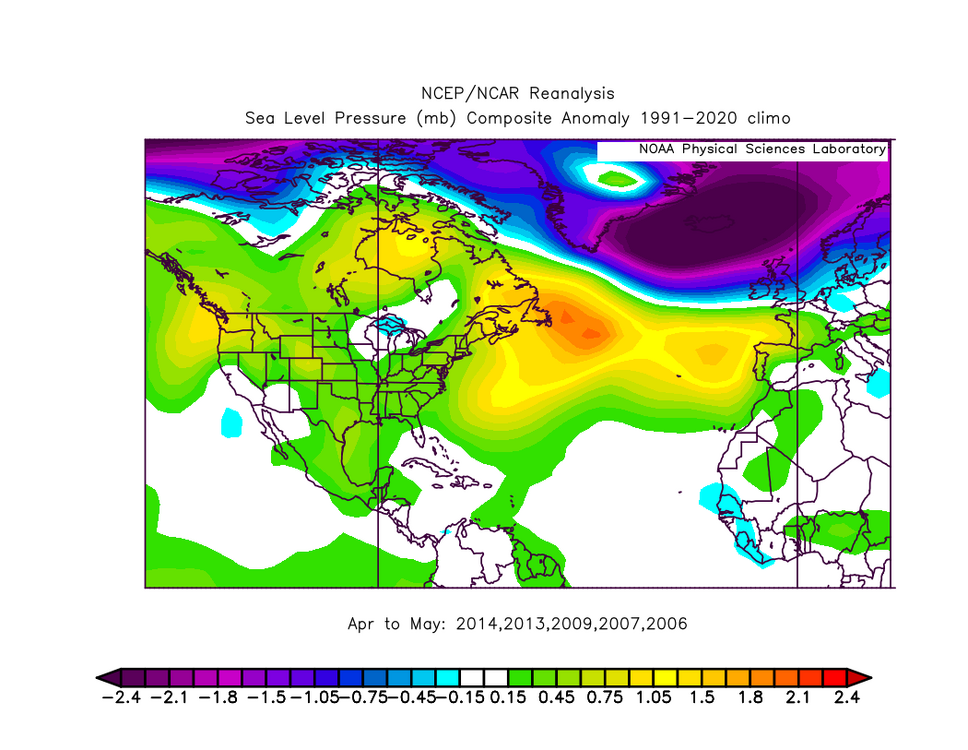
Final tallies are in for Apr-May SLP pattern of most active Atlantic Hurricane seasons since 1995:

VS ACTUAL

Tell me what you think, I think it's close to opposite
I think with this the median we can expect this season is 13-14 Named Storms.. of course there are many other factors.
Hi Chuck,
Interesting comparisons! I personally think using named storms to characterize active vs. inactive years is not particularly meaningful, given the human subjectivity and changes in NHC criteria over the years in terms of what is named.
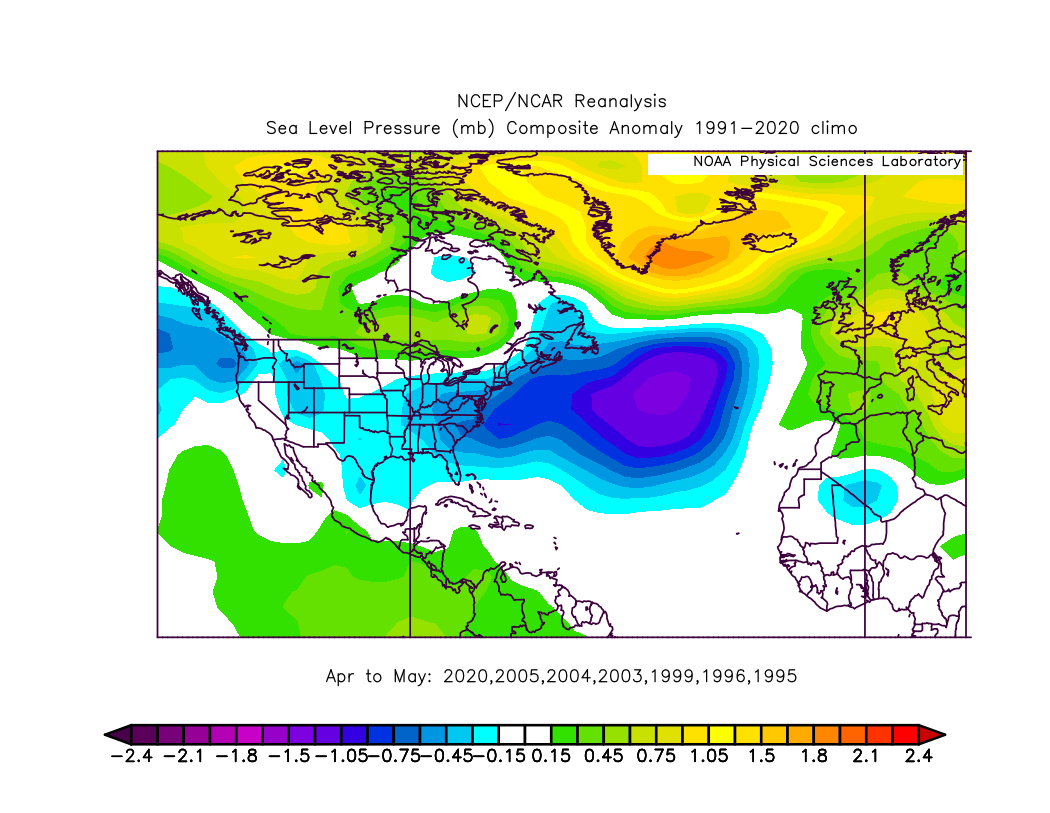
If we take the years with the most and least ACE since 1995, removing years that were El Ninos in the Apr-May timeframe (since they tend to be strongly correlated with -NAO), here are the most active years:
2020, 2005, 2004, 2003, 1999, 1996, 1995
The least active years:
2014, 2013, 2009, 2007, 2006
This year has some characteristics in common with the least active years (-MSLP anomaly from NW Territories of Canada to Greenland and +MSLP anomaly from the NW US to Hudson Bay and off the coast of the NE US). However, what is different from the inactive year composite, and closer to the active year composite, is the -MSLP from near Newfoundland to the central Atlantic near the Azores and then southward into the far east Atlantic and w. Africa. Additionally, the strong +NSLP from near the UK to Iceland is more similar to the active year composite.
In short, a mixed bag, probably closer to inactive years but not a clear signal!


-
 1
1
-
 1
1
-
-
On 6/1/2025 at 9:02 PM, BarryStantonGBP said:
Gary lezak disagrees
I was referring to highly unlikely possibility that so many of the hurricanes in both basins will become majors.
-
2
-
-
On 5/31/2025 at 2:48 AM, BarryStantonGBP said:
7 hurricanes and 5 majors in the Atlantic (and 6 and 5 in the East Pacific) is a rather comical outlook
-
1
-
-
In my view, it's mportant not to lump all La Ninas together. Modoki (central Pacific-based) La Ninas are notably different from traditional (East Pacific-based) Ninas. This has big implications for the level of Atlantic TC activity and where in the basin it tends to be focused.
This year is more likely to end up a Modoki La Nina, with cooler water relative to normal focused in the central Pacific:
https://x.com/yconsor/status/1927306239920283821 -
Thread explaining why I think chances for tropical development in the NW Caribbean and Gulf of Mexico ramp up significantly around Jun 4-10.
-
3
-
-
After not being much of a factor from 2019-24, looks like the N. Atlantic warm hole, a pool of relatively cooler water south of Greenland, is returning and should remain through peak hurricane season. This tends to ramp up the risk for E. Coast hurricanes, particularly slow-moving ones:
https://x.com/yconsor/status/1925494559032668254-
3
-
1
-
-
268Weather, an eastern Caribbean-based forecast service, has updated its hurricane season outlook:
They are going for 21 TS, 9 hurricanes and 5 MH, with ACE expectation of 185. They indicate a 48% chance of ACE above 223 and a 52% chance of at least 11 hurricanes, each of which would place 2025 amongst the most active hurricane seasons on record.Seems odd that their baseline forecast for H is 9 and ACE is 185, yet there is around a 50% chance of ACE and hurricanes well above these numbers.
If you look back at their track record, their May forecasts were considerably too high (bullish) in 2021 (ACE forecast 179), 2022 (175) and 2024 (218).
On the other hand, their May 2017 forecast (ACE of 110) strongly underestimated activity. They were on the few seasonal forecasting agencies to catch onto slightly above normal activity (based on 1950-2020 normals) in 2018 and 2019.
https://268weather.wordpress.com/2025/05/16/268weather-may-2025-update-atlantic-hurricane-season-still-projected-to-be-above-normal/-
 1
1
-
-
3 minutes ago, BarryStantonGBP said:
Levi Cowan (from Tropical Tidbits) raises significant skepticism about this report claiming AccuWeather forecasts were more accurate last year:
https://x.com/TropicalTidbits/status/1925320719732547804-
1
-
1
-
-
-
Detailed thread about recent trends in the Indian Ocean and ENSO regions, and indicators as to which seasonal models are more likely to have the right idea on ENSO situation during peak hurricane season:
https://x.com/yconsor/status/1922643952135557481-
2
-
1
-
-
10 hours ago, BarryStantonGBP said:
8 hurricanes, 4 majors expected, and a landfall-heavy year
Agreed more with these lot than most of the mainstream
https://www.spglobal.com/esg/insights/featured/special-editorial/an-elevated-2025-hurricane-season
Thanks for posting the S&P outlook, Barry. Very interesting! One of the few *data-driven* (not totally qualitative) landfall risk outlooks I have seen.
Their maps seem to suggest higher than usual activity in the central Atlantic portion of the MDR (around 40-60W) and the Bahamas area (off FL coast) as well as the Caribbean and GOM.
-
 1
1
-
-
Early indications from seasonal models favor an active Atlantic hurricane season, perhaps even hyperactive.
https://x.com/yconsor/status/1901982720378425715-
2
-
-
13 hours ago, bluewave said:
There was no real forcing in the 8-1-2 regions. It was mostly In the 4-5 regions. So the +PNA -EPO -AO Niña mismatch pattern was being driven by something else. But it’s possible that the background forcing in 4-5 may have lead to the unfavorable Pacific Jet response. Since Suffolk got 30 inches of snow with a legit MJO 8 back in January 2022. Notice how much more favorable the forcing was closer to and east of the Dateline in January 2022 than in 2025.


While I agree that extratropical (non-MJO) forcing played a significant role in the cold Jan 2025 outcome across the eastern/central US, we need to be careful using VP averaged across an entire month. Subseasonal variability clearly played a role here.
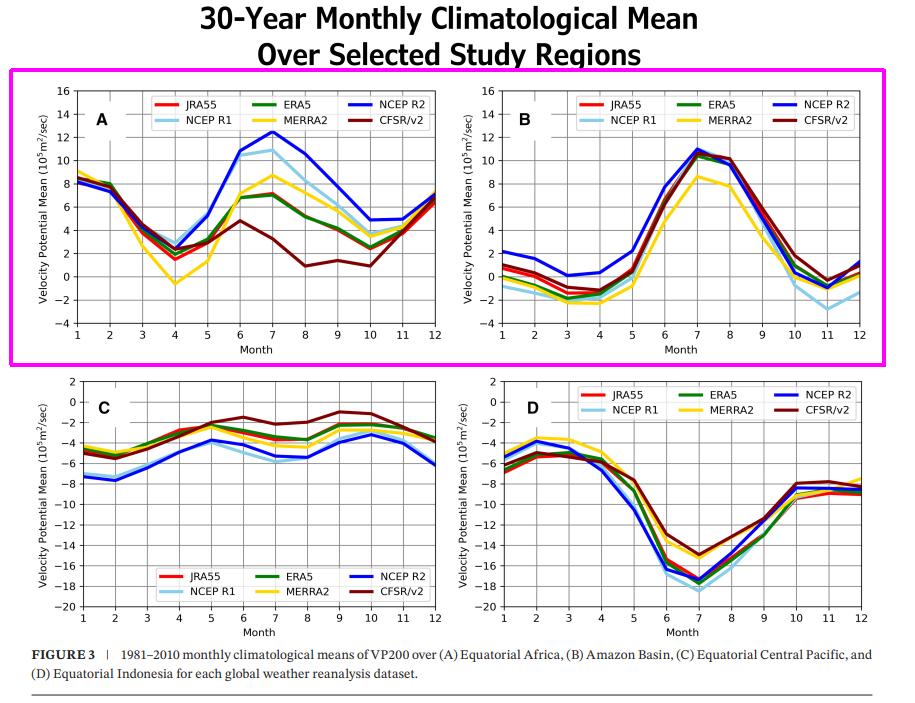
In addition, the NCEP reanalysis has some notable biases in VP - it tends to show overly positive VP anomalies near C/S. America and Africa. See Stanfield et. al 2024, A Climatological Analysis of Upper-Level Velocity Potential Using Global Weather Reanalysis, 1959–2020: https://rmets.onlinelibrary.wiley.com/doi/full/10.1002/joc.8659
The vast majority of the cold anomalies in the eastern/central US occurred in the first two-thirds of Jan. From around Jan 23 onward it turned warmer than normal.
The Jan 1-10 and Jan 11-20 VP anomalies show -VP anomalies migrating from the central/eastern Pacific and W. Atlantic, to the e. Atlantic and w. Africa. The magnitude is not as high as the negative anomalies that developed from the eastern IO to Maritime Continent in the Jan 21-31 period. However, especially in the Jan 11-20 period I would argue the MJO had a significant role, given the coherent wave of -VP (and corresponding +VP across the c/e. Pacific) that developed.
-
4
-
1
-
-
3 hours ago, NorthShoreWx said:
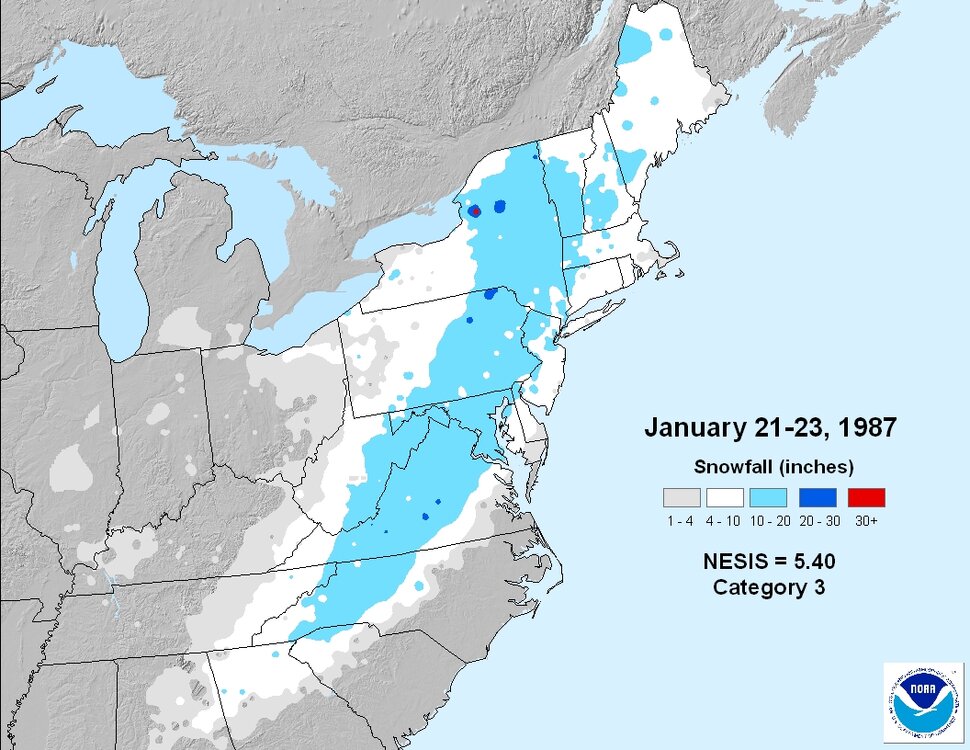
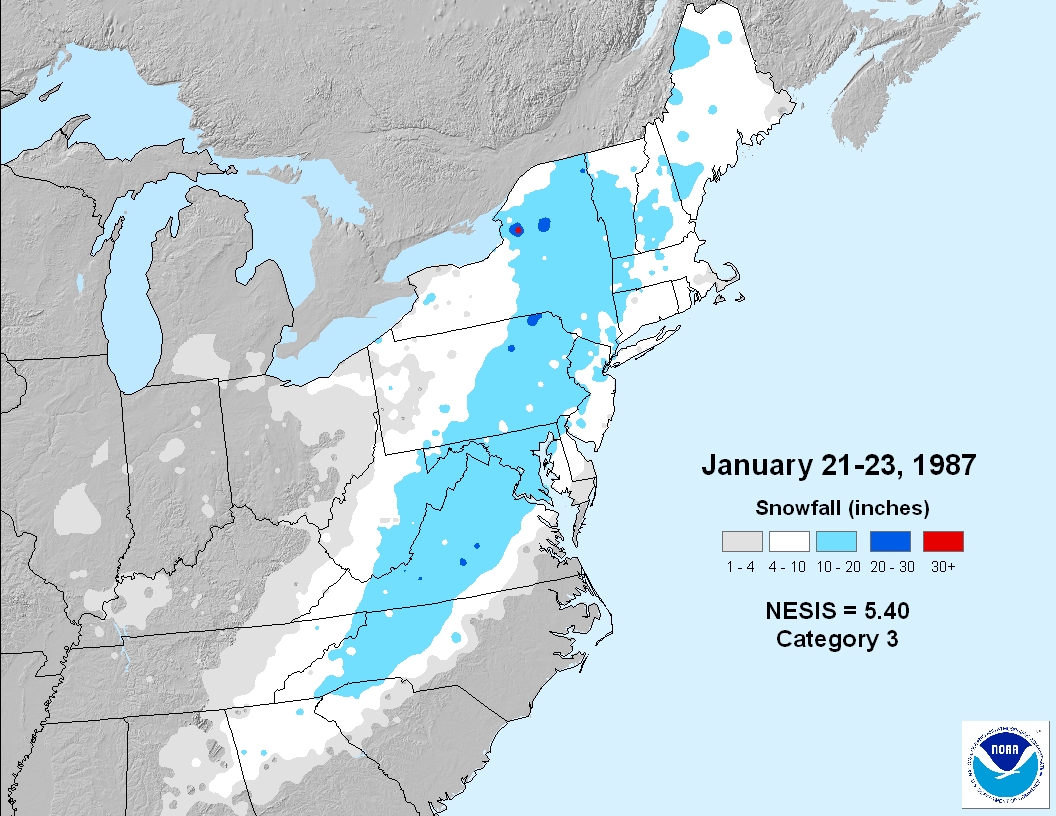
Your memory is failing you. It occurred during a work day during a LIRR strike with no train service. The traffic chaos on LI was epic. There might not have been any school closings because the snow started around 9am. The afternoon change to rain east of about Rt 135 did little to help.
The Jan 22, 1987 snowstorm you are referring to is one of the main events that got me interested in weather. I grew up on the North Shore of LI (Roslyn) and I recall the forecast being for an inch or two, then quickly changing to rain. Instead snow piled up at 1-2" per hour and there was never a change to plain rain, just a little freezing drizzle at the end.
As Ed said, it was traffic chaos. I was in second grade at the time and we were stuck at school for about 6 hours! The plows couldn't keep up with the snow and the hills on the roads in/around Roslyn made things even worse.
-
3
-
-
6 hours ago, snowman19 said:
So far, despite some early indications back at the end of November that it would couple, the strong SPV has remained decoupled from the troposphere. All indications are that it stays strong, which fits the -ENSO/+QBO/solar max states. Question is, like you mentioned, does it continue to stay decoupled? @bluewaveSome additional context to the unusual nature of this cold outbreak stratosphere-troposphere wise:
https://bsky.app/profile/drahbutler.bsky.social/post/3lekmlyusmc25-
4
-
-
2 hours ago, PhiEaglesfan712 said:
The last week of December doesn't look like a torch after all. I don't think we're going to get the really cold Jan 4-17 the models are showing. It will probably be closer to normal.
No way are we getting anything close to a 13-14 type winter, which was wall-to-wall cold from Jan-March. I think we're going to get something closer to 20-21.
Indeed, as we get closer in the guidance is correcting to a stronger high pressure and CAD wedge for the last week of Dec.
https://x.com/yconsor/status/1870772344031268877-
3
-
-
-
-
MJO phases 5 and 6 are far from a guarantee of warmth in the eastern US.
https://x.com/commoditywx/status/1866191470287286392
https://x.com/bamwxcom/status/1866093279948763384
-
5
-
-
19 hours ago, GaWx said:
Nov NOAA PDO just came in about where I expected (based on adjusting WCS’ PDO) at -3.24 (rise of 0.54 from Oct). This compares to the WCS’ Nov of ~-2.10. So, this is only the 2nd time since 1851 with three sub -3 PDO months in a row. The other time was in 1894 (6 months earlier that year than 2024). We actually only barely missed 7 months in a row of sub -3 as the last 7 have all been sub -2.90:
-2.99 -3.16 -2.99 -2.91 -3.54 -3.78 -3.24
https://www.ncei.noaa.gov/pub/data/cmb/ersst/v5/index/ersst.v5.pdo.dat
Current daily NOAA PDOs are likely in the low -3 range.
Per Eric Webb, the PDO has limited influence and limited usefulness for subseasonal predictability (especially in a winter like this with a strong Indo-W Pacific warm pool).
https://x.com/webberweather/status/1864088518886322455
https://x.com/webberweather/status/1864091992386605400
https://x.com/webberweather/status/1864095069449699705
https://x.com/webberweather/status/1864150597710369022
Also interesting comments on PDO's limited usefulness as a teleconnection here:
https://x.com/_WxPhil_/status/1864148237403263157-
1
-
-
-
Some short-term drought relief possible this weekend: https://x.com/yconsor/status/1848326240068837640
-
1
-
-
Thread on important short-term northward/stronger trends noted regarding Beryl, and how this influences her potential TX/MX impacts:
https://x.com/yconsor/status/1808853711629746332-
3
-


2025 Atlantic Hurricane Season
in Tropical Headquarters
Posted
Please post the link for the vertical instability graphic. Thanks