

mitchnick
-
Posts
26,299 -
Joined
Content Type
Profiles
Blogs
Forums
American Weather
Media Demo
Store
Gallery
Posts posted by mitchnick
-
-
12 minutes ago, GaWx said:
Hey Mitch,
I’m confident that you realize that a model bias in whatever direction doesn’t mean it’s almost never going to miss in the opposite direction. A typical model bias could be something like verifying consistent with the bias 65% of the time while verifying the opposing way 20% of the time and being close 15% of the time. For example, the April 30th CANSIPS forecast for May was actually too warm, especially in Midwest/OH Valley/NE (though a bit too cool E VA S to FL):4/30/25 CANSIPS for May ‘25 (in C vs 1981-2010):

Actual May ‘25 (in F) vs 1981-2010:
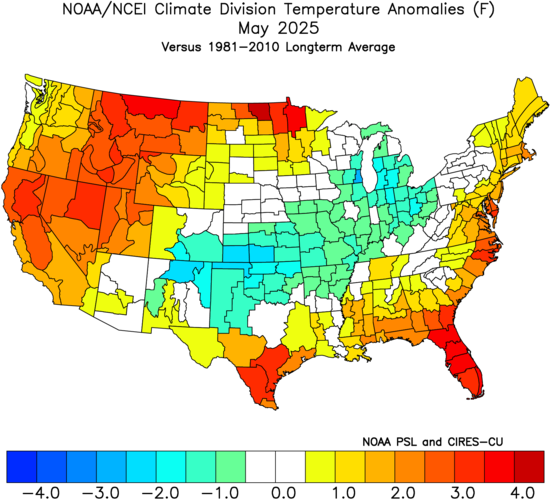
But the 2/28/25 CANSIPS verified as being significantly too cold for Mar ‘25 vs the reality of a very warm month. It was mainly warmer than normal but not nearly warm enough in most of the E US.
Whereas CANSIPS was much too warm in Jan and too warm in Feb, it was much too cold in Dec.
That's why I like the Cansips...it can be used to argue both sides pretty convincingly! But seriously, as I said in my last post, I think seasonal model trends for a future season, and not a 1 month forecast, are worth following.
-
 1
1
-
 1
1
-
 2
2
-
-
1 minute ago, bluewave said:
The one particular month shows the greater bias of being too cold in the Northeast the same as the collection of all the months averaged out we have been discussing.
Seasonal models beyond a month out are usually a crapshoot even when looking at the 500mb forecasts and not taking into account the general temperature biases for said patterns.
The last time one of these seasonal models had a great winter forecast in October and verified close was the JMA winter 13-14 forecast with the wall of Pacific blocking which verified.
Seasonal models by definition are intended for periods beyond 1 month, which is why I consider weeklies as being more accurate for 1 month, though flawed too as we know. But that's why I look at forecast trends in the seasonal models as a whole as a better method than taking the forecasts at face value.
-
1
-
-
1 minute ago, 40/70 Benchmark said:
If it were a wall-to-wall inferno and I posted it, do you think snowman would have posted a giggling emoji and called me Bluewave? He simply would have liked the post and perhaps made a passing comment about the IOD coupling with La Niña as added support.
Agreed, but you know as well as I do you'd never would have posted first! Lol
-
 1
1
-
-
Just now, 40/70 Benchmark said:
How did I know posting the season consensus would start debate because it isn't a blow torch.

I didn't want to say it, but thought the same thing.
-
2
-
-
3 minutes ago, bluewave said:
You are using an example of the CanSIPS missing the 500mb forecast. My observation is based on the months when the 500mb forecast is reasonably close. Go back to December 2024 to see what I am talking about.
Ok, we're back to the 1 particular month issue again, so you'd have to do some kind of compilation of comparing 1 month forecasts verifications.
But I've always considered the Cansips a seasonal model even though it forecast period begins at 1 month. For purposes of this discussion, I'm looking for forecast trends in modeling for 6 months out. And as I said, Cfs2 and Euro seasonal show similar trends in areas of at or BN as the Cansips.
-
19 minutes ago, bluewave said:
Models having inherent biases have nothing to do with cherry picking. They are a function of the way the models work. The CanSIPS is well known for showing too much cold where the troughs are forecast especially in the East. One of the few parts of the country that can verify colder than these seasonal forecasts is the Rockies and Upper Plains. But that doesn’t do the posters living in the I-95 corridor any good.
Plus the forecasts beyond one month are a crap shoot anyway. So don’t get too attached to what any of the seasonal models are showing now for next winter. The CanSIPS and other models don’t have a ton of skill forecasting the 500mb pattern more than 30 days out. So we have to wait until the 1st of each month for the monthly forecast. Then adjust the temperatures warmer in the spots where a trough is indicated for models like the CanSIPS. With the exception of Western areas which can sometimes verify colder. But usually not the East.
The one model truism over the years is that the Southeast Ridge or general 500 mb heights in the East verify higher than forecast. This is why the heavy snows which were indicated as far south as NY Metro last February got pushed up into Canada from Toronto to Montreal.
So understanding these model biases is essential if you want to have a better handle on the medium to long range and seasonal forecasts.
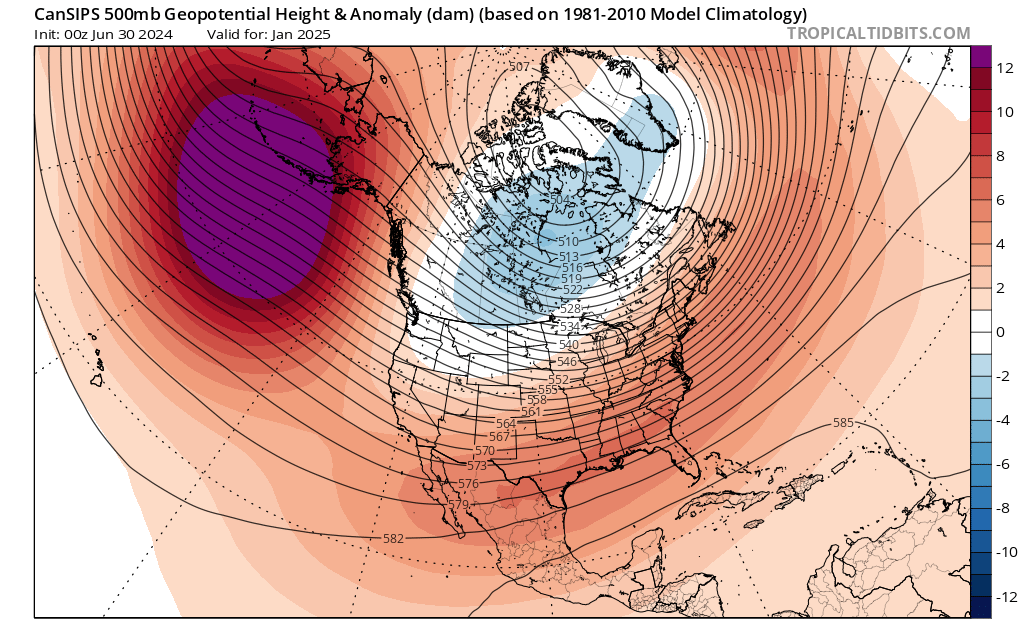
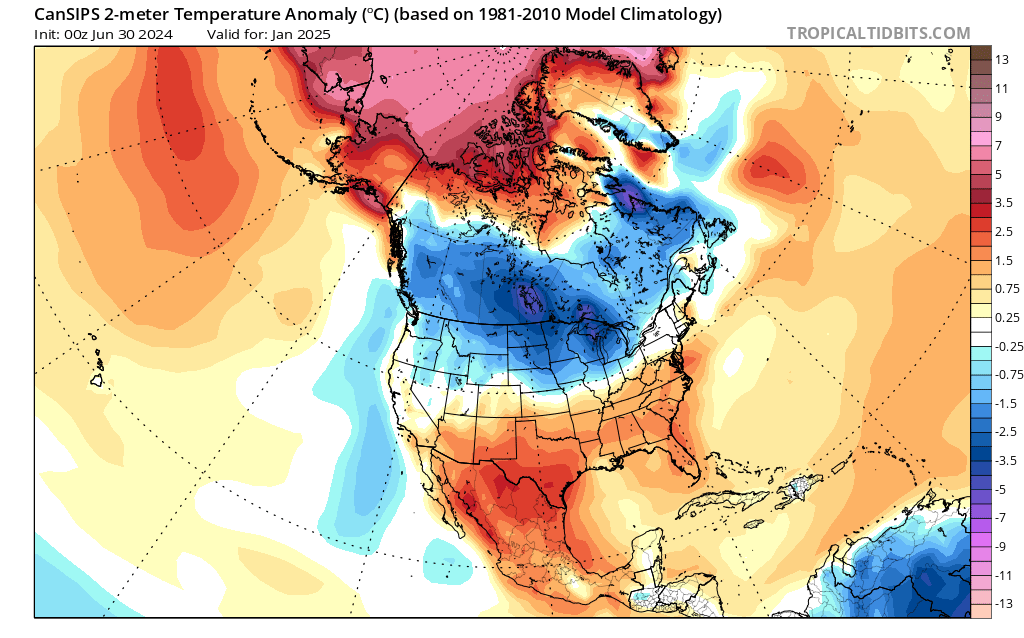
Cansips is not perfect, and I never said it was. But your statement it's biased in one direction doesn't always hold true. Ask the central, southern, and eastern areas of the conus about 1/25.
Top map Cansips 500mb 1/25 forecast from 7/24
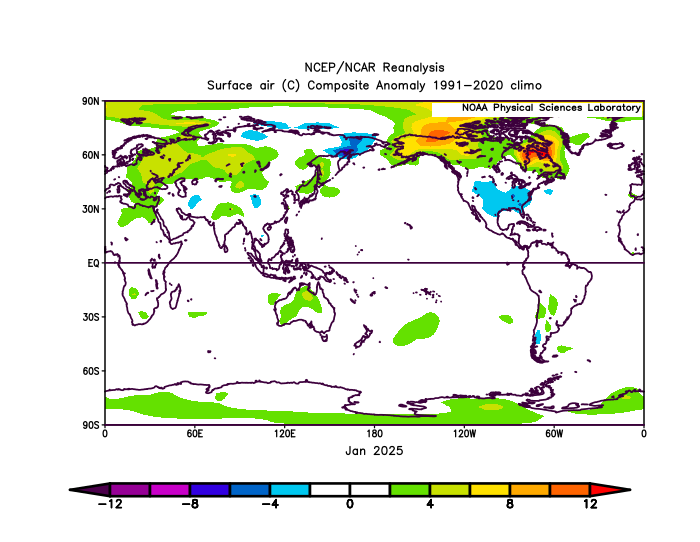
Middle map 2m 1/25 forecast from 7/24
Bottom map actual 1000mb map from 1/25
I'd like to know how many other seasonal models were showing any BN temps in January from their 7/24 forecast, other the Pac NW.


-
1
-
1
-
-
1 hour ago, bluewave said:
No problem. We need some levity in here after what has happened since 2018-2019. My only comment on the CanSIPS is that temperatures never match the forecasted 500 mb pattern.
Just look at the one month forecast for June to see what I am talking about. The 500mb forecast for June wasn’t bad. But the cold pool to the south was way overdone.
So this has also been happening with the La Niña winters showing so much cold to the north around the Great Lakes, Northeast, and Canada. If that Southeast Ridge verifies like it’s showing for the winter, there will be much less cold to the north and the warmth to the south will be much more expansive.
500 mb pattern forecast not bad


Cold pool to the south never verified


But we can always pick out model errors with every model, short, medium, and/or long range. Cansips had a "relatively" decent forecast last winter and now the ever warm Cfs2 and arguably the latest Euro seasonal are looking similar to its forecast for this winter. They could all be right or wrong, but to pick out any one forecast from any one of them and say "it was wrong here, so I don't trust it" is tantamount to saying all modeling is useless. If that's the way you feel, that's fine because sometimes they are, but to cherry pick one forecast doesn't support your case one iota it's going to be wrong.
-
1
-
-
Remember. The Euro is giving us 3 month averages on each forecast map, so keep that in mind when looking at the forecasts. The trend is what you need to consider as well as actual numbers.
-
6 minutes ago, mitchnick said:
July updated Euro seasonal still going with a La Nada:
Here's a link to all the forecast parameters. It has cooled temps since the last run across NA and has a normal temps in Canada vs last run lending credence to the Cansips.
Remember. The Euro is giving us 3 month averages on each forecast map, so keep that in mind when looking at the forecasts. The trend is what you need to consider as well as actual numbers.
-
2
-
-
July updated Euro seasonal still going with a La Nada:
Here's a link to all the forecast parameters. It has cooled temps since the last run across NA and has a normal temps in Canada vs last run lending credence to the Cansips.
-
2
-
-
15 minutes ago, 40/70 Benchmark said:
Right...its not a perfect 1 correlation because nothing is...doesn't mean there isn't predictive value to be gleaned.
13 minutes ago, Stormchaserchuck1 said:There's enough data where it works as per the correlation coefficient.
It's /1 so 0.1 is +10%, or 55% chance. 0.3 is +30%, or 65% chance. 0.5 is +50%, or 75% chance. Etc.
I get it, but it's going to miss a whole lot of changes is SSTA, solar, and other variables before winter arrives, so at this range it's hard to get excited one way or the other. Then again, it's hard to get excited over anything at this range.
-
2 hours ago, Stormchaserchuck1 said:
Jan - March 6-8 months after a +AO July


Looks like there is tendency for a -EPO March.
Roll forward didn't work last year, so we're back to "who knows."
-
15 minutes ago, TheClimateChanger said:
If the current long-term trend were to continue, we would be seeing mean January temperatures of about 39.5F in northeast Ohio and about 44F in coastal New York. Those are warmer than March averages today. Again, that is only extrapolating the ongoing trend. The reality is that the trend is actually accelerating as @bluewavepointed out. Not out of the question, we see warming as high 15-20F per century in the coming decades. Just unbelievable.
Great news. Think of the savings on heating.
-
Don't know if anyone noticed or if it's been posted previously, but cyclonicwx.com now offers some decent OISST worldwide SST and SSTA graphs for the last 10 years that make for easy reference with each area broken down separately.
Click on "OISST" in the banner near the top.
-
3
-
1
-
-
2 hours ago, snowman19 said:
The summer of 2011 was absolutely brutalAlmost as brutal as the 11/12 winter for those who like snow and cold.
-
1
-
-
Loud, windy storms around 10:30-11 last night left exactly an inch.
Tired of lawn mowing...as every year.
-
Updated Cansips just out, though dry for the winter, keeps it BN most areas north of the Mason-Dixon line. This is a link starting in November.
Summer is reasonably tolerable over most of the conus too.
500mb starting November
Enso starting November
-
2
-
-
Updated Cansips just out, though dry for the winter, keeps it BN most areas north of the Mason-Dixon line. This is a link starting in November.
Summer is reasonably tolerable over most of the conus too.
500mb starting November
Enso starting November
-
13 hours ago, bluewave said:
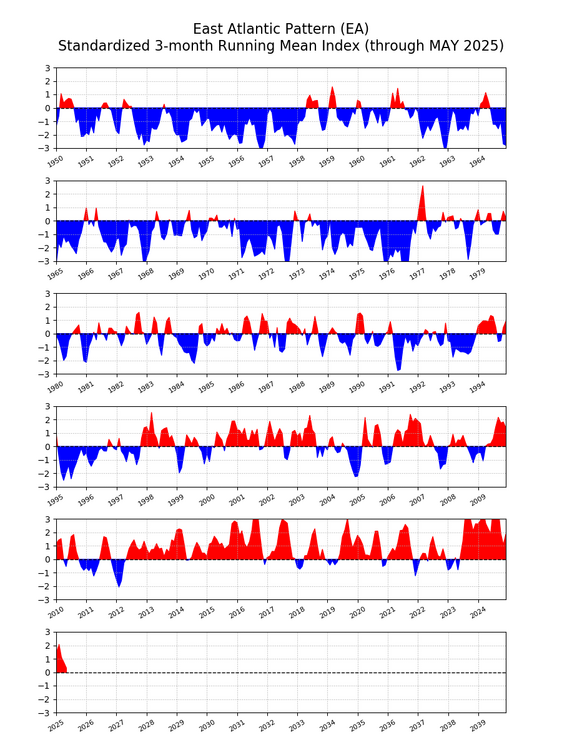
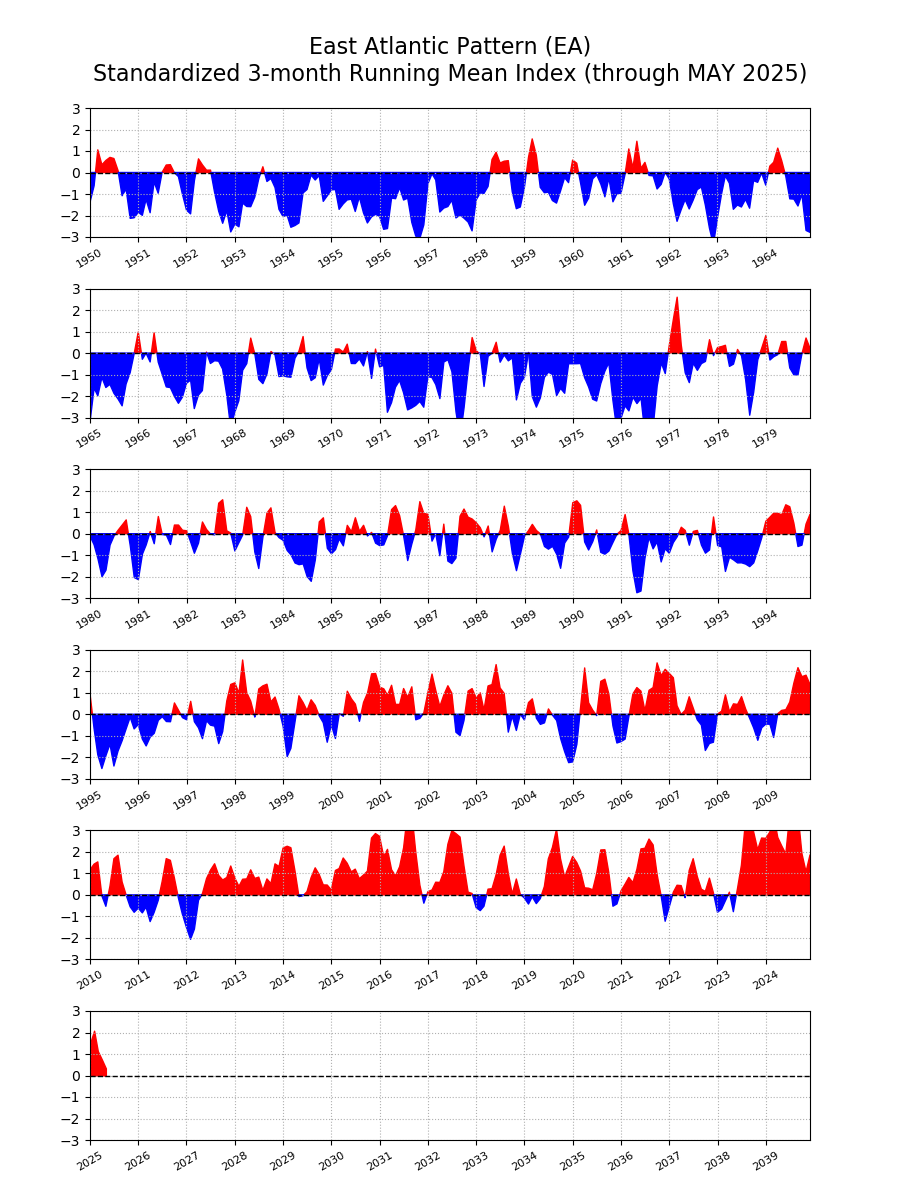
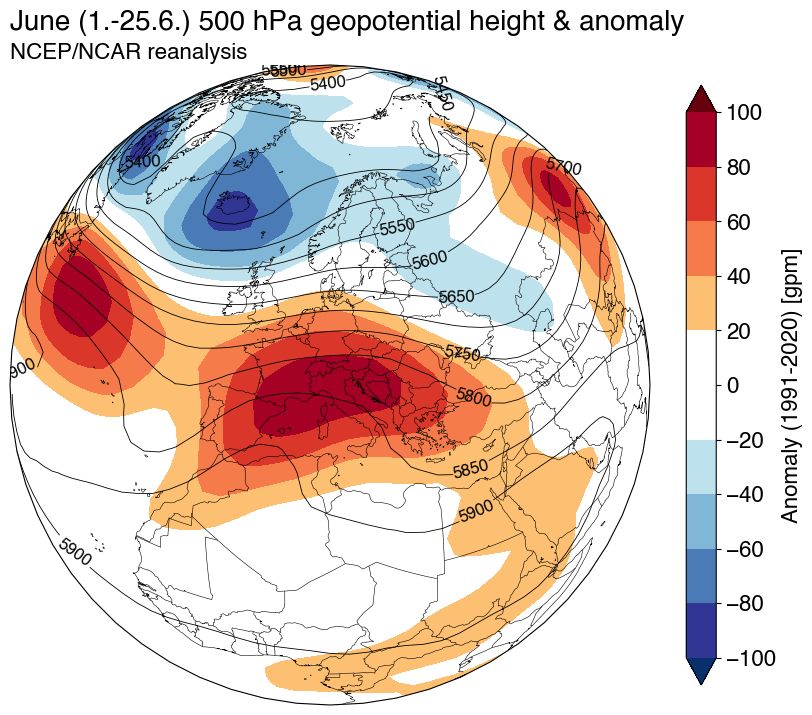
My guess is that this that the expanding subtropical ridges across the planet from Japan to the Eastern US and Europe as the climate warms are driving these multiple records. Notice how the EA has become so positive over time. So the +NAO could be driven by the expansion of these ridges. Plus the feedback from the record marine heatwaves east of Japan across the Atlantic to the Mediterranean.
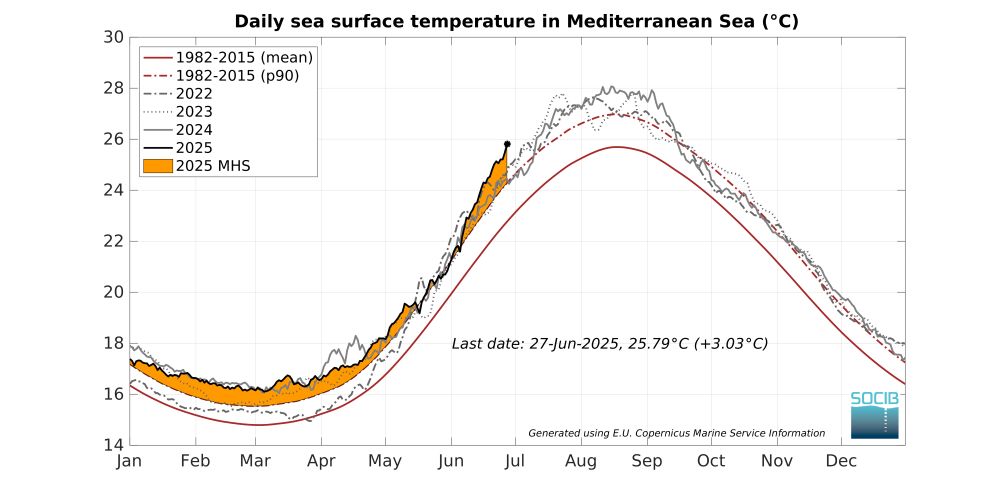
 The Mediterranean is now warmer than it typically was in August during the recent 1982–2015 climate period. And it’s no wonder when you look at the atmospheric circulation: a strong upper-level ridge has parked over the western Mediterranean, allowing the marine heatwave to develop.ALTALT111
Good news. That should give Japan second thoughts before attacking Pearl Harbor again.

-
1
-
-
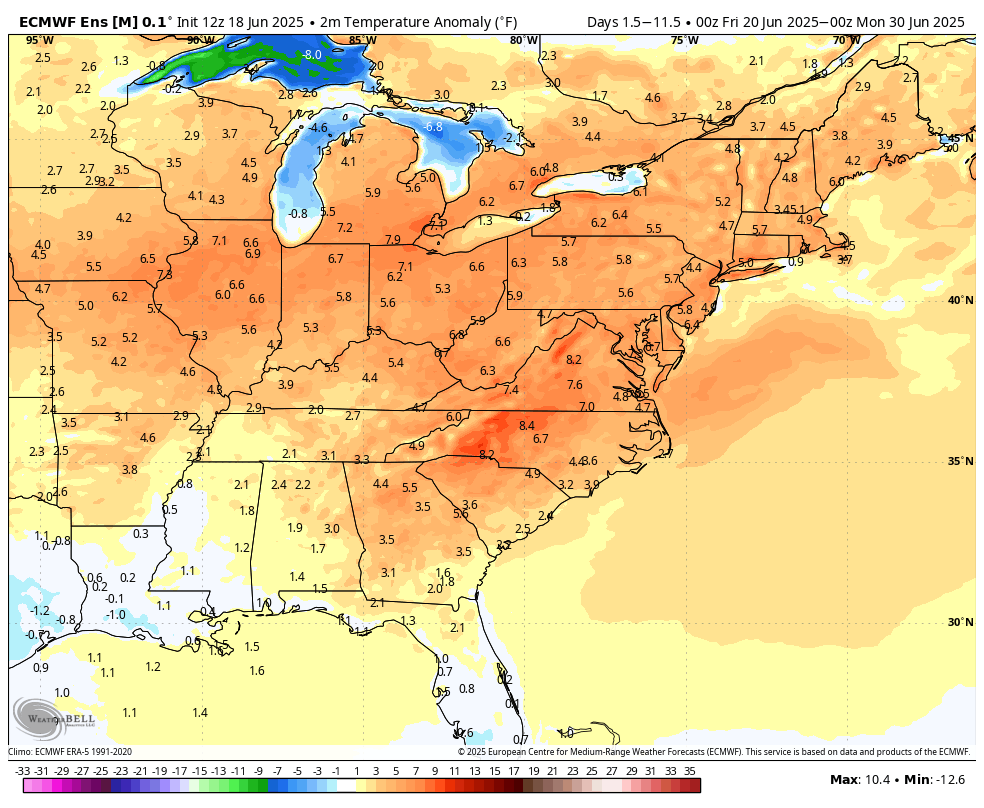
15 hours ago, Weather Will said:
WB 12Z EPS 10 day dry and hot period after tomorrow.

Not all, but my recollection, selective maybe, is that max AN temps often occur with a heat wave in June in Niñas then not so AN the rest of the summer. I guess we'll see if my memory is tainted with a wishcast.
-
1
-
-
14 minutes ago, frd said:
Landscaping now with Gatorade in hand. Today if you are outside working you needs extra hydration and electrolytes.
That's cheating!
-
3
-
1
-
-
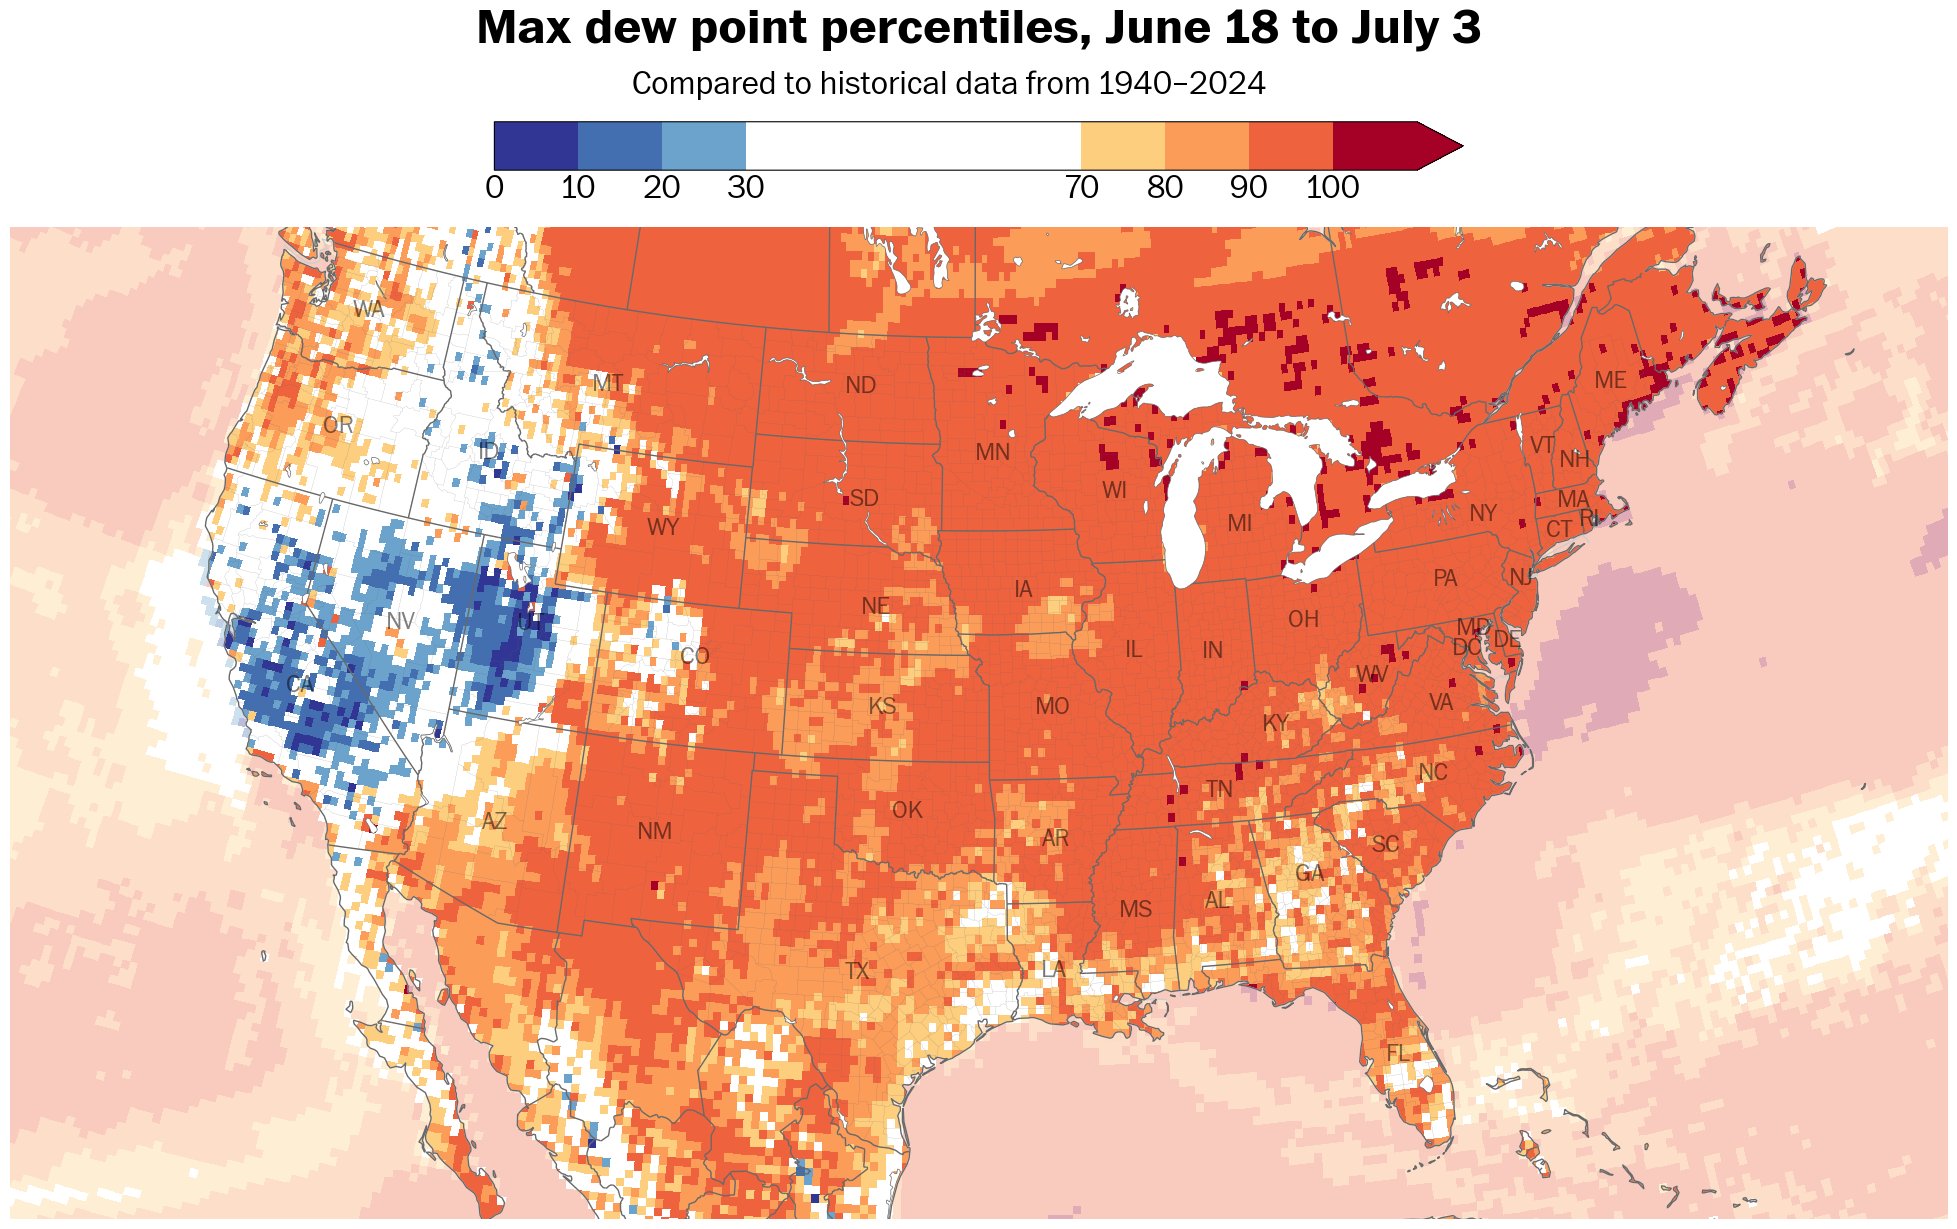
47 minutes ago, frd said:
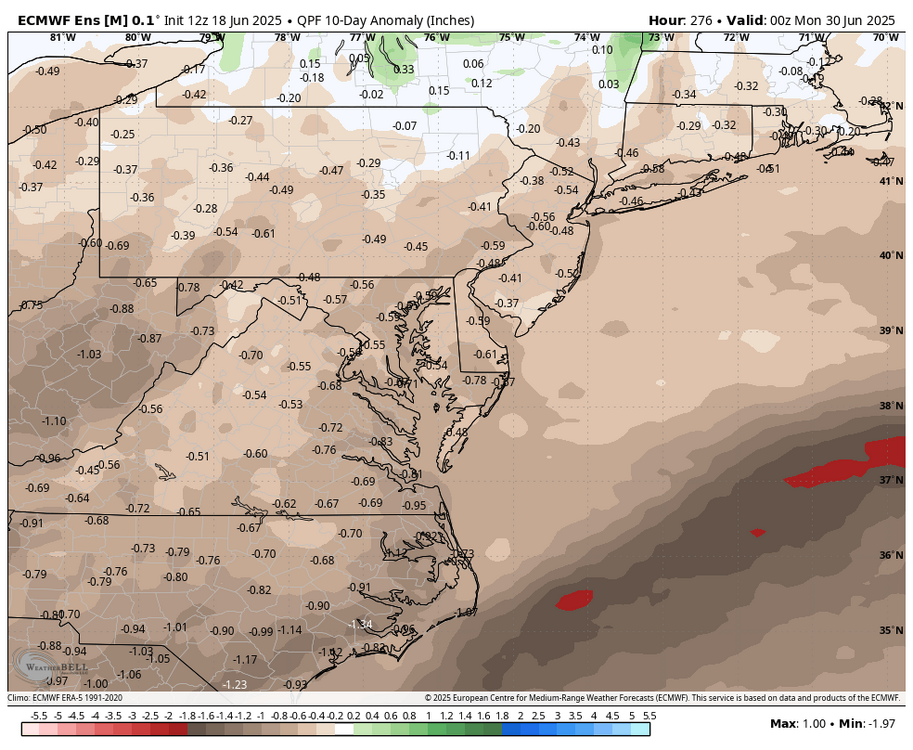
Not only hotter, but more moist and humid as dew points reach the 90 th percentile, or greater, over a vast area of the US.
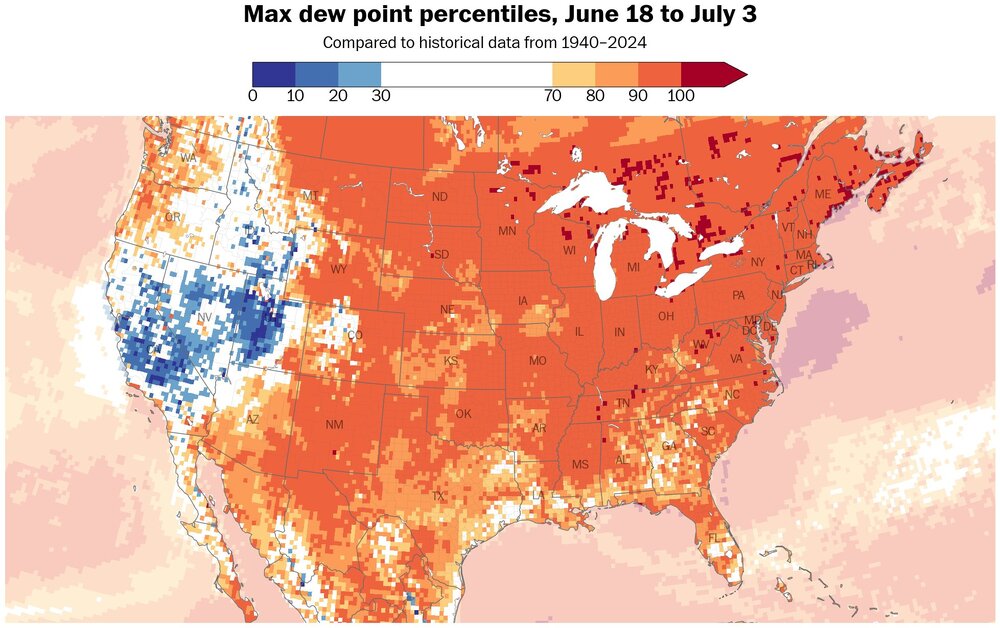
It's miserable, typical BWI weather up here 72dp. Just mowed the grass like a true idiot, but gotta' stay in shape for snow shoveling in the upcoming BIG winter!

-
2
-
 1
1
-
 1
1
-
-
Cfs2 pretty consistent (2+ weeks) with around normal temps to below in the east for the rest of the summer, with at or above rainfall. Basically, a continuation of what we've been seeing. This is fairly different from recent summers, so I wonder whether it's a "hint" for a change in the winter Niña winter pattern.
-
1
-
-
If we get a normal/cool, wet summer, that sure is different from any summer in years. Hopefully, that means a better winter.
P.s. Sorry Voyager

-
1
-


2025-2026 ENSO
in Weather Forecasting and Discussion
Posted
I hadn't posted this, but meant to relating to the trend issue. Top pic is the Euro seasonal June temp forecast for OND and the bottom is July's forecast for same period. I know 2 months aren't a trend, but again, it's moving toward the Cansip with a non-furnace Canada into the Conus. Plus, AN areas aren't going wild.