
MegaMike
-
Posts
432 -
Joined
-
Last visited
Content Type
Profiles
Blogs
Forums
American Weather
Media Demo
Store
Gallery
Posts posted by MegaMike
-
-
13 minutes ago, BullCityWx said:
Durham is the best place to live in the Triangle. Where are you going to be working? Do you have a place to live already? I’ve only seen one cottonmouth since I’ve been here. Mosquitos can be rough in the summer but the further you are from a body of water, they get better.
Good to know! I'm mainly worried about spiders navigating their way into my apartment then biting my hand off (joking). That's my greatest fear. COVID might be on that list too since it'll be difficult to acclimate to an area that's partially shutdown.
I'll be working with ORAU as private contactor for the EPA so basically graduate school all over again.
I have a 6 month lease at the Reserve at Patterson Place in Durham. Their fitness center sold me on their complex.
Would you suggest getting anything like a dehumidifier?
-
Hey guys,
I'm moving to Durham, NC in several days and I wanted to ask, how should I prepare myself
 ?
?
I lived in New England my entire life (MA->VT->CT->MA) and I'm mainly worried about insects/snakes.
To be clear, I'm not worried about the weather...
-
If you couldn't get observations, how did you create your map? I'm assuming you approximated values based on your own judgment.?.
Also, why China (out of curiosity)?
-
3 minutes ago, dryslot said:
I've been curious to know what NWS model blends are used and how there weighted on Pivotal.

Pivotal doesn't do any weighting. Snowfall is readily available by the NBM itself. I wrote about it a while ago, but the NBM's (which is an ensemble) details can be viewed here:
< https://www.meted.ucar.edu/winter/nbm32winter/ > You'll need to register first though.
At this range, I'd recommend using it. It begins losing its advantages as the event begins to develop and a consensus becomes strong.
-
 1
1
-
 4
4
-
-
19 minutes ago, dryslot said:

Looks the similar to me.
Different plotting scheme...
Pivotal defined their bins from -60 to +120 w/increments of 1 (approximating here) so 180 different bins in total. StormVista defined their bins from -40 to +120 w/increments of 5 (32 total bins). Since Pivotal plots their images with more bins, it appears finer than StormVista's plots. Assuming that both brands are plotting the same model without interpolating, there should be no difference.
-
Just now, IowaStorm05 said:
No, actually I’m in Willimantic. But it’s ripping here. I’m at 230’ elev.
Is that near the Frog Bridge? I lived on Jackson St. several months ago.
Meanwhile, I'm in West Boylston, MA for this event. I'll be moving to NC soon so I wanted to savor this [possibly] final snow event before I leave New England.
~3/4 inches of snow on the ground w/medium sized flakes. It has been snowing since roughly 10(ish)AM.
-
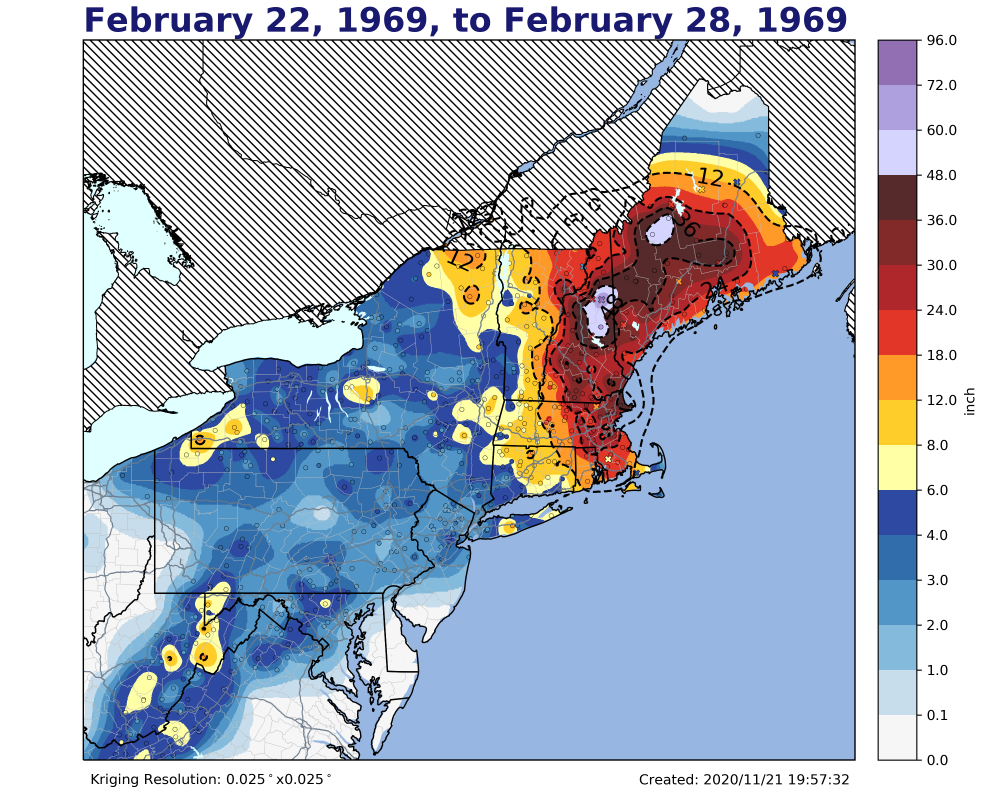
On 11/22/2020 at 8:21 AM, tamarack said:
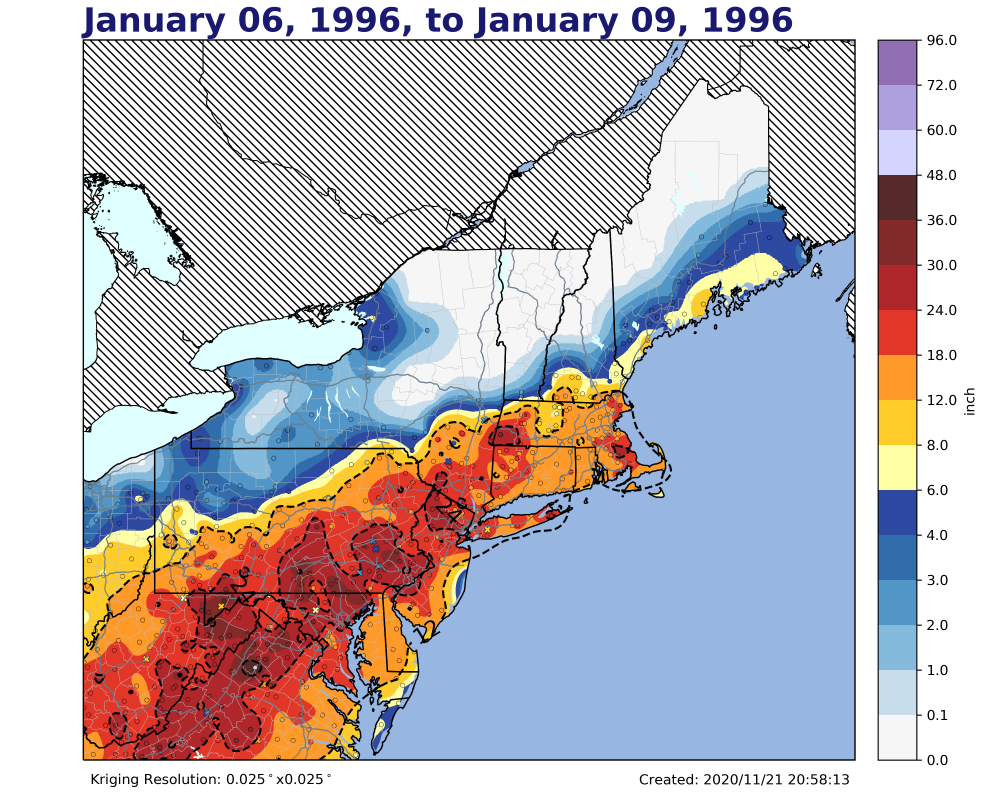
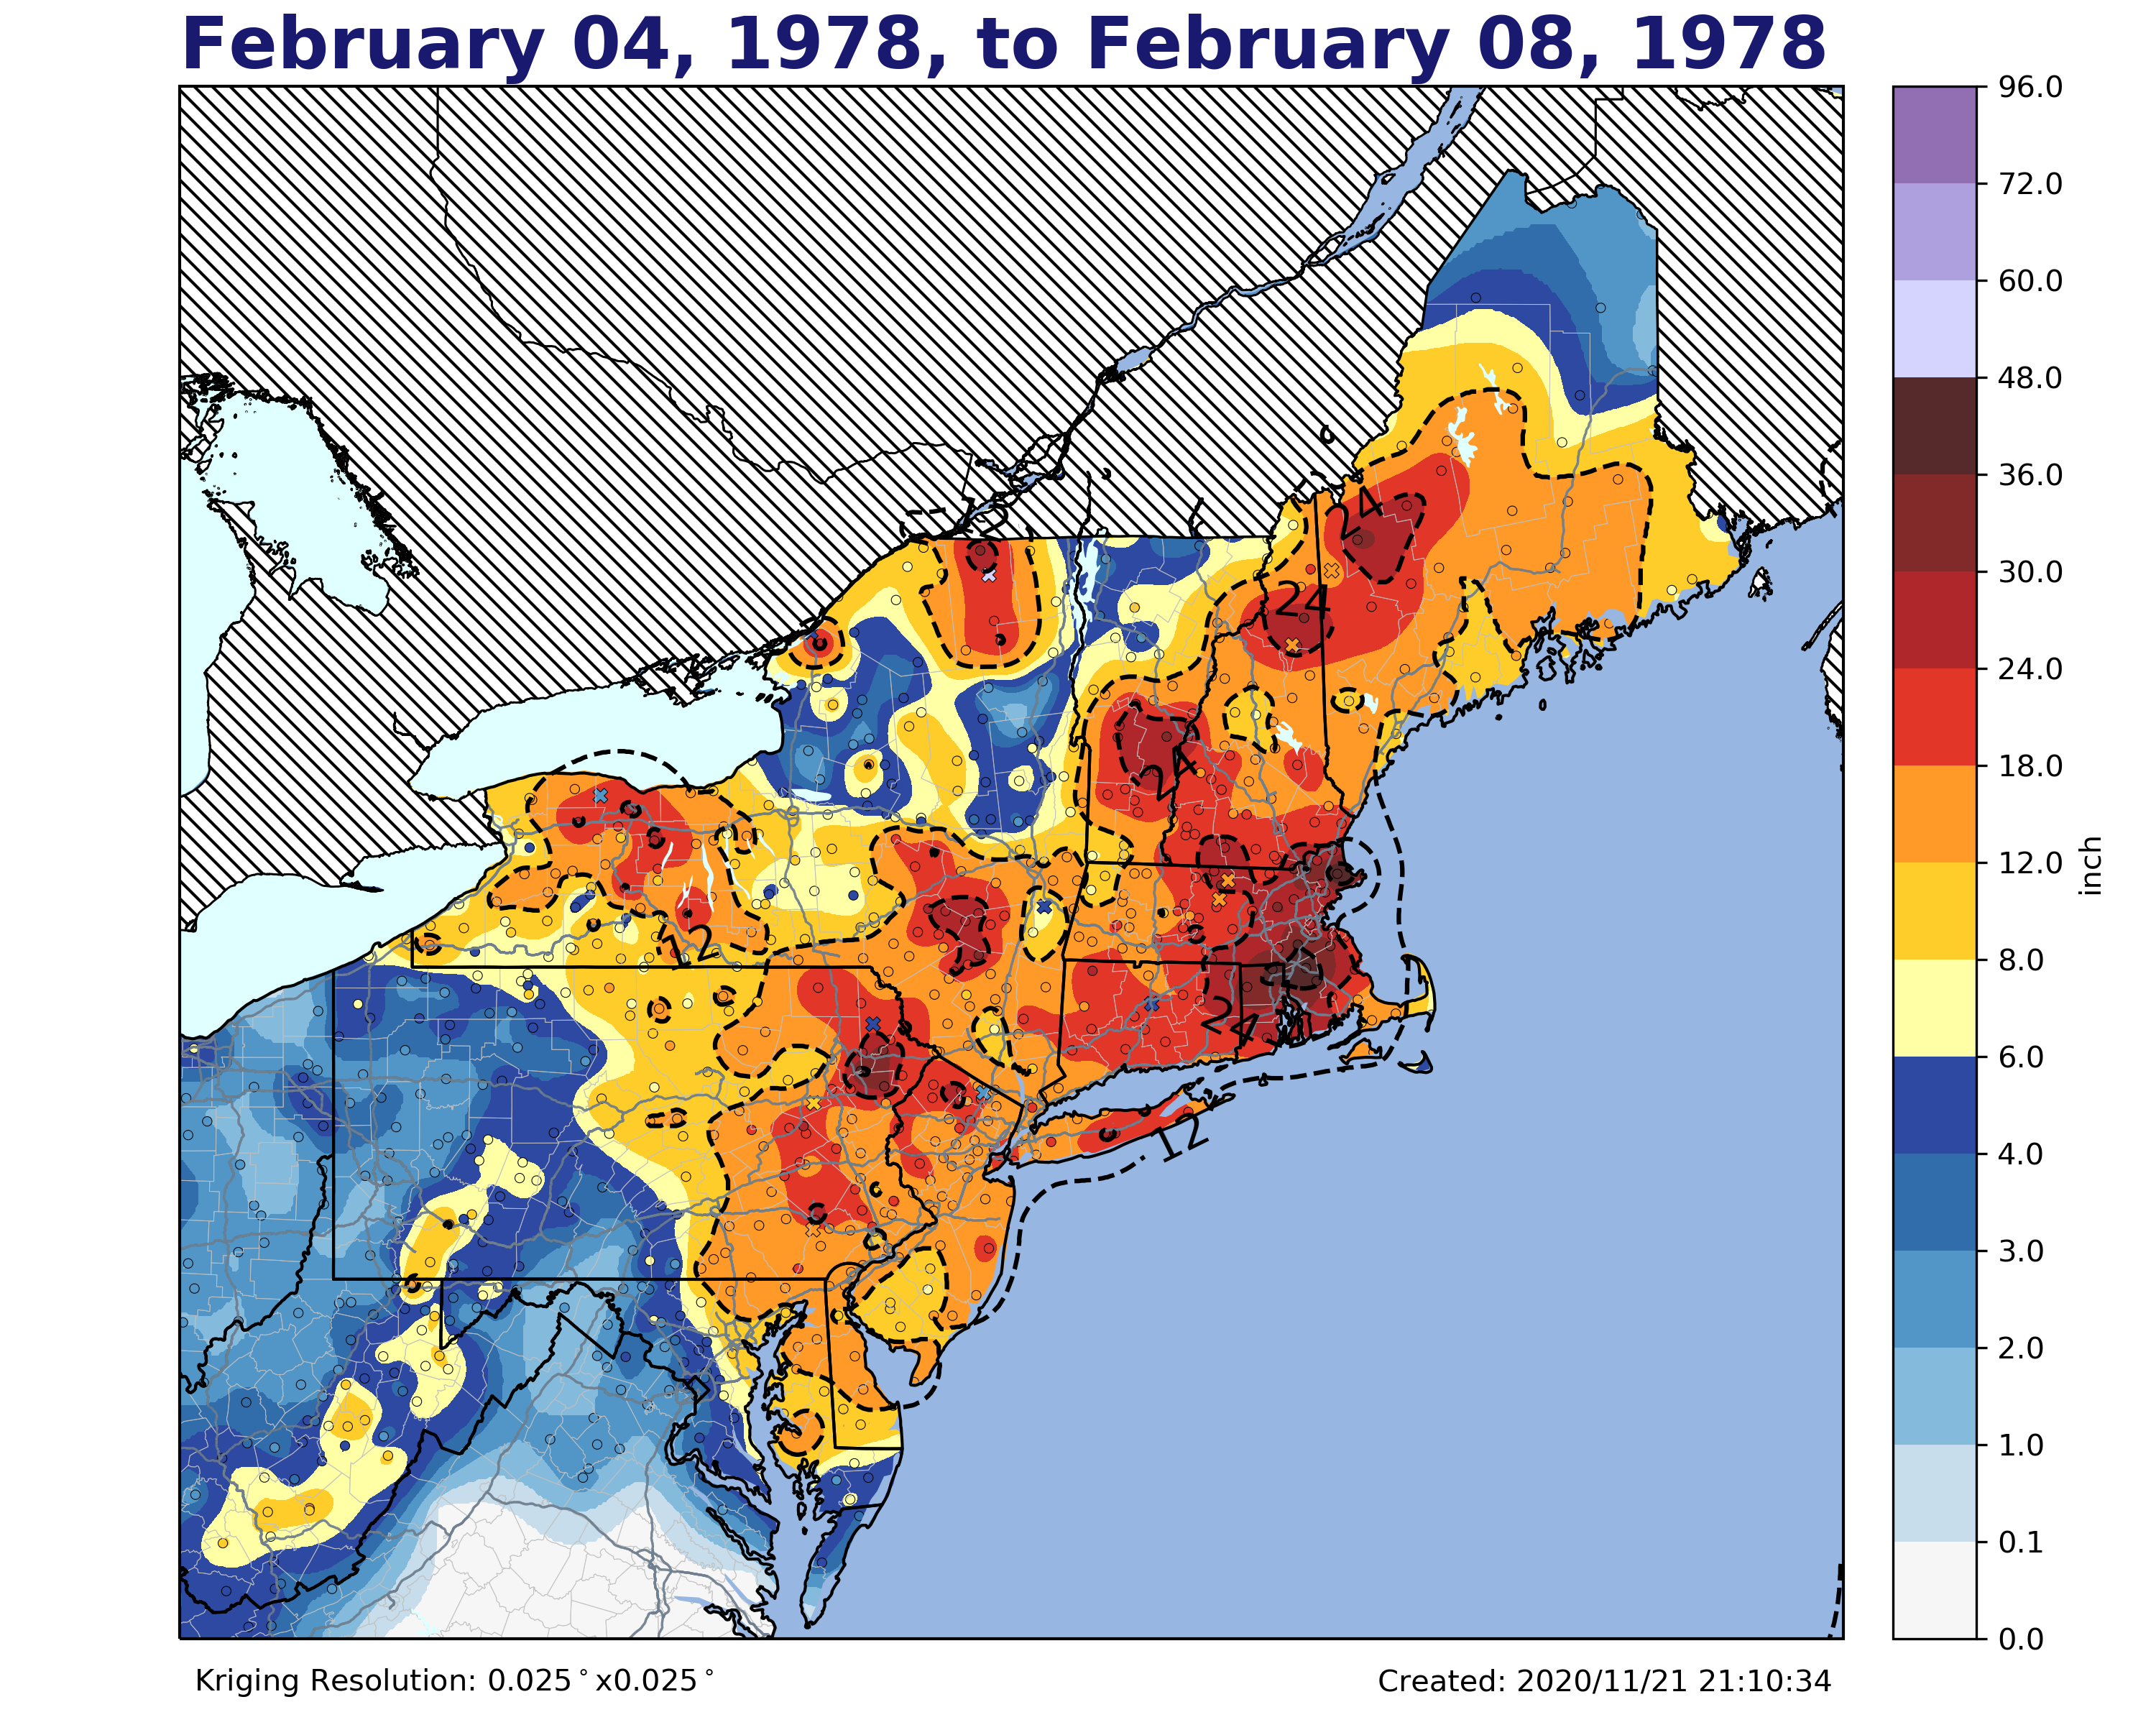
Curious about one of the sites in Maine that had 48-60 in Feb 1969- the point at the SW end of that color is Long Falls Dam (which sadly went off line in 2011 - at least I can no longer find its data.) Is the one to the NE Harris Dam? Farmington co-op's 43" is their biggest dump on record and their pack was 84" at the end - was Maine's deepest until Chimney Pond in Baxter Park reported 94" in 2017.
Some trivia - Gardiner, Maine co-op reported 12.0" but 3 miles south at our place we had 10.3" from 1.70" LE from often rimed flakes.Good call (assuming it's a dam). I had to find the point manually, but it led me to the following metadata regarding that station:
GHCND_IDENTIFIER, LAT, LON, ELEVATION_m, STATE, STATION_NAME
USC00173588 45.4586 -69.8653 253.0 ME HARRIS STN
If you're curious, that location observed 60 inches of snowfall for the denoted time range. The maximum for this event occurred at Pinkham Notch in New Hampshire. I might remove it from the map since it's pretty absurd or too wildly epic. The station observed 108 inches of snowfall
 which is 38 more than any other station lol. It was an "outlier," but based on the location, I kept it.
-
20 minutes ago, powderfreak said:
A new thread with maps like that of 200 past snowstorms?! Sounds awesome. A one-stop shop for history.
Good to hear!
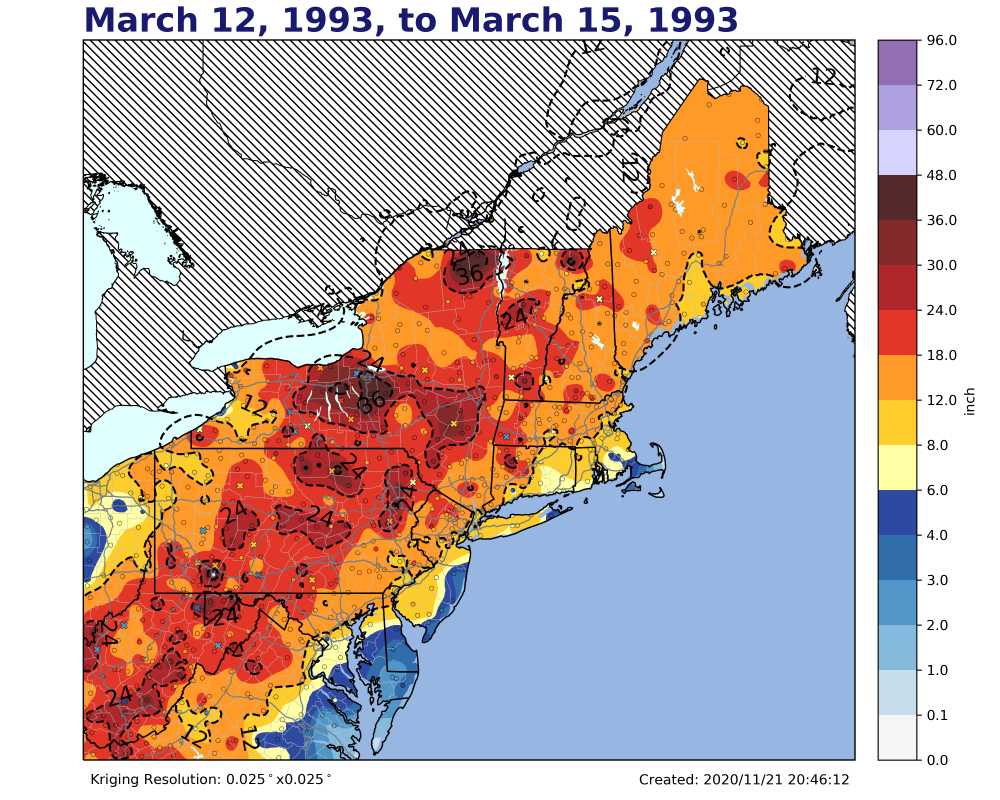
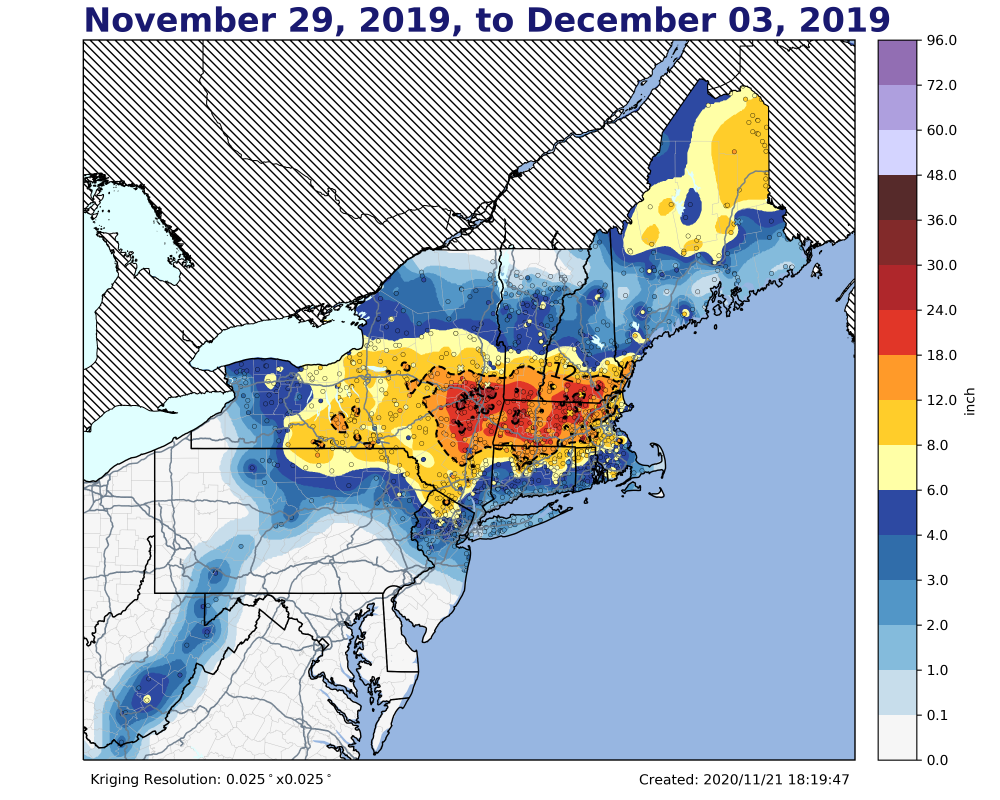
I ran the interpolation for all events listed here < https://www.ncdc.noaa.gov/snow-and-ice/rsi/societal-impacts > for the NE US. So there are 211 in total. I'm iterating from highest to smallest RSI (the sum of area/population impacted by climatological snowfall thresholds). At the moment, I have 19930312_19930315, 19960106_19960109, 19780204_19780208, and 19690222_19690228. I'm hoping I'll get some feedback for the interpolations (such as additional observations or ideas... The 4 Seasons!!!). I fully expect to redo some of these images to make them more accurate for my ultimate analysis. I'm surprised how detailed the GHCND archive is though. There's plenty of observations since 1900 for our area. Northwest Maine was the only exception so I had to be creative for that region.
I could look at other historical events too. I just need the start and end dates (even dating back to 1900).
Here are the final images I'll post until the other images process and I decide where to put them.

-
3
-
1
-
-
10 minutes ago, ORH_wxman said:
Yeah feel free to start a new thread for it. Prob the easiest way.
Maybe @dendrite can chime in.
Great! Thanks, Will!
dendrite, you can PM me.
-
Just now, ORH_wxman said:
This is pretty nice. One thing I personally like is seeing a few number values plotted on the actual map but not sure if that’s too difficult if you have so many obs.
Thanks!

I tried to superimpose the observations onto the map, but it caused too much clutter. It was impossible to view numeric observations clearly. That's why I chose to use a color scale for the symbology instead. I can add the text, but I'd have to focus on smaller territories as you mention.
Is there a place I can store these plots somewhere in the forum (maybe a new thread)? I have 208 other plots I'd like to upload once the script finishes.
-
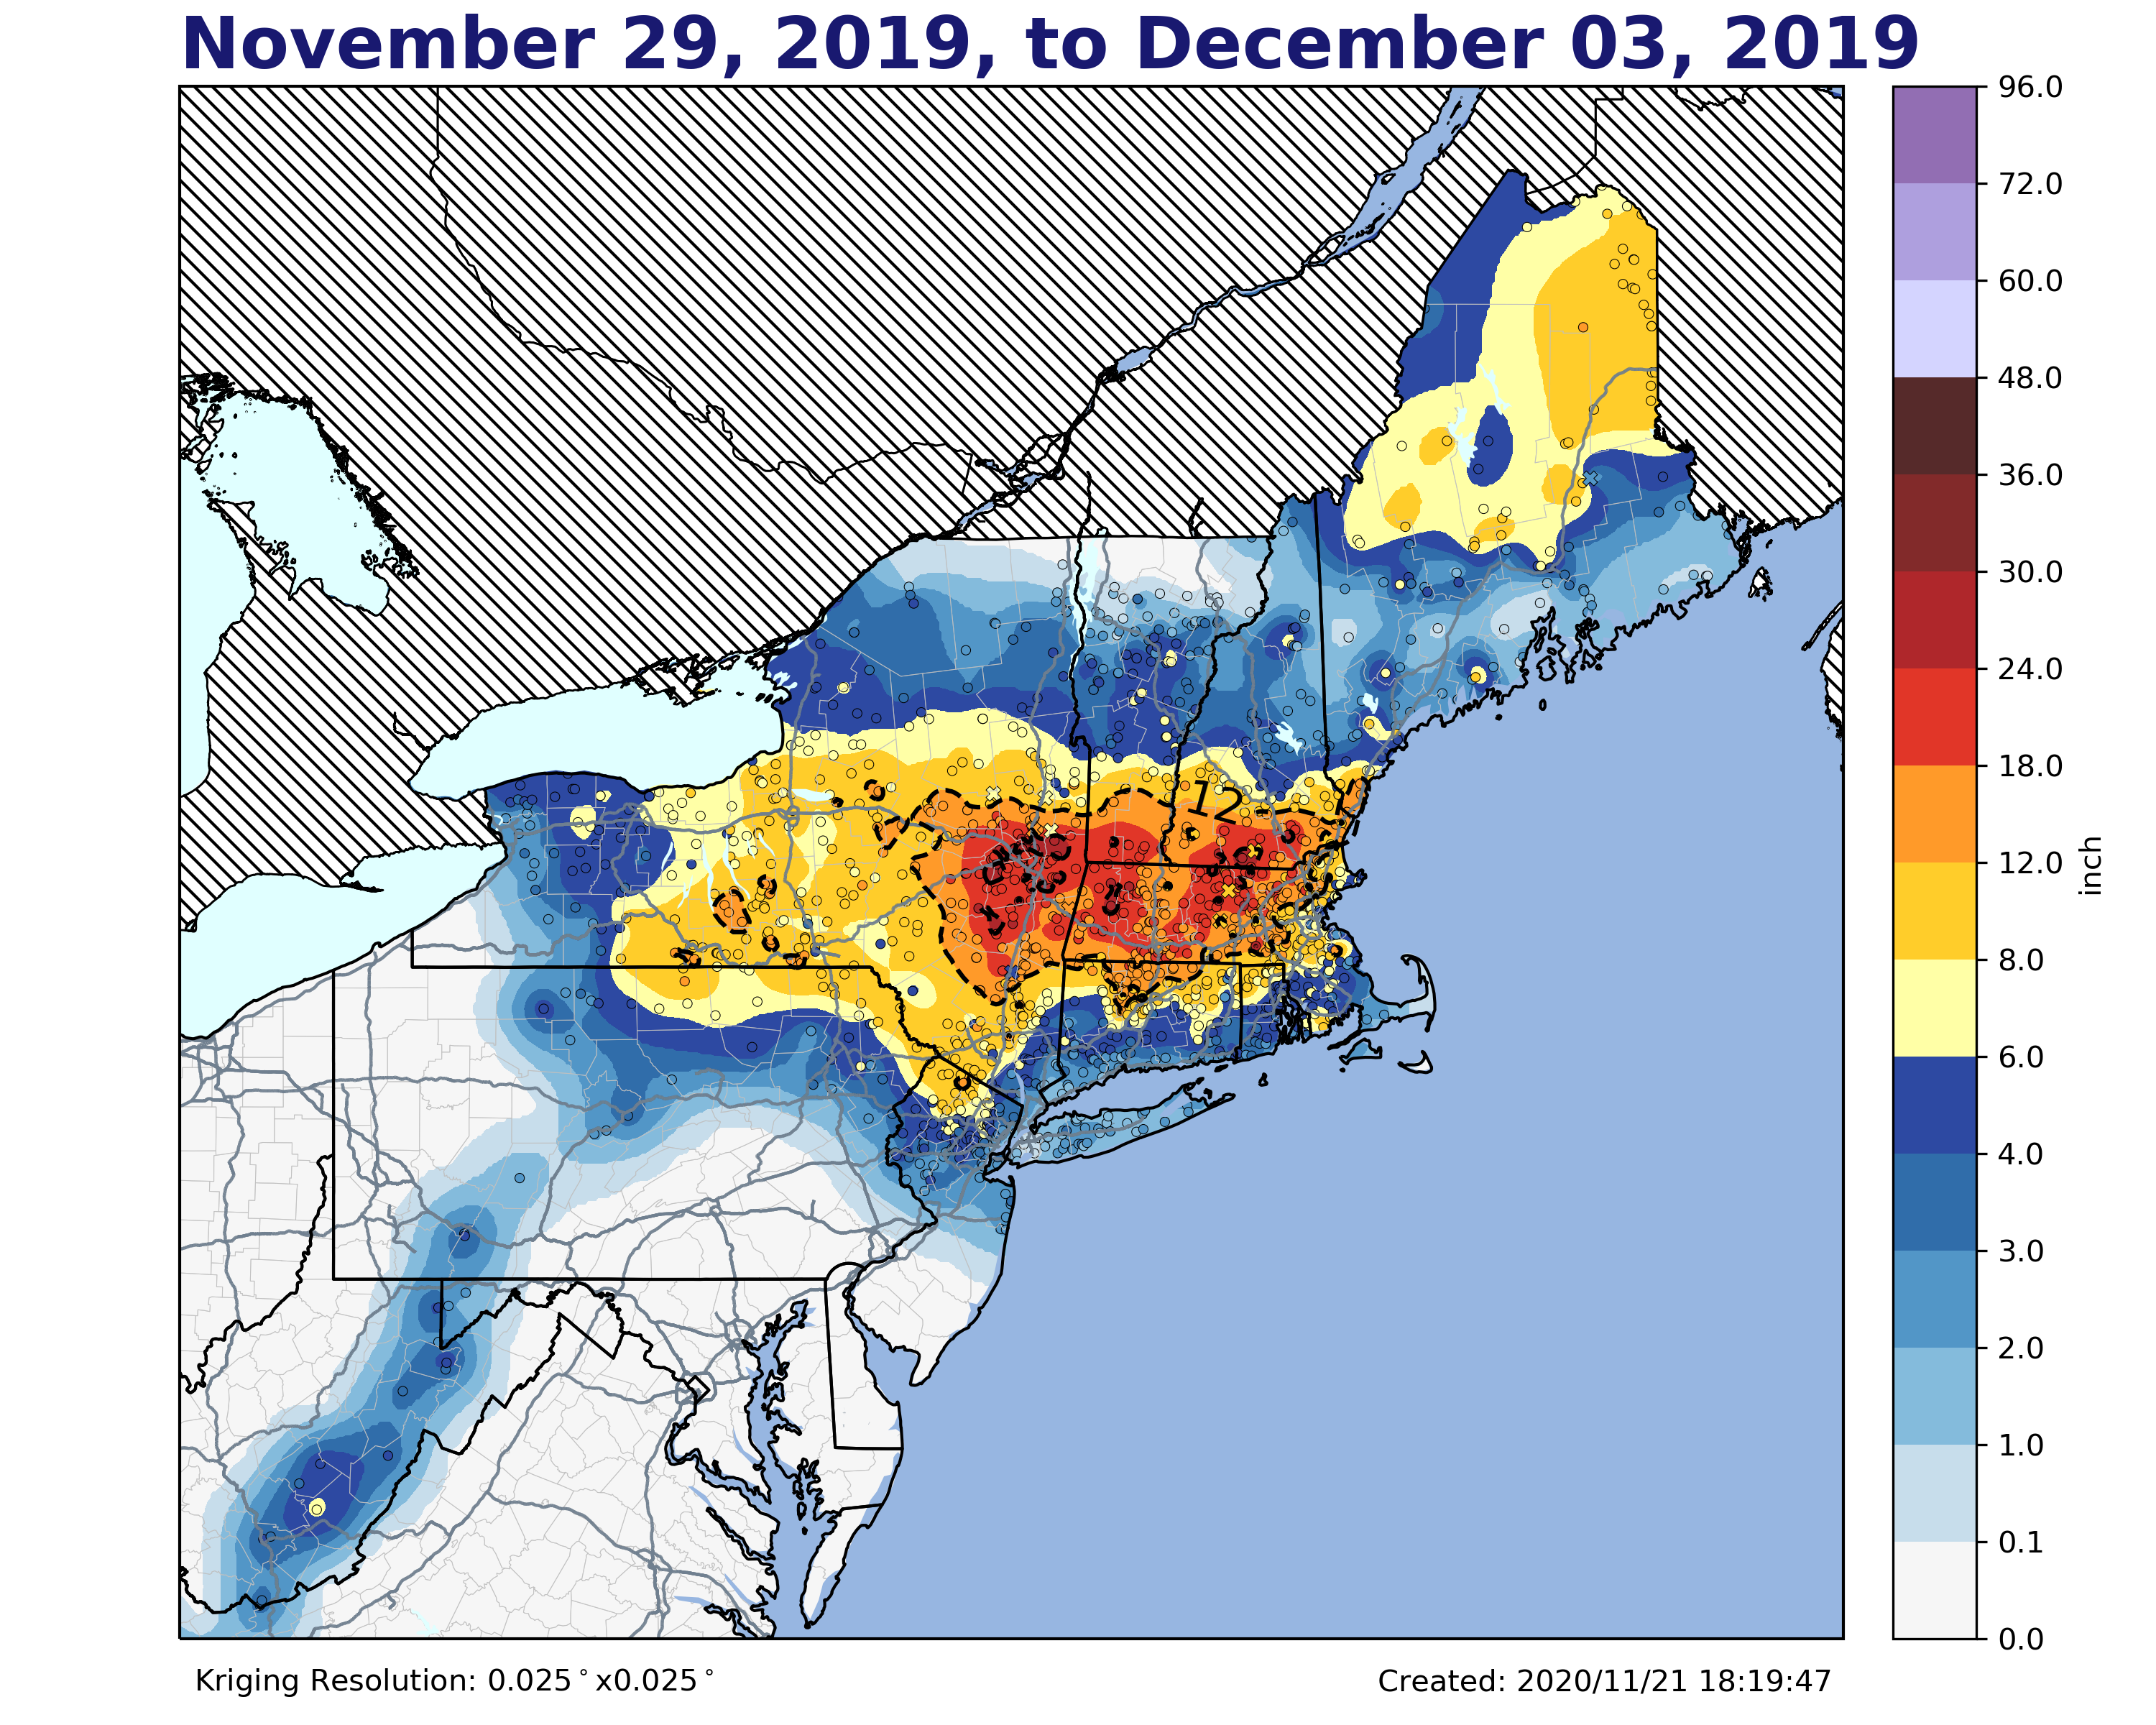
Hey guys,
I wanted to ask, would you change the formatting of the attached snowfall (
 ) map? If there's anything that you'd add, remove, or edit, please let me know. I'm prepared to batch over 200 other snowfall interpolations (1900-now) that I created using GHCND/PNS observations and Python's PyKrige library (https://pypi.org/project/PyKrige/). I'd like to keep a gridded historical archive for other purposes as well. For example, I'd like to
1) create plots for the number of occurrences of 4+,10+,etc... events (on a 0.025x0.025 degree grid) ...and...
2) determine the maximum snowfall amount and index the event for all locations (on a 0.025x0.025 degree grid)
This isn't work that I plan on publishing since there are other agencies with similar and likely, more accurate plots (NWS offices, https://www.nohrsc.noaa.gov/snowfall_v2/, and https://www.ncdc.noaa.gov/snow-and-ice/rsi/nesis). I created these interpolations to conduct an analysis on a constant grid. I'll admit, I did it for fun too! I may also create a large poster of all plots altogether
 .
.
Anyways, I decided not to plot the legend. The plot's elements are:
shaded circles: GHCND/PNS (I added PNS observations when/where applicable) observations.
shaded crosses: GHCND/PNS observations that were determined to be spatial outliers... I found outliers using a methodology similar to this one < https://pro.arcgis.com/en/pro-app/tool-reference/spatial-statistics/h-how-cluster-and-outlier-analysis-anselin-local-m.htm > using a 50km search radius, IDW weights to the 2nd power, and z-scores of -1.280 and 4 (assuming a normal distribution).
shaded: Kriging interpolation onto a 0.025x0.025 degree grid
light blue shade: Lakes (from https://scitools.org.uk/cartopy/docs/v0.14/matplotlib/feature_interface.html)
dark blue shade: Atlantic (from https://scitools.org.uk/cartopy/docs/v0.14/matplotlib/feature_interface.html)
gray segments: Interstates
I also added shapefiles for Canada's provinces, USA's states, and USA's counties.
Ideally, the observations should match the color of the shaded interpolation.

-
1
-
-
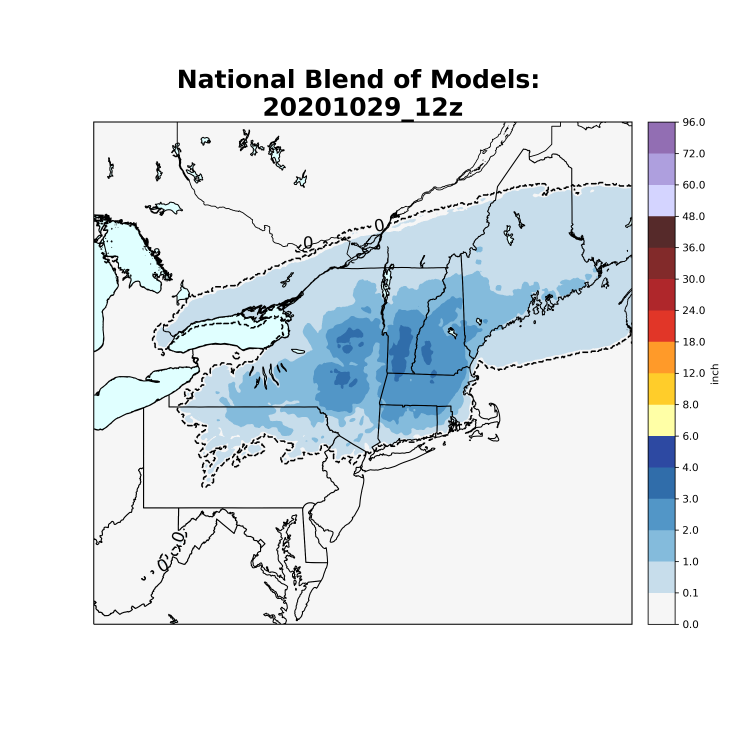
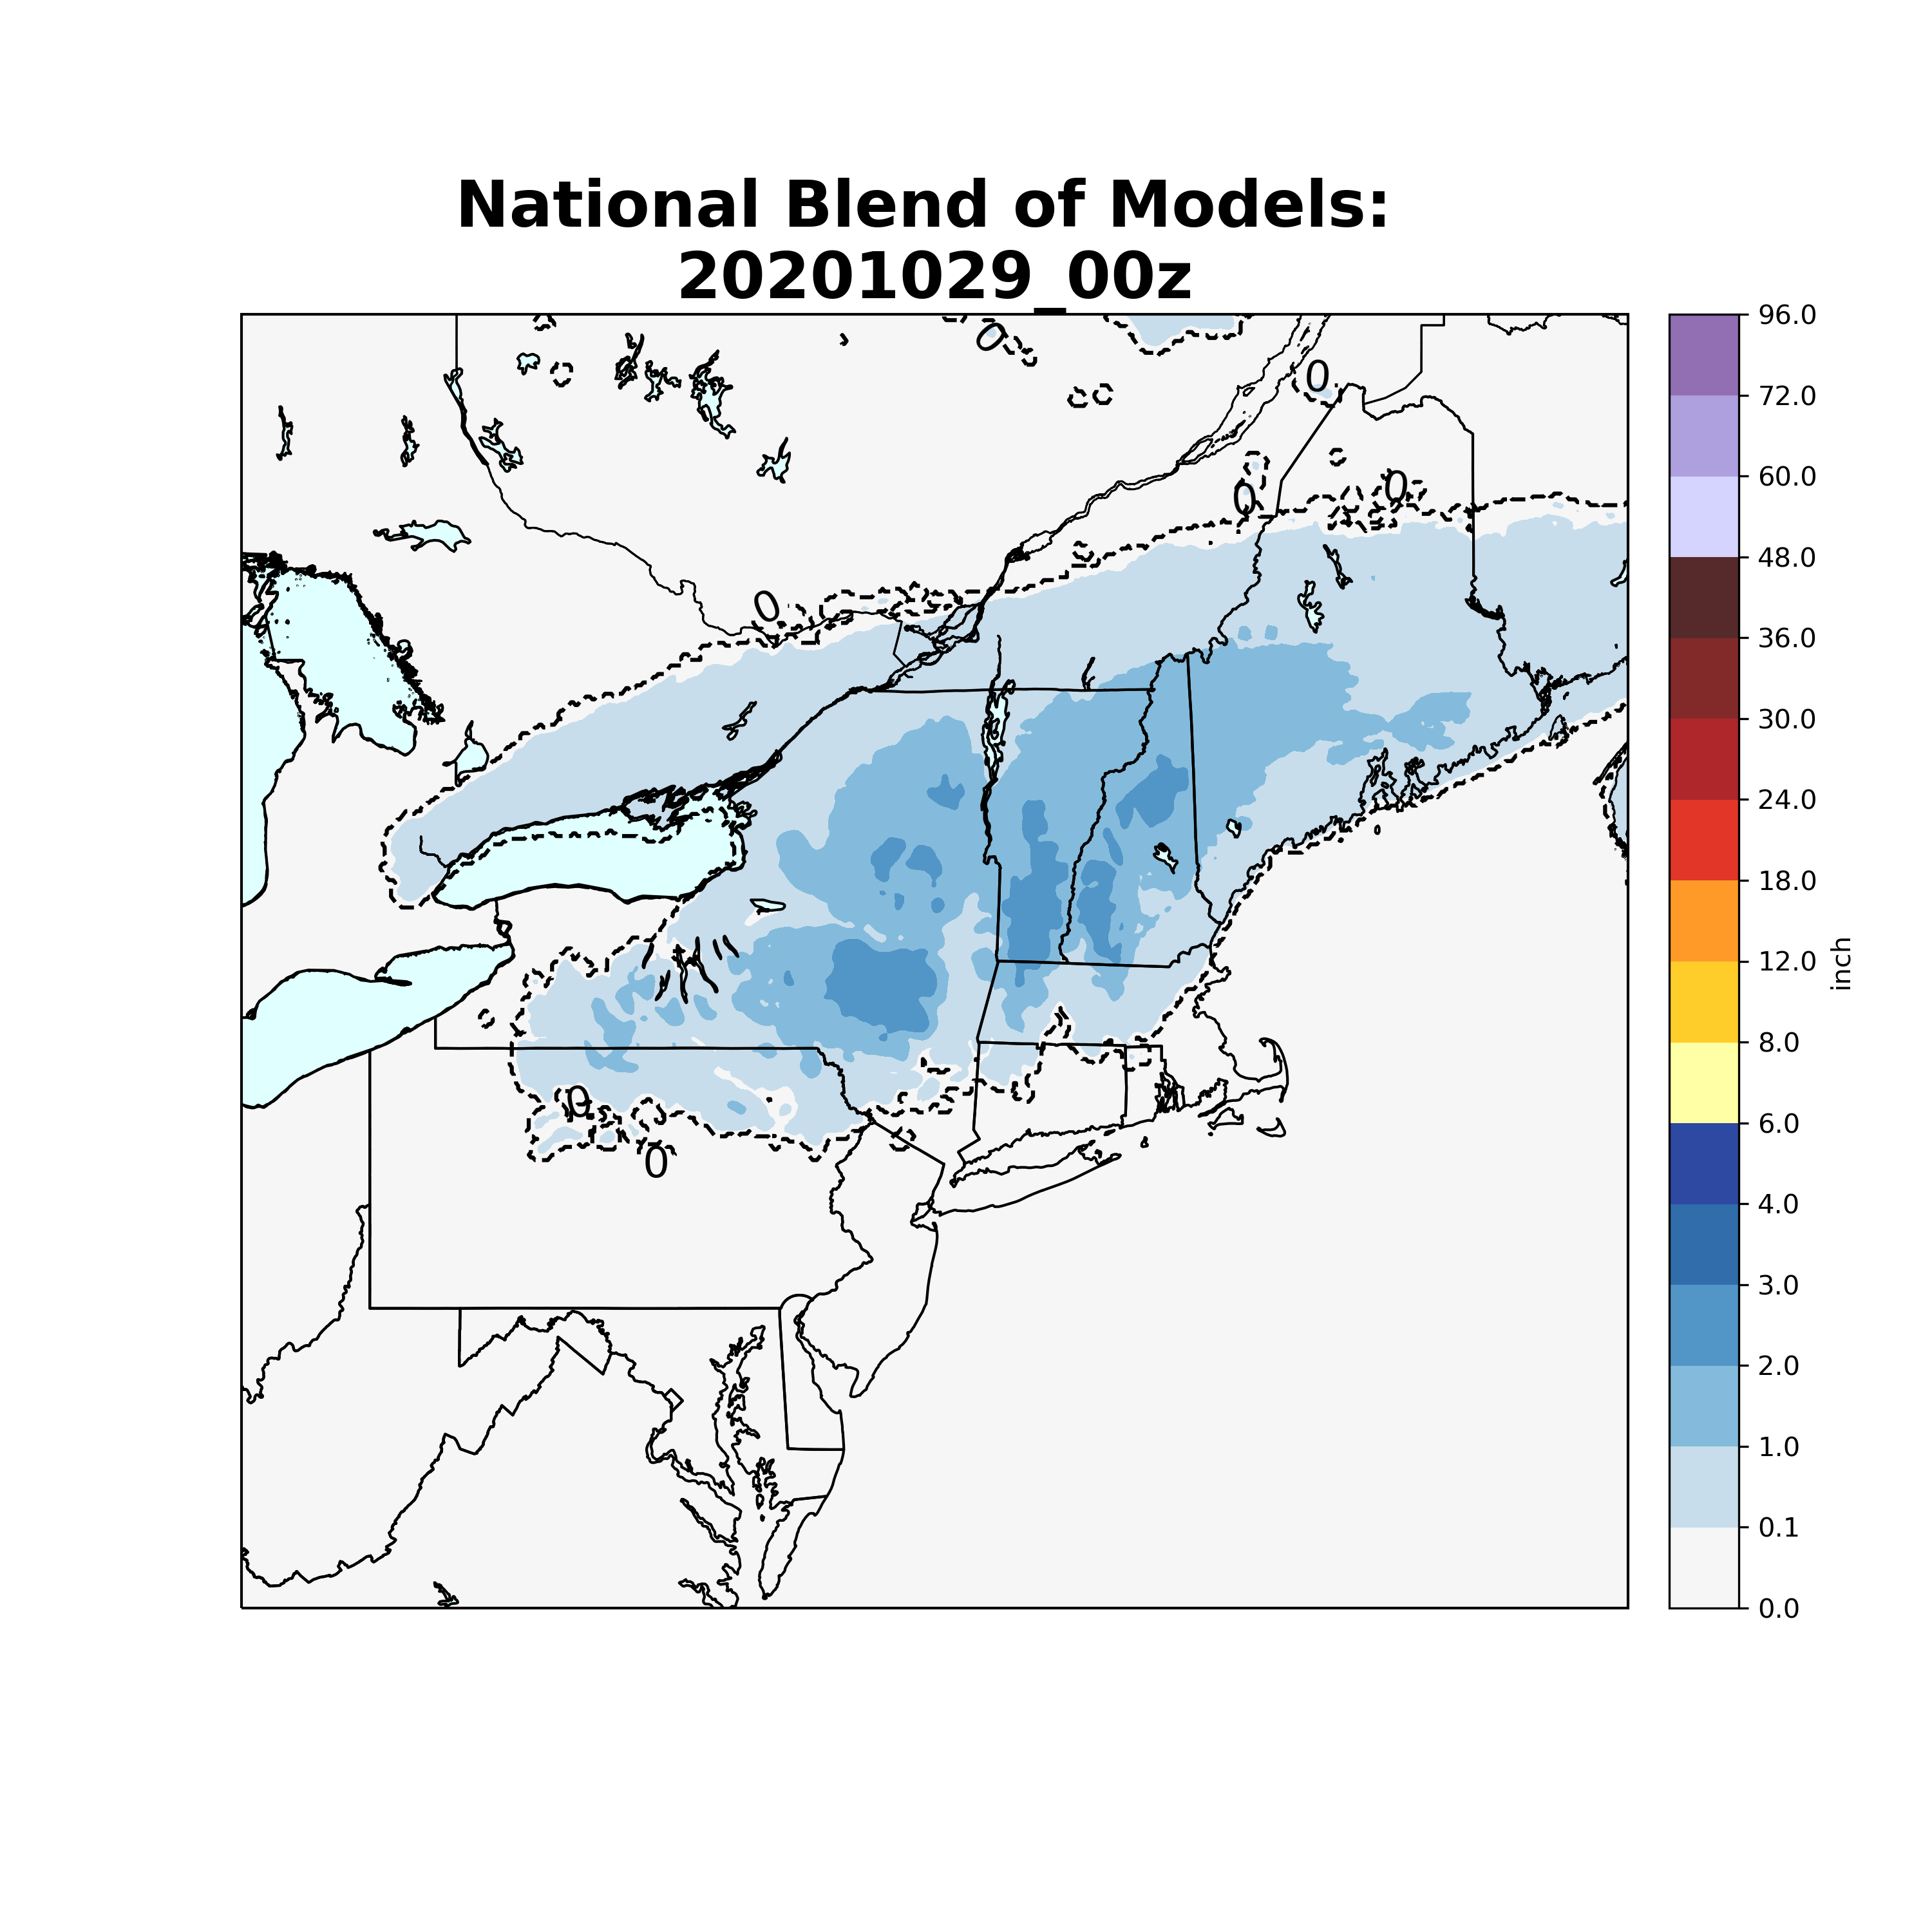
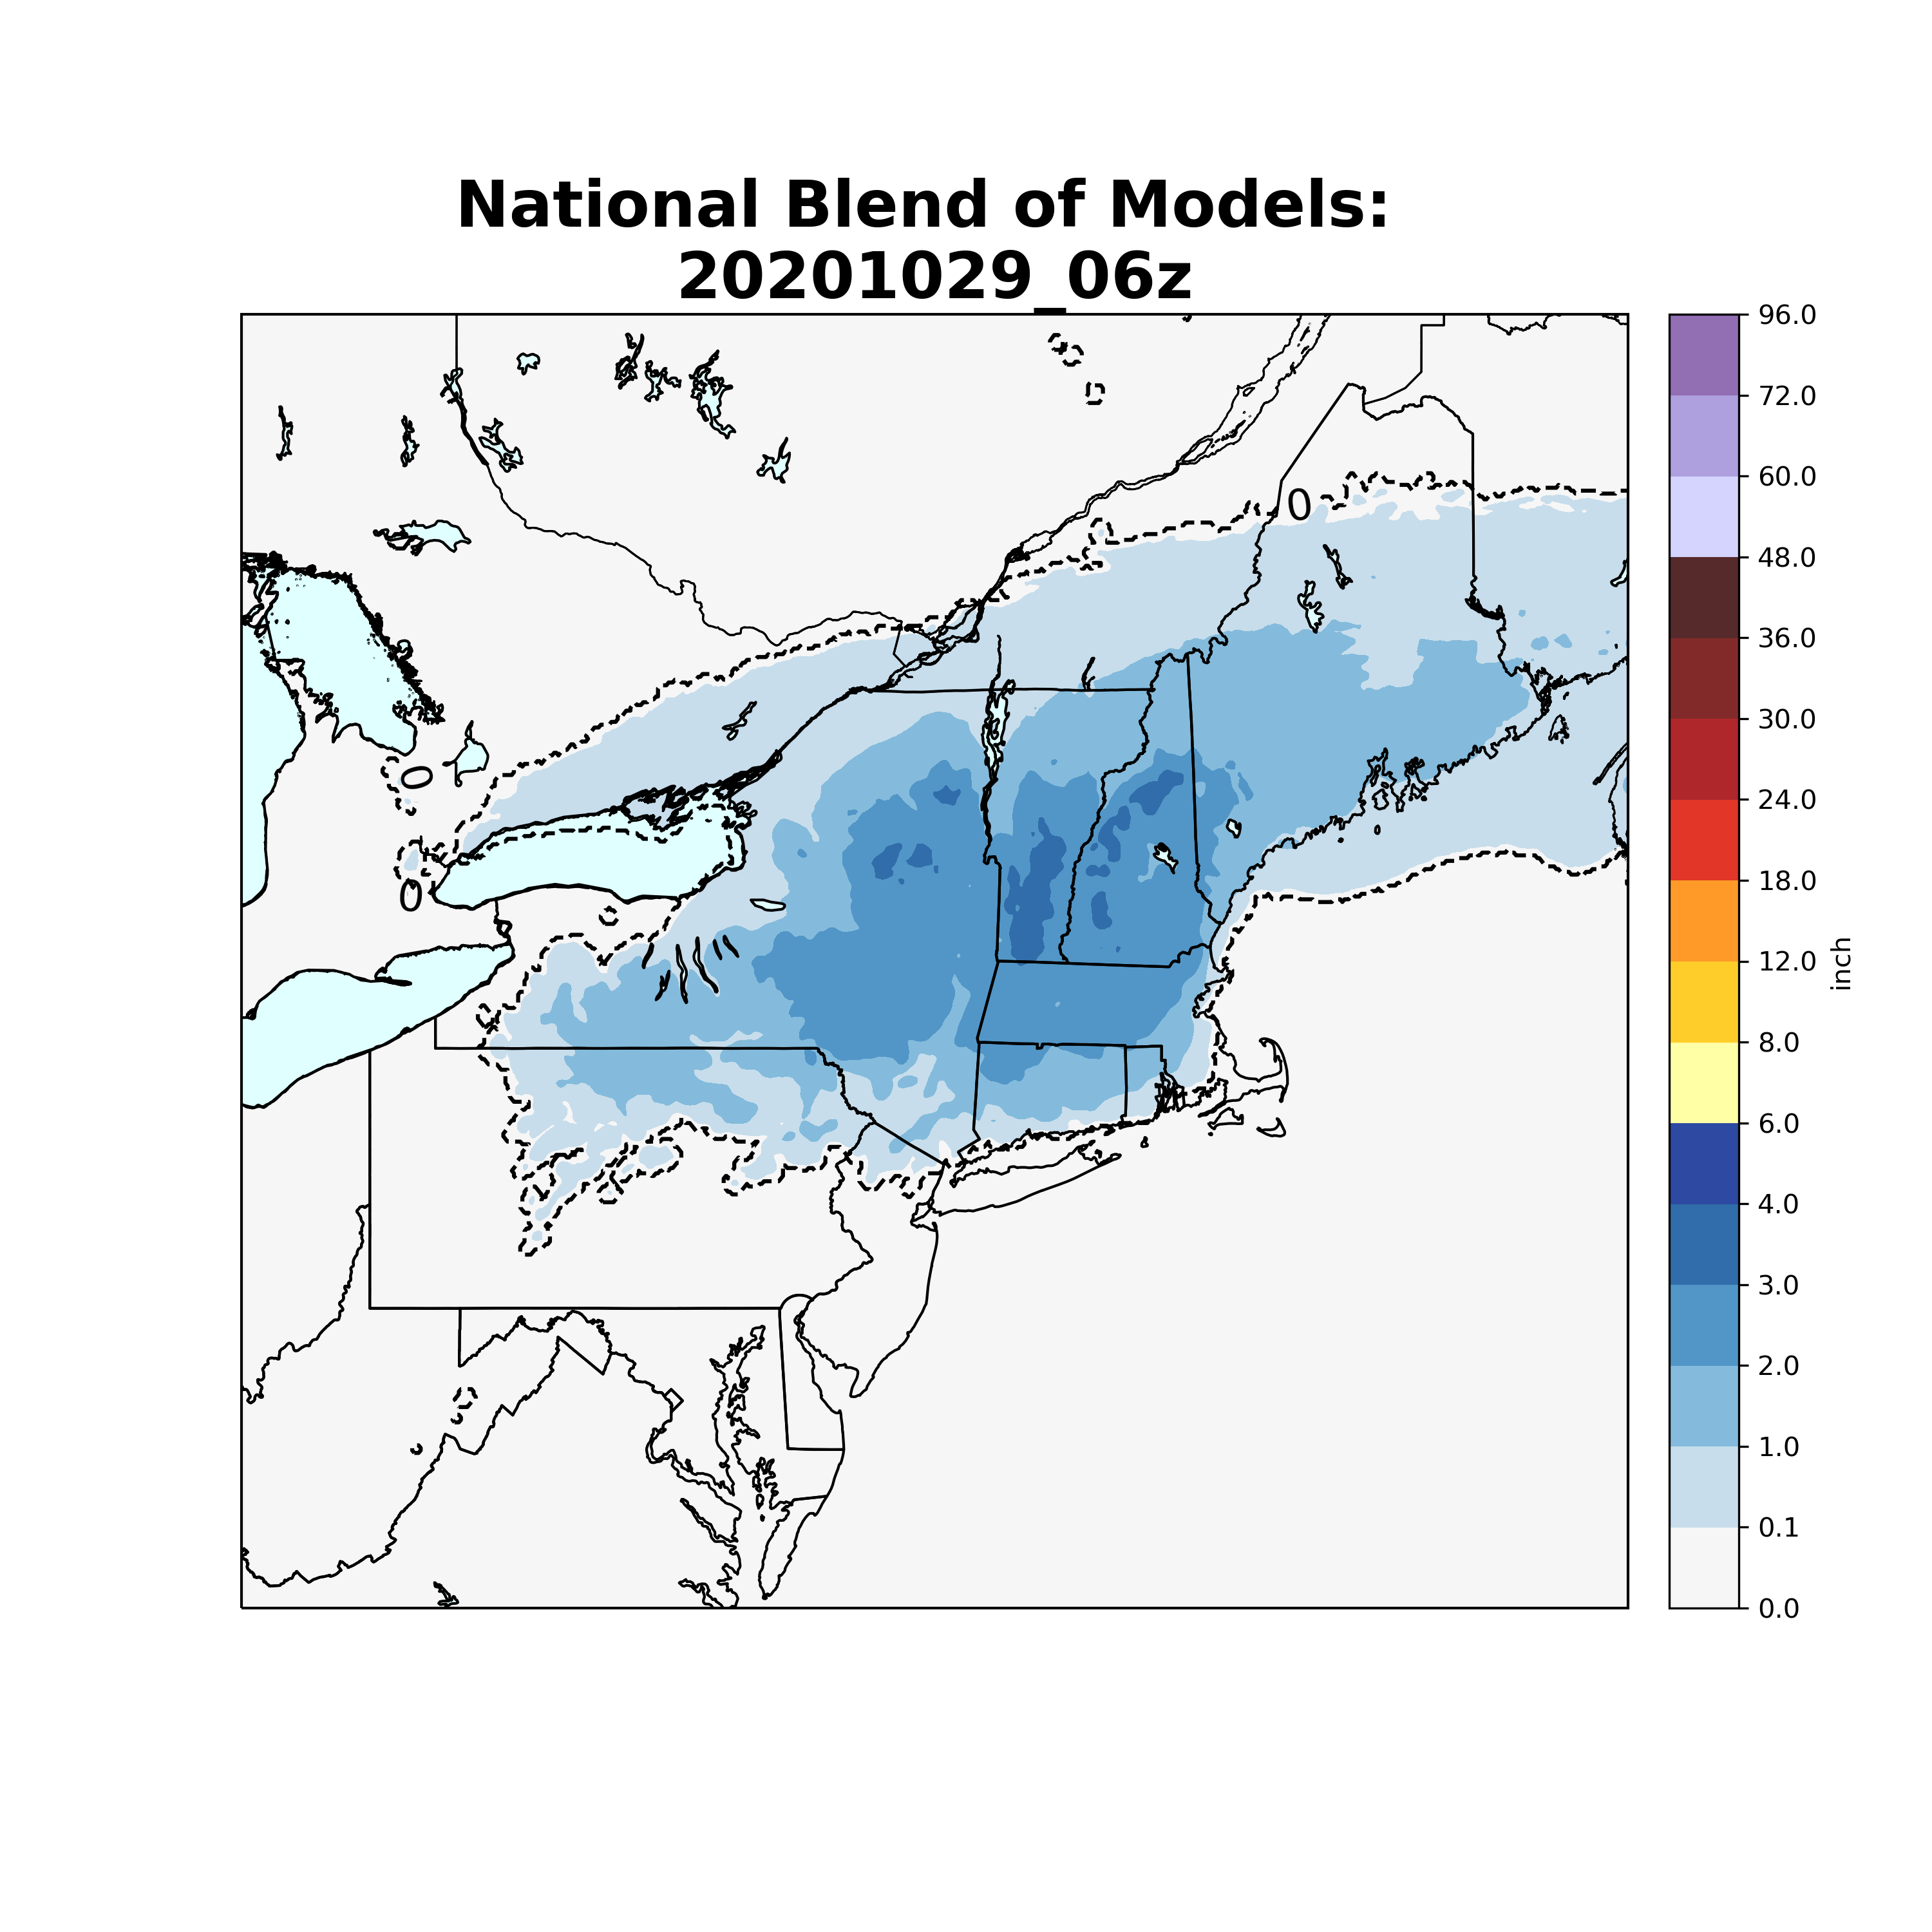
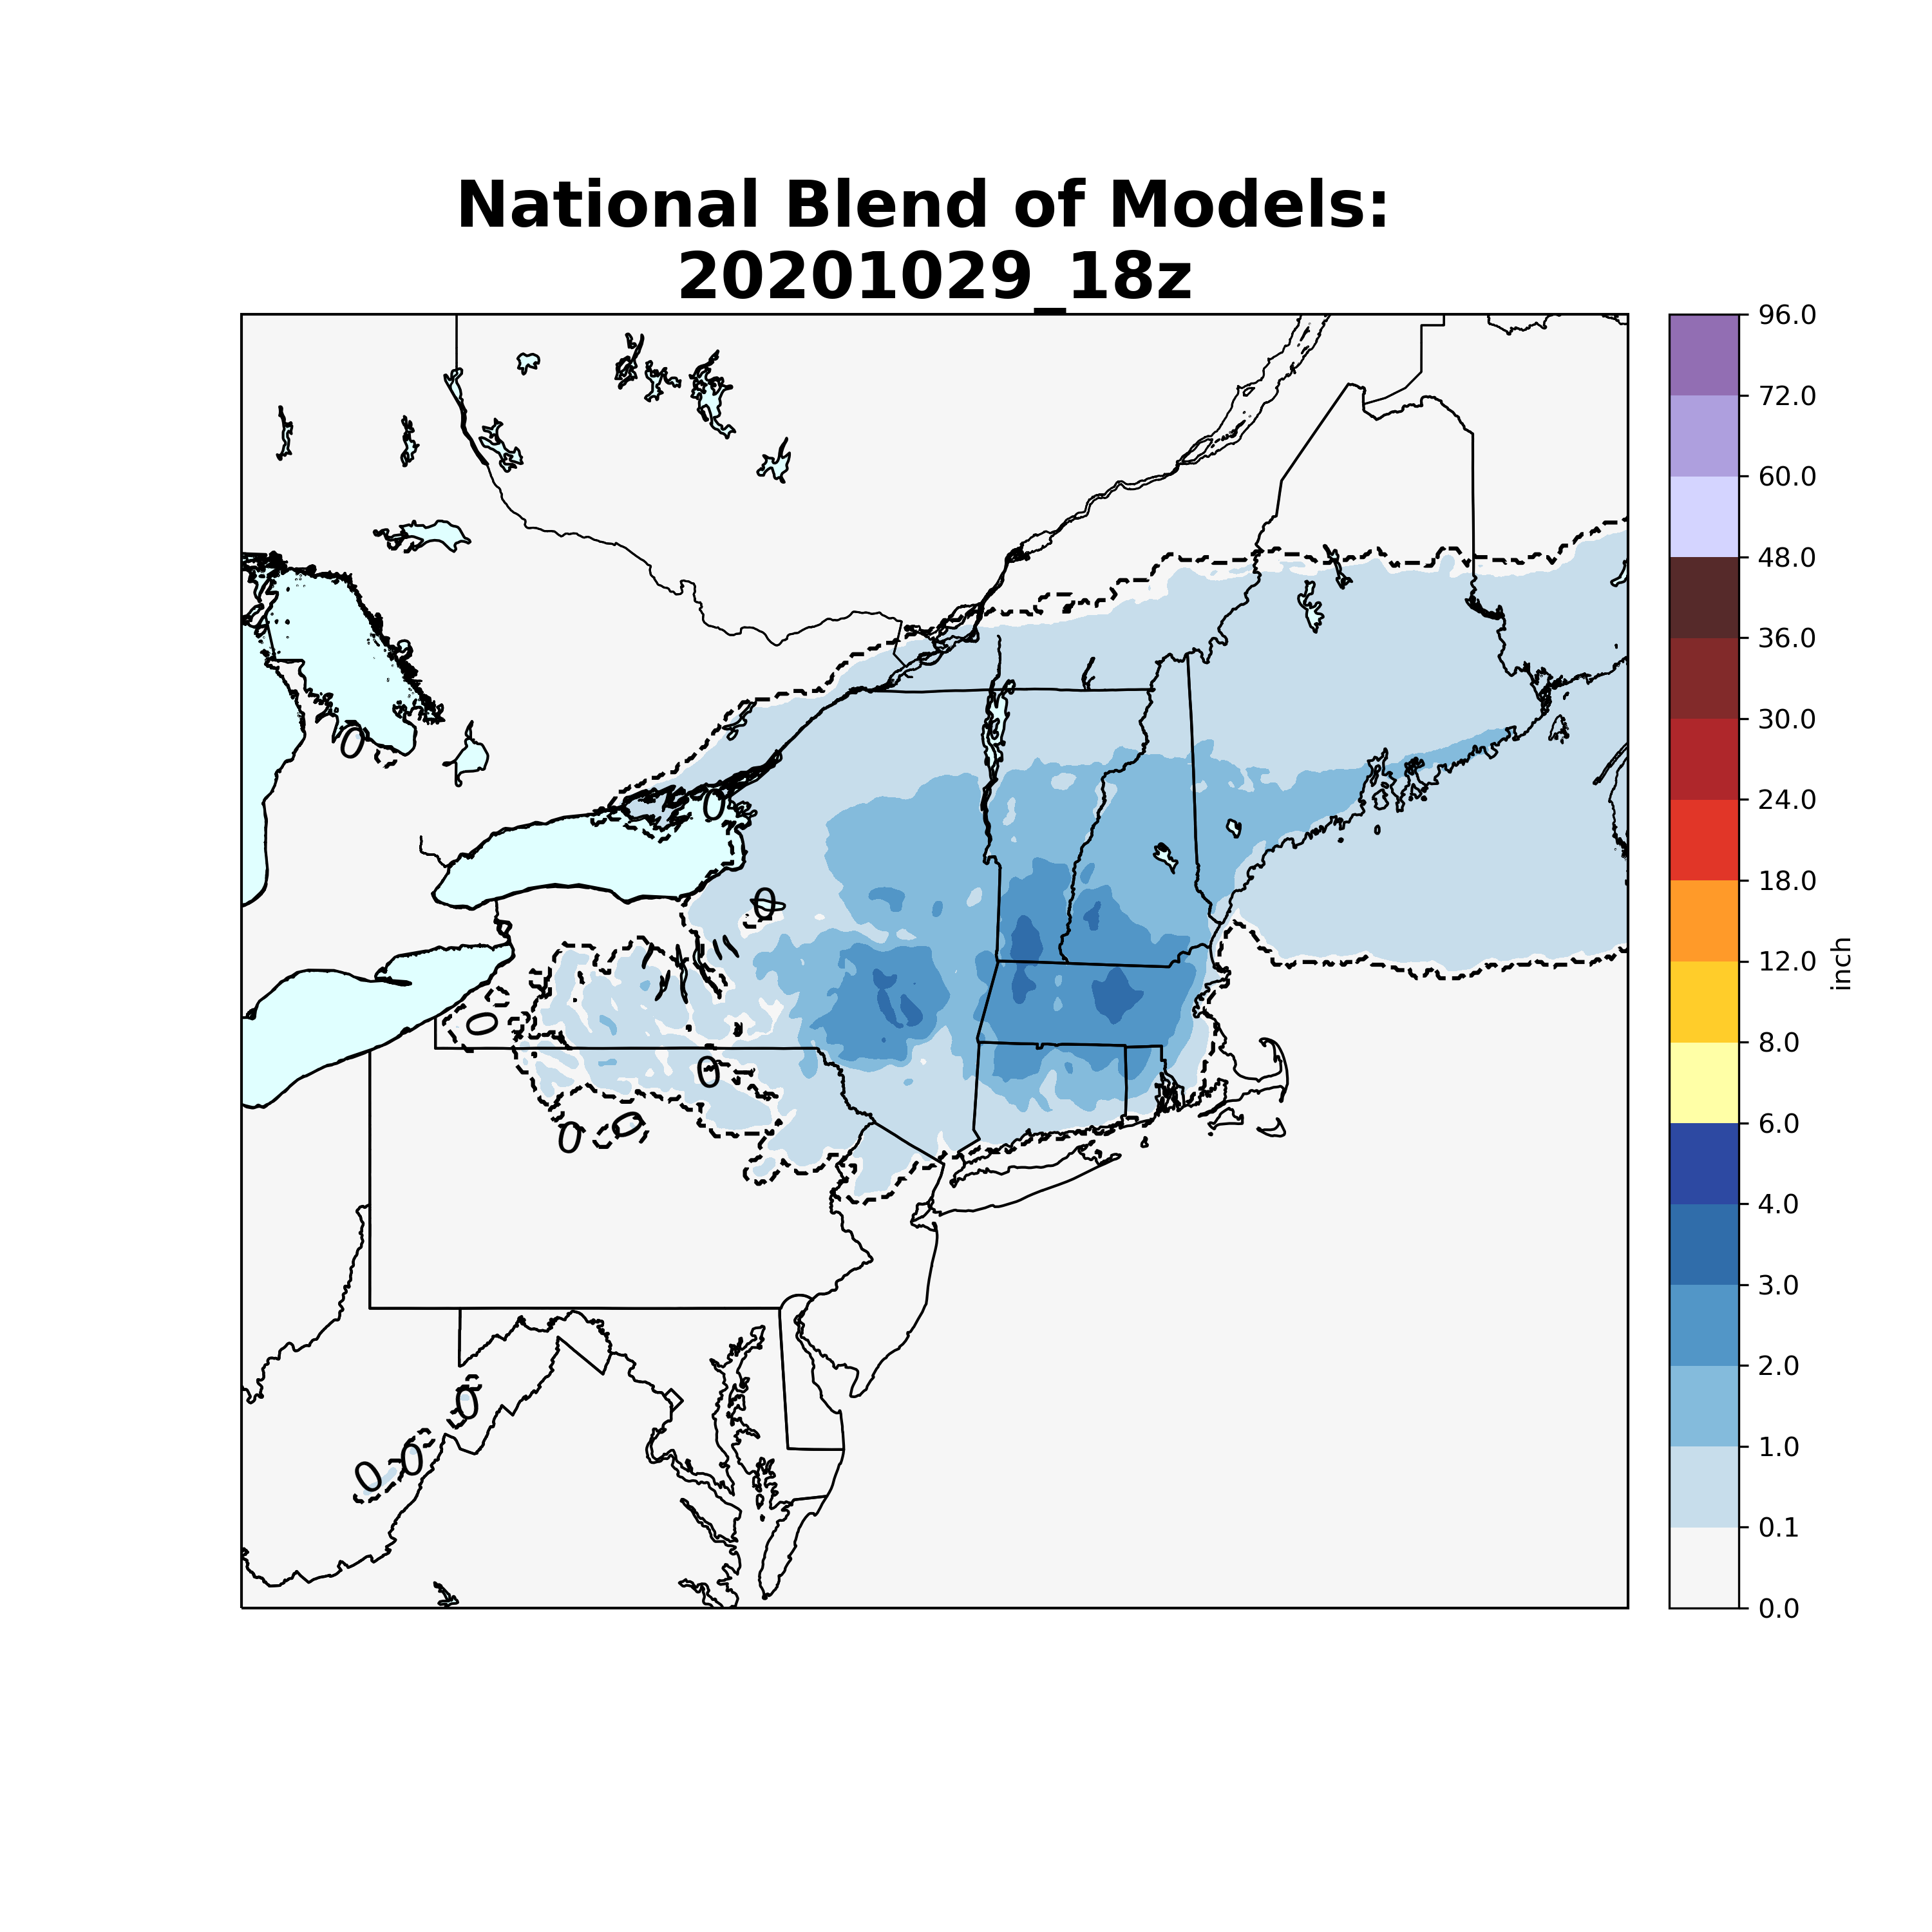
Nobody gives the NBM the love it deserves! Compared to the 10:1/Kuchera SLR algorithms, the NBM (conceptually) is far superior (especially compared to deterministic output). For details, visit this link: https://www.meted.ucar.edu/winter/nbm32winter/. You'll need to create a free account to access the module, but it's worth it! Essentially, SLR's are computed from deterministic/ensemble output via multiple SLR algorithms weighted differently by modeling system(s)... The Cobb SLR algorithm IS incorporated into NBM's snowfall computation (including 3 other algorithms).
I still can't find a public website that provides graphics for the NBM so I'll attach today's 00z, 06z, 12z, and 18z snowfall accumulation plots here. It's straightforward to get and process:
1) Access the 'http://nomads.ncep.noaa.gov' server utilizing a URL to 'request' output from a specific model run. As an example,
http://nomads.ncep.noaa.gov:80/dods/blend/blend20201029/blend_1hr_00z will obtain NBM's 2020-10-29 00z simulation (1hr time-steps).
2) You'll get all of NBM's variables for all times on a lon/lat grid once you obtain the JSON file... Extract the accumulated snowfall variable called, 'asnowsfc' (for the final available hour) then convert mm->inches.
3) Plot the data using optional mapping resources.
It takes a while to make it look pretty, but overall, it's not too difficult. If anyone wants to view the script, PM me! I'm uploading my graduate school script to GitHub. Anyone can access/use it if they'd like.


-
7
-
1
-
-
MET courses are basically applied mathematics/physics courses. If you cannot understand mathematical and or physics concepts, you'll likely struggle in all MET related courses. Even though you didn't ask, I'd recommend taking calculus (and or differential equations) at a community college before committing to a MET program (if you're not feeling confident). This will help you gauge the waters of the curriculum. In my opinion, most people can succeed in all MET, mathematics, and physics courses as long as they work hard and do not quit.
Q. "What else should I expect assuming I'm able to at least have a basic comprehension of the calculus classes?"
A. Expect mathematical terminology within most MET equations. For example (QG theory), know what a partial derivative/del operator is and how to apply these terms within a finite area/volume < https://www.meted.ucar.edu/labs/synoptic/qgoe_sample/index.htm#:~:text=The Quasi-geostrophic (QG),analyses at different pressure levels >
"Are the calculus equations the most difficult part of MET courses or are there other stuff that could pose an even greater challenge for a student?"
A. No... Differential equations is the most "difficult" part of MET courses. They don't get too complicated though so I wouldn't worry about it. Just focus on the mathematics curriculum.
Q. "Are the physics courses just as difficult?"
A. Absolutely not. Not for me anyway... Again, just focus on the mathematics curriculum.
Q. "For a long term goal, I'd be more interested in Broadcast Meteorology, does a bachelor's degree suffice or is grad school pretty much expected for the career?"
I know a lot of colleagues who are broadcasting (as meteorologists) at the moment. Three of which declared ATM as a minor... They're all doing well. You can always get a bachelor's degree in television studies (broadcast concentration) and get a minor in ATM.
-
1 minute ago, weatherwiz said:
I was doing pretty well with Python last summer...then the fall came and I got super swamped. I forget what I was using...was either Jupyter or Conda. But I was having fun with all the mapping packages/data packages. mpl_toolkits, cartopy (this was BRUTAL to get to work...absolutely BRUTAL...took me weeks and dozens and dozens of hours), matplotlib, numpy, etc.
I really need to get back into it...only issue is time to devote. Like I need to devote at least several hours a day to it so I can not only understand it but grasp it. Do you know of any oneline python courses that are strictly designed for meteorology? I would certainly pay for those.
Yup! That sounds like you already have it installed. You can install/configure certain libraries and modules using conda (windows terminal) and pip (anaconda terminal) for Jupyter Notebook.
I faced similar issues when I first started scripting. Basemap took a lot of time to install/configure... Overall, it took me ~1 year of constant scripting to understand Python pretty well. I started with MATLAB, but decided to move to Python since the script is compatible w/Linux (plus all of the utilities!).
I'm sure you can find a Python class as it relates to meteorology, however, I learned Python best by writing script that I was interested in. My first script I created was 1) obtain GHCN-D snowfall observations then 2) identifying suspicious observations using a spatial outlier algorithm. The intent was to use it on observations that were provided by members of this forum so I can label weenies w/statistical support

-
1
-
-
40 minutes ago, weatherwiz said:
Thanks!
I gotta get back into learning python...that would be sick to do. Would it be possible to extract daily observations by station and date into an Excel file?
Anything is possible with Python!
That is what my script does (.csv output), but I only consider liquid water equivalent, snow water equivalent, and snowfall. The good thing about Python is that there are utilities/modules/etc... that already exist that you can install then run pretty easily for specific datasets. For example, for GHCN: https://github.com/aaronpenne/get_noaa_ghcn_data... Avoid any utility or archive that requires you to pay. This data is public.
I'd suggest installing Jupyter Notebook. https://jupyter.org/
It's basically a (somewhat) interactive interface that runs Python script. It comes with a lot of pre-compiled modules and libraries too. You can message me if you'd like more details or run into any problems.
-
6 hours ago, weatherwiz said:
Is there another source to look at Daily Climate Reports? This whole crap with some NWS products not working is beyond ridiculous now...especially SPC outlooks...not populating for like 45 minutes past time
If you're looking for max/min's (temperature, wind speed, wind gust, etc...) and or precipitation, GHCN-D is great. I'm not sure if there's an interactive website that hosts this data though... I use Python script to extract daily observations by station and date.
-
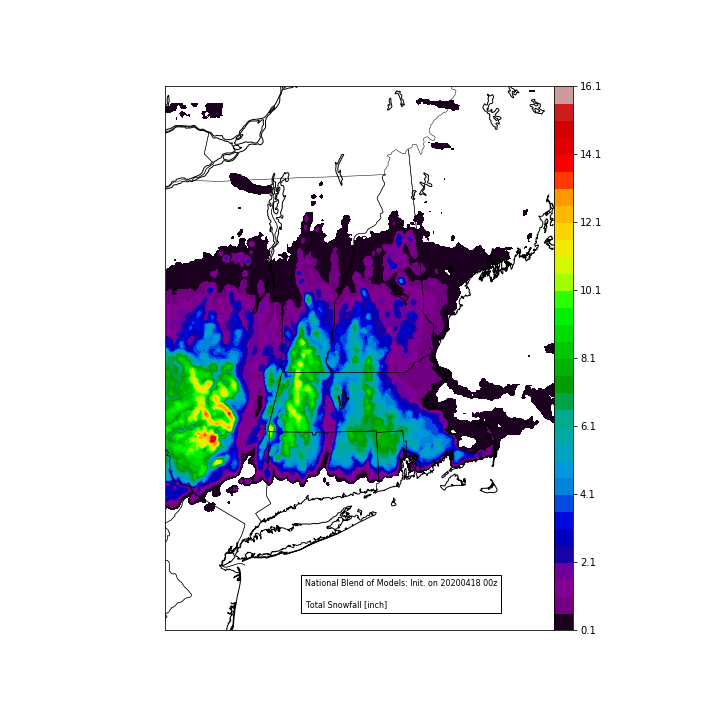
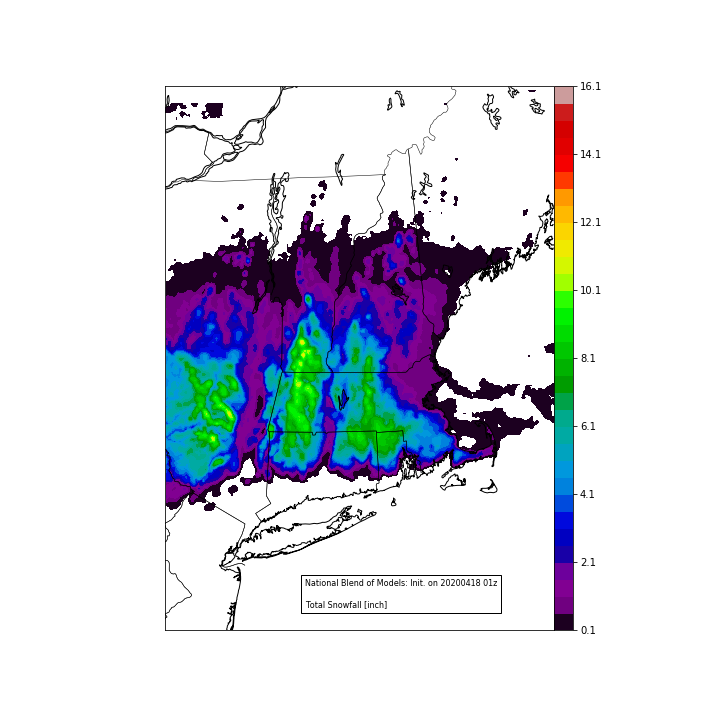
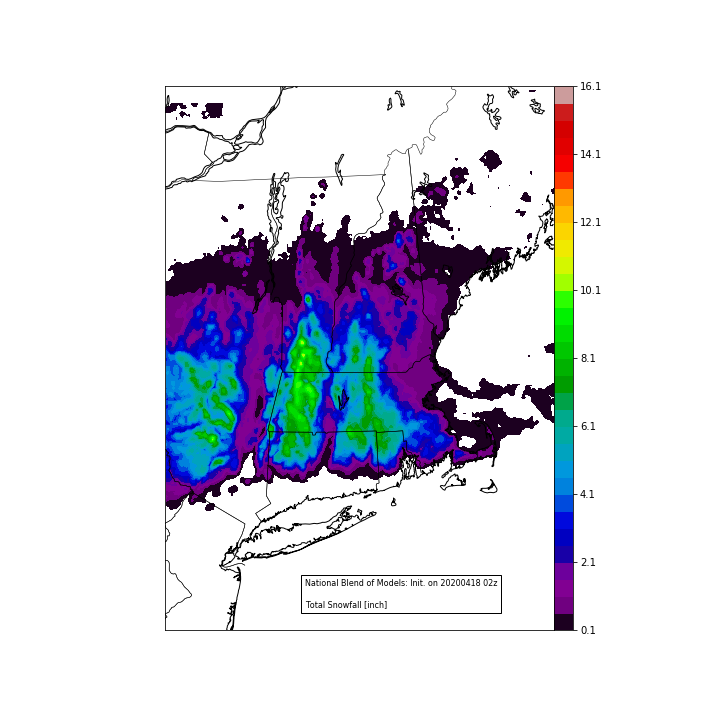
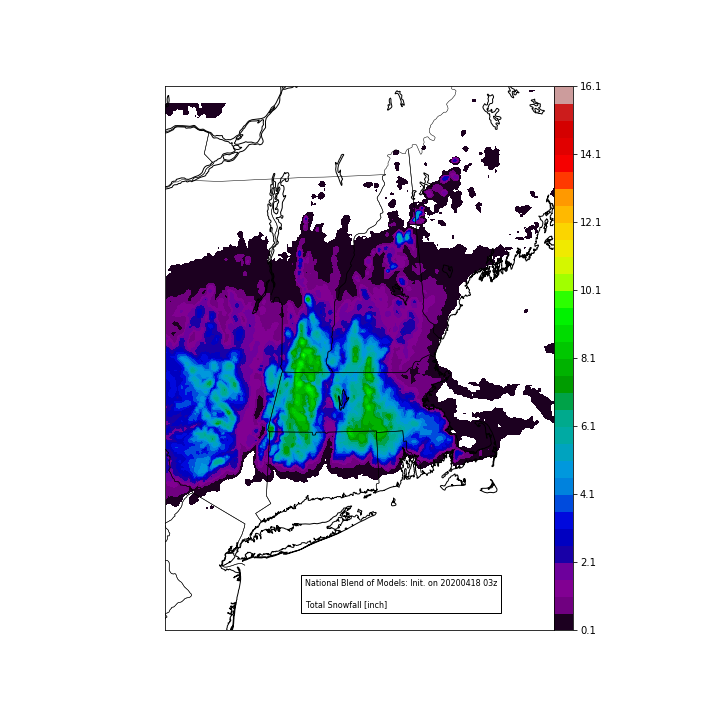
I've been asked to evaluate the National Blend of Models for its accuracy in terms of snowfall. As a side task, I wrote Python script to plot snowfall accumulations for the most recent NBM cycles (00z, 01z, 02z, and 03z). They look pretty bullish compared to other models, but spatially they look pretty similar (higher impacts in western MA and the Worcester hills). I'm looking forward to seeing how well they perform. I hold the NBM to high standards although its snowfall accumulations (in my opinion) look too high for this event.
If anyone's interested, most operational NWP products are available via the NOMADS server <nomads.ncep.noaa.gov>. In the future, I'll make my plots nicer, but for the time being, it's not being used by a third party so :shrugs:
-
I stumbled upon this thread by chance trying to look for a precipitation analysis method for an evaluation with respect to multiple (44) winter weather events. The idea was that if I conduct MODE analysis between StageIV precipitation w.r.t modeled hourly precipitation, I can determine the accuracy of banded precipitation vs. several modeling systems (ICLAMS/WRF). Unfortunately, it's recommended (strongly suggested) by the developers to avoid such a methodology due to poorly ingested liquid water equivalent observations under snowy conditions... The rain gauges struggle to observe liquid water equivalent when snow is falling... I'm now considering the RTMA, URMA, or possibly, a satellite derived product instead.
"Each River Forecast Center (RFC) has the ability to manually quality control the Multisensor Precipitation Estimates (MPE) precipitation data in its region of responsibility before it is sent to be included in the Stage IV mosaic. The precipitation values,however, are not intentionally modified downwards during snow events. Rather, due to inaccurate measuring of liquid equivalents at many gauge locations (e.g., a lack of the equipment to melt and measure the frozen precip), zero or very low values are reported at these locations. These "bad" gauge values then go into the MPE algorithm, resulting in liquid precip estimates that are too low during winter storms. There are also problems with zero or too low precipitation values at many RFC gauge locations even outside of heavy snowfall events."
"There are problems with the RFC precip data in the eastern U.S. during heavy snow events. While ASOS stations have the equipment to melt the snow and derive the liquid equivalent precip, the RFC stations in the East do not. So when there are big snowfall events such as the January 2016 blizzard, the snow accumulations get recorded, but the corresponding liquid equivalents often come in as zero or near zero amounts, which are incorrect."
If you're curious (Model Evaluation Tool for MODE analysis): https://dtcenter.org/sites/default/files/community-code/met/docs/user-guide/MET_Users_Guide_v8.1.2.pdf
-
2 minutes ago, KoalaBeer said:
3K NAM has a 930mb low SE of the cape. Toss that model as far as you can for this event...

The difference between the NAM3km and the NAM12km/32km at 500hPa is pretty extreme. By now, you'd expect some consistency or at least a realistic simulation (from the NAM3km). I definitely agree with you... Toss the NAM3km.


-
1
-
-
I really like your graphics, The 4 Seasons! Are your interpolations done manually? Also, what program/software do you utilize to create your graphics?
Some recommendations/suggestions (in case you erased your inbox):
If you're looking for pre-1993 observations, try getting your data via the Global Historical Climatologist Network (GHCN). You can get snowfall totals (and what not) from 1973-today (for in-situ/surface stations). If you want snowfall totals for specific events, you'll have to sum daily snowfall accumulations for 't' # of days and for 'n' # of stations. Conveniently, the data is quality checked!
Here's the URL: ftp://ftp.ncdc.noaa.gov/pub/data/ghcn/daily/
Personally, I like working with the yearly ('by_year') .csv files.
Last thing, if you're using crowd sourced data, I'd recommend processing the data through a spatial outlier test. The "Local Anselin Moran's" algorithm can be used to scientifically eliminate suspect/faulty observations. Michael Squires (created the Regional Snowfall Index scale =~ NESIS ) used this method for his research.
Algorithm details: https://pro.arcgis.com/en/pro-app/tool-reference/spatial-statistics/h-how-cluster-and-outlier-analysis-anselin-local-m.htm
If you're interested, I wrote script for Moran's algorithm utilizing Python.
-
1
-
-
On 4/14/2019 at 5:49 PM, JakkelWx said:
What programming language do most meteorologists use if they are dealing/working with weather models and climate models?
Mainly FORTRAN (great program for running numerical computations) on a Linux OS. When it comes to post-processing data; NCL, REVU, MATLAB, and or PYTHON.
-
Pinging is getting louder (Pawtucket/Providence). I'll call it a night here in the "Bucket." I don't expect much more additional snowfall accumulation(s) for my area.
Enjoy the storm, everyone!
-
Yea... Starting to mix now in Pawtucket/Providence... Visibility at KPVD increased to 0.75 miles. I went outside and there's a mix b/n snow/sleet/and mist. I'd put the ratio at 80/10/10.
I roughly have 8 inches of snow otg.
-
2 minutes ago, dendrite said:
Past hourly water equivs...
MQE 0.29”

BOS 0.24”
PVD 0.22”
ORH 0.19”
Unfortunately, snow ratios haven't been impressive over the past hour in Pawtucket (near Providence). Visibility increased since earlier this morning as well. I'll go outside to make an observation soon.


My hand-drawing annual average snowfall map of central to eastern (greater) China
in Weather Forecasting and Discussion
Posted
Ah! I didn't see your second comment in this thread. That's what I figured though.
Getting quality controlled snowfall data is extremely difficult even in the U.S. For my snowfall evaluations, I use the GHCND archive to retrieve historical snowfall observations. You can get snowfall, snow depth, liquid water equivalent, etc... from the ftp/https server for all available stations which may include China. I'd try giving it a shot if you haven't already done so. It might help you add more data points onto your map.
https://www.ncdc.noaa.gov/data-access/land-based-station-data/land-based-datasets/global-historical-climatology-network-ghcn