Vergent
-
Posts
981 -
Joined
-
Last visited
Content Type
Profiles
Blogs
Forums
American Weather
Media Demo
Store
Gallery
Everything posted by Vergent
-
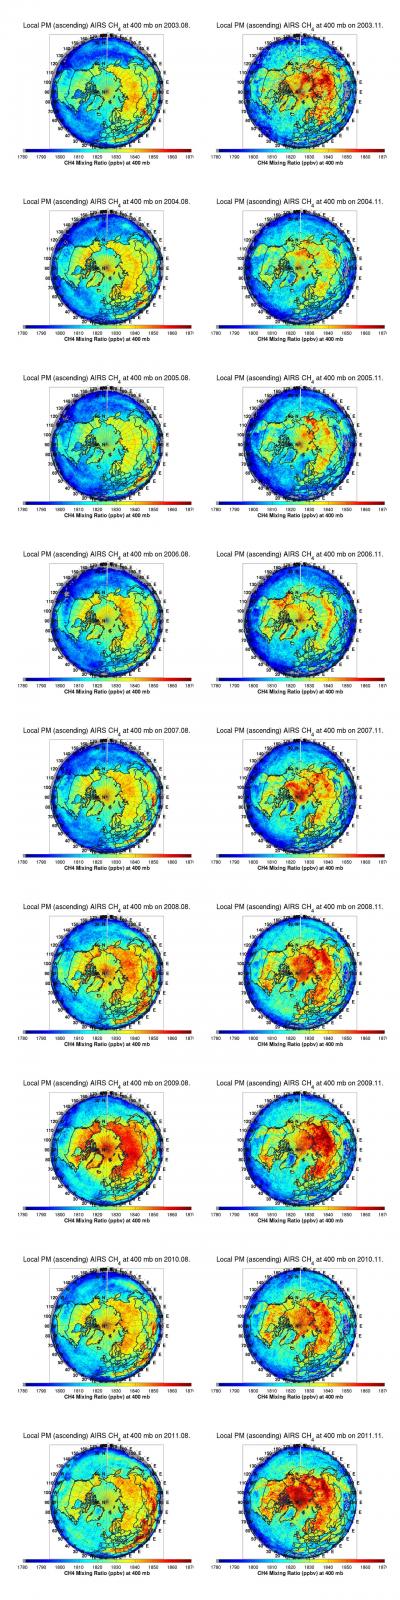
they used to publish daily global methane maps from the AIRS sensor. you can see methane farts coming out of the arctic on 1/18/05, 2/25/05, 2/3/07, 2/11/08, and 2/22/08. It seems they stopped publishing these maps and dumped the archive, too bad, bad timing. BTW, thanks to the moderator.
-
http://www.biogeosci...-4-521-2007.pdf The 2007 paper that gives him such comfort that the hydrates can't make big changes. The problem is the paper also concludes that arctic methane acceleration "is probably decades away" and also that the uncertainty in the quantity of vulnerable hydrate is about 10 to 1. It also talked about the direct venting to the atmosphere(bubbles) as not being significant. They estimate the hydrates in the arctic to be "hundreds" of Gt for the whole arctic. http://www.agu.org/p...9JC005602.shtml "The total amount of carbon preserved within the ESAS as organic matter and ready to release CH4from seabed deposits is predicted to be ∼1400 Gt. Release of only a small fraction of this reservoir, which was sealed with impermeable permafrost for thousands of years, would significantly alter the annual CH4 budget and have global implications, because the shallowness of the ESAS allows the majority of CH4 to pass through the water column and escape to the atmosphere."(2010) Now we have hundreds fountains of methane bubbles, some more than a kilometer across, coming from a 1,500 Gt store, observed by experts in the field who are quite alarmed. So this paper is invalidated by observation, and further studies, and should give no such comfort. I liked the quote in comment #2. "One Arctic expert said to me recently “If there’s a conflict between reality and models, the modelers stick to their models.”"
-
The sattelite measurements do not show that the methane has reached any of the field stations. How can they measure what isn't there?
-
The cores show us that we do not have a high resolution record of what happens to planet Earth with 1899ppb ch4 and 400ppm co2. The critical issue with the hydrates is the rate at which they are released. CH4 is short lived in the atmosphere. When in the last 800,000 years has greenhouse forcing in the arctic been as strong as it is today? When would the arctic have been warming as fast as it is now?
-
If we look at the actual methane concentrations, we get a different story. Last summer, lower ch4 air from the south displaced the high ch4 arctic air, dropping the ch4 to below 1800 ppb, since then the ch4 has risen an unprecedented 50ppb to almost 1850. This was at 400MB. We do not know about the other altitudes. The normal peak does not happen till later than November 31. The December update does not happen till mid January. It will be interesting to see what will happen. the normal December rise is in the 10ppb range , so we will probably set a record.
-
opinion noted. Please do not repost until Marietta responds. Marietta opinion?
-
TerryM found arctic methane data above(previous page): apologies to the low band width users. click the links ftp://asl.umbc.edu/pub/yurganov/methane/MAPS/NH/ARCTpolar2011.08._AIRS_CH4_400.jpg ftp://asl.umbc.edu/pub/yurganov/methane/MAPS/NH/ARCTpolar2011.11._AIRS_CH4_400.jpg ftp://asl.umbc.edu/p...methane/MAPS/NH This 35 ppb jump is more than double the 10-15 ppb jump of previous years It is totally amazing how this methane gun has missed the monitoring stations. http://www.esrl.noaa...ex.php?code=car but it has But it cannot hide from AIRS The methane is caught up in the AO. There are sometimes on this forum where it seams that the people you are talking to are blind and cannot see the pictures. Bethesda, your opinion?
-
how about 800,000 years ago? The antarctic ice cores go way back and have high resolution, and almost no contamination.
-
Yes, that was 2010. From his description of what he found last fall(2009), we have blown right past those 1-2 orders of magnitude.
-
The East Siberian Sea, They were only able to cover 10,000km^2 of it. The methane vents went from "tens of meters in diameter" to "more than a kilometer in diameter" They also reportedly increased in number and intensity. A fifty fold increase in diameter is a 2,500X increase in area. more than three and less than four orders of magnatude. When the report comes out in the spring we will have better numbers.
-
A little out of date. "Observations show that there have not yet been significant increases in methane emissions from northern terrestrial high-latitude hydrates and wetlands resulting from increasing Arctic temperatures." Somehow I think hundreds of fountains of methane a kilometer across is a game changer. What has been described seems to be an increase over last years observations, on the order of 3-4 orders of magnitude. We are in uncharted territory. We have no idea how many more orders of magnitude we will get next year. http://www.sciencema...5970/1246.short Observation trumps theory.
-
Their report can be viewed here: http://www.flipdocs.com/showbook.aspx?ID=10004692_698290
-
My bad, I should have pasted this from the same page: At the end of the Arctic Methane Workshop held in Chiswick, London W4, on the weekend of 15-16 October, 2011, a position statement on the Arctic methane emergency, proposed by the chairman, John Nissen, was agreed by the following: Graham Ennis Doly Garcia Jon Hughes Veli Albert Kallio Graham Knight Dr Brian Orr Professor Stephen Salter Professor Peter Wadhams Working group team producing the report, distributed as a brochure at the American Geopysical Union conference December 2011: Sam Carana, writer blogger and editor at geo-engineering.blogspot.com Peter D Carter, MD, US Canada; Anthony Cook, science educator, International School of Ulaanbaatar,MN Graham Ennis, former aerospace engineer, UK; Gary Houser, documentary producer, US; Jon Hughes, ex-editor Ecologist, UK; John Nissen, MA, chairman of the working group, UK.
-
Yes everyone is learning, most of all me, and even salbers, who works in the building where the data is prossed. The skeptics have contributed, Marietta, your nagging drove us to find more facts and data. Thank you!
-
links please!
-
The emission rate probably does not increase in winter, rather, the solar induced oxidation masks the summer emission rate. The warmer temperatures would also effect the metabolic rate of bacteria.
-
Wow, what a find compare 2010 with 2011 ftp://asl.umbc.edu/pub/yurganov/methane/MAPS/NH/ARCTpolar2010.11._AIRS_CH4_400.jpg looks like he will need to change the scalebar soon.
-
"Losing the Arctic summer sea ice will accelerate the already rapid rate of Arctic warming, which will increase the rate of methane being emitted by the warming Arctic. This emergency situation for survival must go straight to the top of the global climate change agenda." http://www.arctic-me...ncy-group.org/# "Professor Peter Wadhams, on behalf of the Arctic Methane Emergency Group, spoke about this critical issue at the December 2011 American Geophysical Union (AGU) conference in San Francisco, USA. Key elements of his talk have been widely reported, following an article in the UK's Independent newspaper. (Please find copies of this and subsequent articles attached.) The substance of our concerns – and the basis for these media reports – is outlined in the attached 16-page document entitled Arctic Methane Alert. To summarise: • The loss of Arctic summer sea ice and increased warming of the Arctic seas threaten methane hydrate instability and a massive catastrophic release of methane into the atmosphere, as noted in IPCC AR4. • Research published by N. Shakhova* shows that methane is already venting into the atmosphere from seabed methane hydrates on the East Siberian Arctic shelf, or ESAS (the world's largest continental shelf), which, if allowed to escalate, would likely lead to abrupt and catastrophic global warming. • The latest research expedition to the region (September/October 2011), according to Professor I. Semiletov, witnessed methane plumes on a "fantastic scale," "some one kilometer in diameter," "far greater" than previous observations, which were officially reported in 2010 to equal methane emissions from all the other oceans put together. • The loss of Arctic summer sea ice and subsequent increased Arctic surface warming will inevitably increase the rate of methane emissions already being released from Arctic wetlands and thawing permafrost. • The latest available data indicates there is a 5-10% possibility of the Arctic being ice free in September by 2013, more likely 2015, and with 95% confidence by 2018. This, according to the recognised world authorities on Arctic sea ice, Prof. Wadhams and Dr. Wieslaw Maslowski, is the point of no return for summer sea ice. Once past this point, it could prove impossible to reverse the retreat by any kind of intervention. The data indicate the Arctic could be ice free for six months of the year by 2020 (PIOMAS 2011)." http://www.arctic-me...ders/4558749249 Ken Caldeira, Professor of Environmental Earth System Sciences, Stanford University, US; Ed Dlugokencky, PhD, National Oceanic and Atmospheric Administration (NOAA), US; Michel Halbwachs, Professor of Physics, University of Savoie, France; Veli Albert Kallio, Chairman of the Frozen Isthmuses’ Protection Campaign, UK/Finland; Jon Egill Kristjansson, Professor of meteorology, Oslo University, Norway; Mike MacCracken, PhD, Climate Institute, Washington, US; David Mitchell, Associate Research Professor, Division of Atmospheric Sciences, DRI, US; Brian Orr, PhD, former Principle Scientific Officer, Department of the Environment Stephen Salter, Emeritus Professor of Engineering at Edinburgh University, UK; Natalia Shakhova, PhD, International Arctic Research Center, University of Alaska, US; Igor Semiletov, PhD, International Arctic Research Center, University of Alaska, US; Peter Wadhams, Professor of Ocean Physics, Cambridge University, UK; Leonid Yurganov, PhD, Dept of Physics, University of Toronto, Canada. Skier, if you are going to accuse someone of "a complete lie", at least have something to back it up. Are you accusing these guys of making up a complete lie and sending it off to world leaders?
-
Actually, summer isolation oxidizes the methane. Summer foliage/algae lower CO2.
-
Before opining about trends, you need to look at the longest time frame available. It actually looks like the local ch4 sources are being exhausted, or are becoming inactive. Or, maybe they moved the sensor point(as they moved their flask collection point after a string of flagged samples).
-
When you walk down that hall could you find out how we can see the preliminary data including the flagged data?
-
I just tested them, both are working. There is probably huge traffic on the net now.
-
Sounds like their server is overloaded and they are finding ways to save time. once the data is a year old(no longer preliminary) it is stable, so they cut and paste to save rendering time.
-
For convenience i will re-post the links for this data set. The read me ftp://ftp.cmdl.noaa...._flask_ch4.html The data set ftp://ftp.cmdl.noaa...._ccgg_event.txt
-
If you look at the bottom of the graph, you will see the date it was generated. When you request a graph that has been generated recently they just give you that file rather than regenerate. If you choose the "some" option and plug in 2005, 2011, you get a 12/28 graph without the spike. If you put in 2006, 2011, you get a 12/17 graph with the spike. The spike data points were flagged between those dates.