


skierinvermont
-
Posts
13,101 -
Joined
-
Last visited
Content Type
Profiles
Blogs
Forums
American Weather
Media Demo
Store
Gallery
Everything posted by skierinvermont
-
The size of this will make it almost as bad as Laura
-
I already refuted this lie as well.
-
This is a lie, as I have explained 11 times now. Still don't think this guy is a liar bdgwx? I've posted this 11 times now and he has continued to make the same false claim, with zero evidence. He is not here in good faith.
-
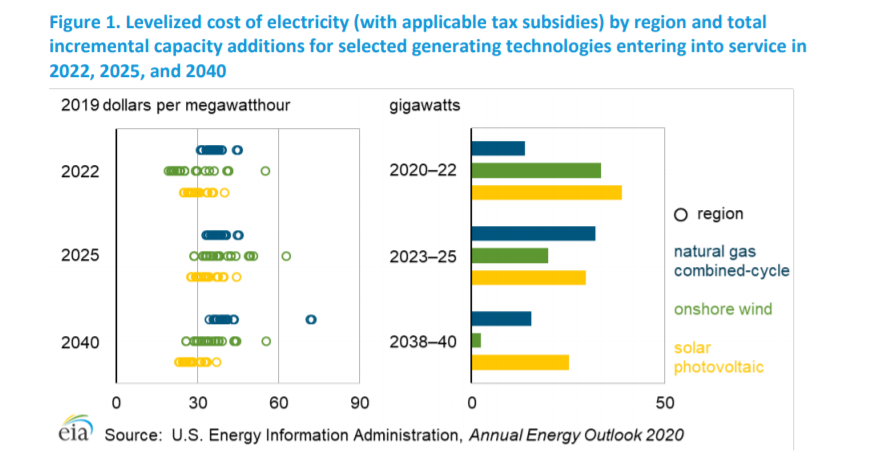
Yes this a good point Don. Even without assigning a cost to the pollution of coal and natural gas, wind and solar are still equal in cost. If you assign a cost to the pollution caused by natural gas and coal, wind and solar are far cheaper economically.
-
As the numbers I posted just showed, everything you just wrote is a lie. Wind and solar are equally as cheap and efficient as natural gas, and getting cheaper, and the free-market does embrace them equally with natural gas already.
-
Yup, 70-80% seems about right by 2035 based on the technology available today and how other countries have been progressing. My guess (based on little actual research other than what's happening in other countries and the prices I see) is that 70-80% could be achieved for 50-100B per year in federal investment. The next 10% might cost as much as the first 60% to force by 2035.
-
This is a lie and you know it is. As I have explained 7 times to you over the last month, wind and solar energy cost approximately the same as natural gas, and much less than coal. This is why wind and solar are already being chosen by the free-market and comprise nearly 50% of new electric generation capacity over the last 5 years. In other words, when a power company has to decide what new power to build, they choose either wind or natural gas, and occasionally solar, because these are the cheapest sources. With a modest investment at the federal level, this process could be sped up dramatically without any increase in electric costs (with a small cost to the taxpayer). It would dramatically improve our ozone and PM2.5 pollution in addition to reducing future climate change. Countries like Germany have already succeeded in this with only 39% of energy coming from fossil fuels, while maintaining a very high standard of living. Your Haiti and economic destruction scare tactics are despicable, fly in the face of the most basic facts (that have been shared with you 8 times now), and reveal your complete lack of objectivity. Your lies do not fool or convince anybody. https://www.eia.gov/outlooks/aeo/pdf/electricity_generation.pdf
-
You just repeated what I said. I know what ln means lol. Who do you think you are? Make up your mind. Was there significant CO2 forcing before 1945, or not? The graph you posted said that the warming before 1945 can't be CO2 because almost all the CO2 was after 1945. Now you're saying the opposite. Such a joke. The reality is significant CO2 forcing occurred before 1945.
-
Yes I was going to point out the same thing. He's straight contradicting himself. And as he well knows, the radiative forcing of CO2 is logarithmic and so just because the large majority of CO2 emissions occurred after 1945, doesn't mean the large majority of the forcing did (still a majority, but there was significant CO2 forcing before 1945).
-
I’ll add to what don already said. As I have explained before and you have ignored, one of the ways scientists know ocean heat content back then is sea level rise. The primary cause of sea level rise has been thermal expansion, thus far. Go read some papers if you have concerns about how scientists measure ohc back then. You’re not the first person to think of this. Far from it.
-
Occasional Thoughts on Climate Change
skierinvermont replied to donsutherland1's topic in Climate Change
"Not surprisingly, as Michael Moore and Jeff Gibbs demonstrate in their Planet of the Humans documentary, those real agendas are money, power, ideology and control. Especially, control over our energy, economy, industries, living standards and personal choices. " Overtly political. He is who we always knew who he was. The self-promotion, politics, and fossil-fuel connections of Spencer, Christy, and Lindzen do not make for objectivity or good science. -
Occasional Thoughts on Climate Change
skierinvermont replied to donsutherland1's topic in Climate Change
Oh I completely misread your post, thanks! -
Occasional Thoughts on Climate Change
skierinvermont replied to donsutherland1's topic in Climate Change
https://www.nytimes.com/2018/03/12/upshot/china-pollution-environment-longer-lives.html Interesting article on Chinese air pollution. The authors estimate that the improvements in air quality already achieved have increased life expectancies by 2.4 years nationally and 3.3 years in Beijing where average PM2.5 concentrations have fallen 35% according to data confirmed by foreign consulates. China's air pollution is still horrific, and their government is terrifyingly totalitarian, but this is at least one positive development. They also note the irony that communist China is adopting a market based solution to CO2 emissions (cap and trade), while 'capitalist' America has rarely used such market based solutions. Hopefully China will use a similar market based approach to other pollutants as well. -
Occasional Thoughts on Climate Change
skierinvermont replied to donsutherland1's topic in Climate Change
Don are you referring to their last 5 year plan or their 3 year pollution plan (https://www.loc.gov/law/foreign-news/article/china-2020-air-pollution-action-plan-released/)? -
Occasional Thoughts on Climate Change
skierinvermont replied to donsutherland1's topic in Climate Change
Well most cars are made where they are sold. The best selling Camry is produced in the U.S. although some parts are imported. The car sells well internationally too so you are right we are linked to those markets. It sounds like the hybrid sells better internationally. So we could see more of that where one version is sold in the U.S. and another version internationally so they can keep their R&D costs down. Either way I see the U.S. market as big enough to support gas vehicles for a long time to come. The F-series trucks are heavily skewed towards U.S. sales already (80-90% I think), for example. -
Occasional Thoughts on Climate Change
skierinvermont replied to donsutherland1's topic in Climate Change
I think the u.s. market is probably big enough to offer a decent range of gas gars. The range of models might come down a bit and bump in price slightly. I think the main driver of evs in the u.s. will be consumers but it will only get us to 30% by 2040. -
Occasional Thoughts on Climate Change
skierinvermont replied to donsutherland1's topic in Climate Change
As will we unfortunately. It wouldn’t surprise me if China had cleaner air than the u.s. in 30 years. Their air is terrible but they are improving and take the issue seriously. -
Phoenix Records its Hottest Summer on Record
skierinvermont replied to donsutherland1's topic in Climate Change
1. Giss is not an outlier or biased high. If I recall Hadley shows a hair more warming in the long run. They essentially agree and I have reviewed and even used to believe all of the skeptic claims of flaws in these sources. Once I learned more I understood that these sources are accurate within their published uncertainty estimates. This is a huge claim and requires major evidence of which you’ve provided none. 2. Long term ohc data is not that unreliable because we have sea level rise to corroborate it. Sea level rise is primarily due to ohc increase so it simply becomes a math equation using the expansion property of water. You’ve provided no evidence to make this tremendous claim. 3. The last paper included natural forcings I believe so your assertion that it assumes all warming since the 70s is man made is false. 4. others already covered the nhc 5. There had been a measured increase in droughts and heatwaves globally over the long term, so the California is wildfires are partially attributed to agw. Even curry says this although she used the word fractionally. Again you have provided no evidence that the global increase is attributable to something else. 6. The only part of what you said with which I agree is that the media is a hype machine. The fires and hurricanes are not 100% agw. Especially not the hurricanes. 7. The whole point of my post wasn’t to get into it on your unproven anti-science claims. The point was that contrarian views are frequently published and cited in the field when there is actual evidence and sound reasoning. -
Phoenix Records its Hottest Summer on Record
skierinvermont replied to donsutherland1's topic in Climate Change
Well the anti-science people will tell you all about how hot the medieval warm period was and how the current temperature record is being fudged to show more warming. So yeah you've presented a very simple very solid argument, but it still rests on a couple of points that some people manage to dispute -
Phoenix Records its Hottest Summer on Record
skierinvermont replied to donsutherland1's topic in Climate Change
tip of iceberg.. all published in major journals and cited by IPCC.. there is no widespread effort to suppress contrarian views or views that play down the effect of climate change. These papers are taken seriously in the field. Internet drivel is not. A lower and more constrained estimate of climate sensitivity using updated observations and detailed radiative forcing time series https://zenodo.org/record/918270#.X2Kx42hKhPY https://ui.adsabs.harvard.edu/abs/2015ClDy...45.1009L/abstract - published by Judith Curry and widely cited by climate science - good example of how using actual evidence and logic gets you published and respected http://eprints.whiterose.ac.uk/76064/7/ngeo1836(1)_with_coversheet.pdf https://esd.copernicus.org/articles/11/737/2020/esd-11-737-2020.pdf - demonstrates that models with high estimates of climate sensitivity are likely wrong -
Phoenix Records its Hottest Summer on Record
skierinvermont replied to donsutherland1's topic in Climate Change
So all humans are biased (I agree) but only climate science is basically completely wrong in your opinion. lol. As I said before, and to which you did not respond, there are lots of papers and evidence published that suggest lower climate sensitivity or lower impacts from warming The peer-review process is the best process science has to make sure mistakes aren't being made. Pointing out mistakes of your peers is also an easy way to fame and success in science. The oil industry has also been funding anti-climate change science for decades, but most of the papers published don't stand up to the test of time. -
Phoenix Records its Hottest Summer on Record
skierinvermont replied to donsutherland1's topic in Climate Change
lol those evil scientists are at it again! Papers that present evidence for lower climate sensitivity or lesser impacts are published all the time. -
Phoenix Records its Hottest Summer on Record
skierinvermont replied to donsutherland1's topic in Climate Change
Nobody ever said CO2 was the only factor. The interglacial warming was kicked off by earth's orbital changes. The warming took thousands of years because the orbital changes also took thousands of years. Throughout the whole process CO2 is acting as a positive feedback and making it warmer than it would be. It's entirely possible the earth could have cooled for a hundred years here or there while CO2 rose because orbital changes or some other factor caused cooling. I'm not sure that ice core data has that kind of resolution however, and you've presented no such evidence. The graphs I've seen have CO2 and temperature correlated very closely. If you presented documented evidence of CO2 rising significantly while temperature dropped significantly (and by significantly I mean more than other 3rd factors could possibly account for), that would indeed interesting. But you've presented no such evidence. The evidence is to the contrary: https://www.nature.com/articles/nature10915 Climate models do not assume the climate was in stasis in 1850. This is false - and likely a lie unless you have any evidence to back it up. Making false claims without evidence is dishonest. 3.7W/m2 is not 'very little' forcing. The earth's surface would have to warm 1.2C in order to emit that extra radiation to space. This is without the tremendous evidence of positive feedbacks that would lead to more forcing beyond the 3.7W/m2. The logarithmic nature of CO2 forcing is well understood. During the interglacials it would rise from 190 to 270. Today we are past 400. Show me what is inconsistent with CO2 acting as a positive feedback in this graph. Keep in mind the precision of the measurements may be +/-5 or 10% (would have to check the paper to confirm). Blue is temp yellow is CO2. I would say this graph is entirely consistent with the theory that CO2 acts as a positive feedback during the interglacials. It doesn't prove it. But it is consistent.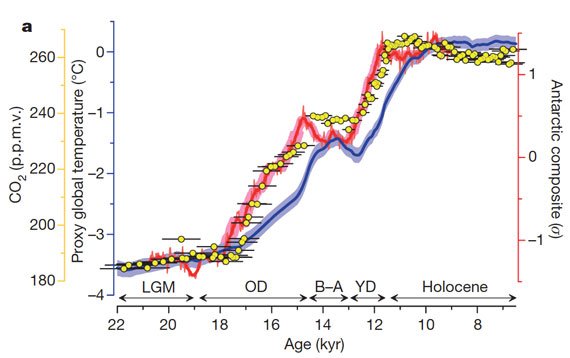
-
Phoenix Records its Hottest Summer on Record
skierinvermont replied to donsutherland1's topic in Climate Change
The paper referenced finds an effect size of ~.09C per unit of MEI (multivariate enso index). I'd ballpark the line of best fit for the MEI from 1997-2009 as decreasing 1 unit. So a cooling of .09C. The effect size for TSI is ~.1C per W/m2 (measured with the sun directly overhead). Given TSI decreased maybe .3W/m2 line of best fit, that's a cooling effect of .03C. Sum it up and the earth would have cooled .12C based on ENSO and solar alone from 1997-2009. Aerosols could have added a little more cooling. This cooling was primarily negated by GHGs (primarily CO2) providing a roughly equal warming effect. This warming effect of .12C or perhaps a bit more is similar to the 40 year background warming rate, confirming the background warming rate has stayed roughly constant. Just another way of saying what the graph I posted above shows. -
Phoenix Records its Hottest Summer on Record
skierinvermont replied to donsutherland1's topic in Climate Change
Oh true, I think I remember reading aerosols rose more or declined less during that period than others because of China. Ohc may have continued to rise at a high rate despite the aerosols partially because of the tendency towards La Niña during that period. Otherwise we might have seen a little slowdown in ohc.
