

nzucker
-
Posts
10,771 -
Joined
-
Last visited
Content Type
Profiles
Blogs
Forums
American Weather
Media Demo
Store
Gallery
Posts posted by nzucker
-
-
3 hours ago, Isotherm said:
Dew points were quite high most of August through the third week. It was very humid, and most in the Northeast corridor were slightly warmer than normal. While August was slightly cooler departure wise than expected, July compensated. The trimonthly range is most important for long range seasonals (which directly hit). I often debate whether I should even include monthlies, because it's substantially higher difficulty than the already difficult seasonal, and people will tend to myopically focus on any comparatively diminutive error in one of the monthlies.
And the "increasing heat and humidity" was taken a bit out of context. July and August certainly featured increased heat and humidity compared to June, with respect to normal. The assertion in the outlook was that the first 1/3 of summer would be coolest relative to normal with increasing warmth/humidity thereafter, which verified objectively.
I mean overall your forecast was a hit, but the idea of heat returning in the 2nd half of August never really came to pass.
July was an extremely hot month, nearly up there with '55 and '66.
Also, you went a little heavy on 90-degree days; part may be attributable to the vegetation in Central Park.
-
 1
1
-
-
We didn't really have "increasing heat and humidity" in August. I think the month finished +0.3F with 3 days that hit exactly 90F. That's not exactly a warm August.
-
On 7/12/2019 at 1:40 PM, ORH_wxman said:
Here's an animation comparing 2019 to 2012 on this date. I think the key to getting a new record is clearly going to be the Laptev/ESS side of the ice. The CAA are Atlantic side of the CAB are running way behind 2012 and those are going to be problems in sustaining the big losses.
Click to animate....

I still think it will be difficult. The ice is much higher concentration this year in the CAB/CAA, and 2012 had so much rotted ice on the Siberian side. This year, it's more just a straight line between ice/no ice.
-
On 5/2/2019 at 12:27 PM, ORH_wxman said:
Looks like Cryosat2 is done scanning for the season....based on the prelim results this year, it looks like the Beaufort, Chukchi, and western ESS are thicker than last year, but the eastern ESS and parts of Laptev are thinner.
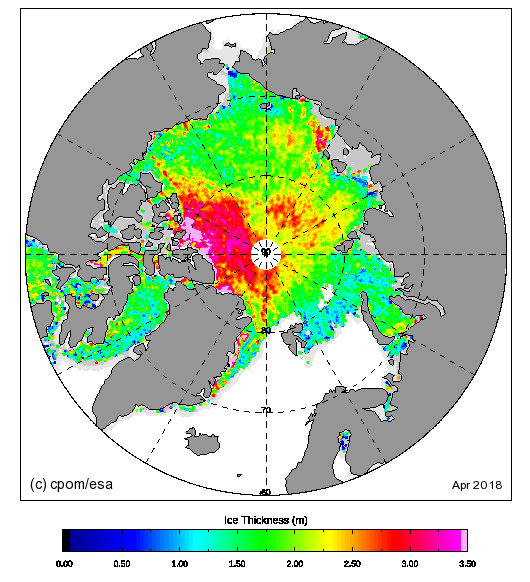
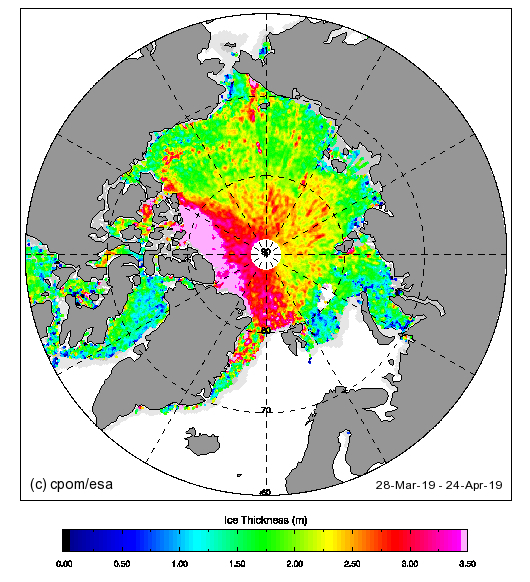
Also looks like significant improvement north of the CAA and Greenland.
-
On 2/16/2019 at 11:40 AM, KEITH L.I said:
10-11..constant snowcover from Boxer Blizzard to the middle of February..almost 2 months
Boxing Day, you mean? Lol.
-
On 2/2/2019 at 9:19 PM, uncle W said:
1995-96 went a head of 2011 on Feb. 16th...2011 had 57.2" but 1996 went a head with 60.9"
2010-11 got the good pattern back too late...we had a very cold end of March with snowfalls on 3/21 and 3/24 in Westchester, but it was too late to get more than a few more inches. I remember there were still patches of snow on 4/1 in Dobbs Ferry, and there was some snow/sleet that mixed into a rainstorm in mid-April. That winter did not want to go. Had 3 huge storms from 12/26-1/26...there was 25-30" on the ground after that and then again after the 2/2 ice storm. I think I measured 26" in my front lawn. It was a glacier too; I still remember the moon reflecting off the snowpack as I went to visit a friend.
-
1
-
-
5 minutes ago, gravitylover said:
I dunno, now that I'm cleared to get out and do outdoor things again I really want to go for a bike ride so snow isn't what I'm hoping for. I went for a short hike in the woods yesterday and now my brain is screamin' for the type of therapy that only a mt bike ride in the woods can provide. C'mon spring
")
Thank god your health is improving. Your recovery rate seems to be impressive.
-
2
-
-
17 minutes ago, Save the itchy algae! said:
The sun has far more power on our planet than CO2, it borders on ridiculous to suggest otherwise. That study is not powered well, and I'm pretty sure that institution has been known to push agendas for funding purposes in the past. The only thing that has a remotely higher impact on us than the sun are things like drastic changes in oceanic composition and planetary events like super volcanoes and meteors. I don't mean to come across too critical, you just seem too set in your ways.
Yes but the changes in solar output are much smaller in effect on radiative forcing than the cumulative influence of rapidly rising atmospheric CO2 concentrations.
-
2
-
-
8 hours ago, ORH_wxman said:
I still think the ice there has weakened quite a bit though...there's still some yellows mixed in there. But that area will def be crucial to how low 2018 goes. There isn't going to be much melt in the solid purple areas of the CAB since that region has seen very little melt ponding so it's going to come down to the "ESS arm". The central CAB was actually getting snow fairly recently....unlike 2015 where it was getting crushed by an epic high pressure all July. This is why I think it will be tough to get into a top 5 extent year.
It's weakened somewhat but not NEARLY as much as the 7/27 map showed; that was almost certainly due to satellite error. That image had <75% concentration over a very large area. Seeing the new map, I doubt it melts completely in the East Siberian arm.
-
13 hours ago, csnavywx said:
Worldview seems to corroborate the satellite data. Lots of soupy/ragged looking ice over there. Typically symptomatic of a reduction of floe size as it thins.
It looked relatively fine up until the 15th or so, but deteriorated quickly after that.
I may have been right...looks dramatically different today, more similar to before. These satellite maps are prone to short-term error due to clouds and other variables. Ice is much higher concentration now:

-
1
-
-
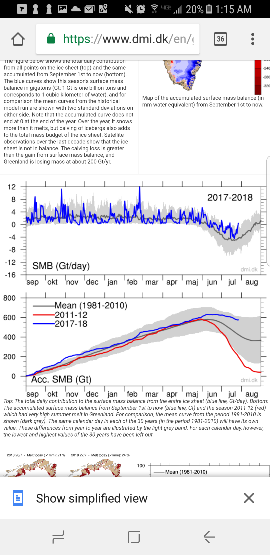
Greenland still seeing near record high surface mass balance for July, however. Very benign melt season there, so far.
-
58 minutes ago, ORH_wxman said:
Wow. A friv post...must mean something exciting is happening in melt season.
All joking aside, I still appreciate the friv analysis...he even gets sh*t at neven's forum for not being alarmist enough.
But i I agree with friv here...this is pretty impressive in the ESS. It's going to melt down far...more than what we thought possible even a few days ago. This is probably a combo of weak ice growth there and some intense warmth that happened early in July which wiped out the snow cover on the ice. The snow cover on the ice is an underrated aspect...esp in FYI.
We may challenge a top 5 here...I think top 3 is still out of reach but a top 5 is possible. Esp in area. I think a top 3 in extent will be hard. 2015 compacted a lot and we would need to see big compaction again. Esp since the CAA is still pretty icy compared to the low years.
Are we sure that isn't satellite error? It seems like an awfully big change from just a week or so ago, not sure if that's possible.
-
58 minutes ago, ORH_wxman said:
No, 2009, 2013, and 2014 have fallen behind the melt pace of 2018...we're pretty close to 2017 right now actually. I am expecting though that we will stall pretty good since we've now almost melted out the Kara/Hudson and the pattern in the CAB is pretty good for the ice for the foreseeable future. We're way behind years like 2007 and 2012 or 2016 so there's basically zero chance to have something like a top 3 finish. I don't have the exact numbers in front of me at the moment, but I'll post them as soon as I have a chance.
Based on where things stand right now, I'm expecting a result a little lower than a 2013/2014 but higher than last year. We'll see if that changes.
Looks above most recent years on Bremen extent:

-
1
-
-
On 7/16/2018 at 9:51 AM, ORH_wxman said:
There's a decent amount of really low concentration ice in the Hudson and Kara right now so I expect extent loss numbers to still remain strong over the next week, but the area numbers should stall pretty good with the big reverse dipole. I'd expect then we eventually see an extent stall once Kara/Hudson melt out.
Can you post the area numbers again, Will? Are we still close to 2009/2013/2014?
-
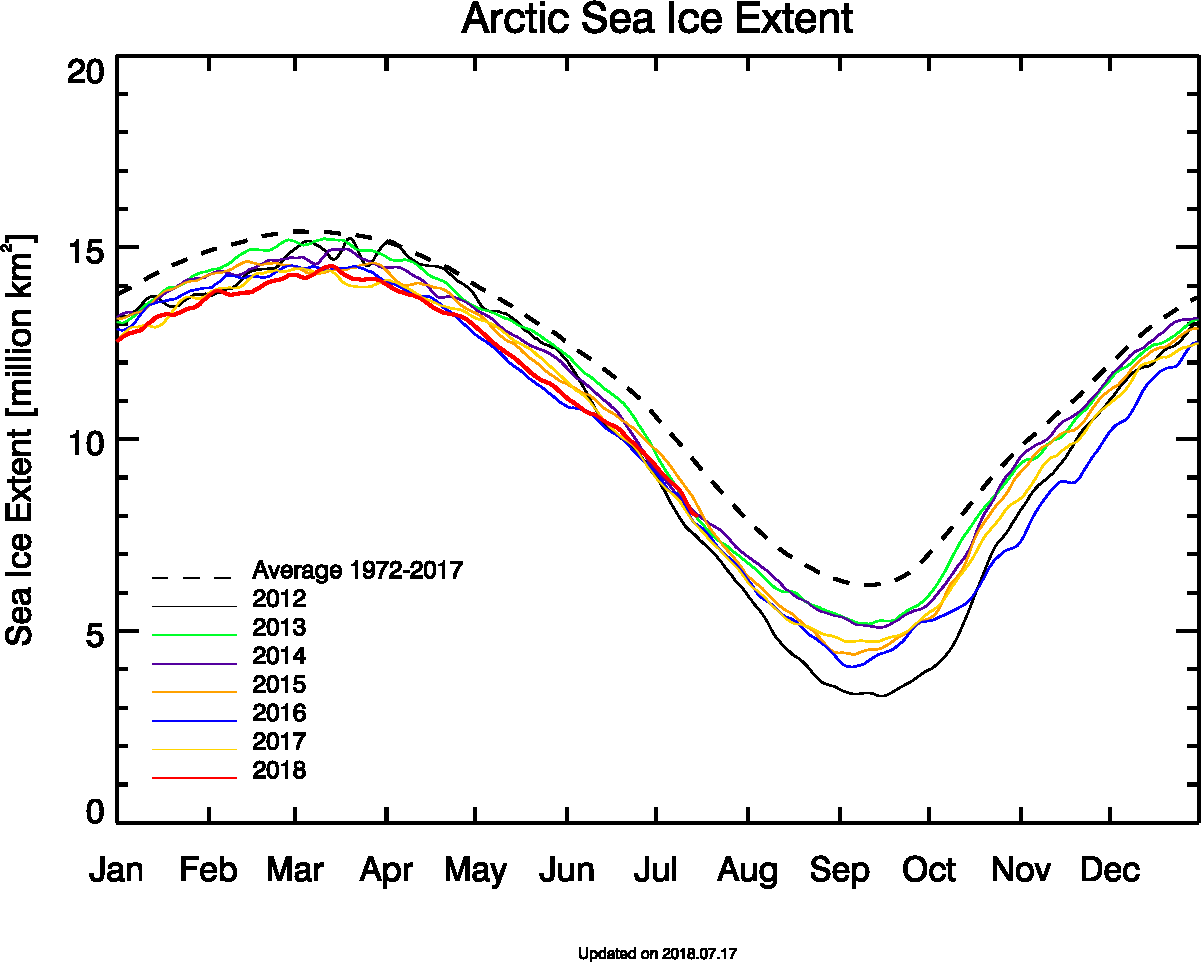
4 minutes ago, ORH_wxman said:
First check on area this season....looks like we're in the middle of the pack though skewed a little more toward the lower melt years in the post-2007 environment. We're about 30k above 2017 and about 150k below 2014.
2012's freefall was already well under way...2018 is currently 500k above 2012 at this point. There's still time though....for example, 2007 was still only 25k lower than 2018 at this point, but it went nuclear over the next 10 days losing nearly 1.5 million sq km of area...an average of about 150k per day. Not sure 2018 has the weather forecast in its favor to do anything like that.
For anyone new in here, we usually track SSMI/S area in June because it has a much higher correlation to the minimum extent in september than June extent does. The reason is meltponding...the SSMI/S sensors get fooled by meltponding so the area concentration falls. Because of this, it is giving us a measurement of meltponding which is an excellent predictor of minimum ice extent. I'll usually make a prediction of final minimum extent and area based on the area numbers at the end of June. They have worked quite well over the years with a notable exception in 2016.
Doesn't the weather forecast look increasingly hostile though with a strong ridge over the Siberian side? Even if it's not a dipole, won't that degree of warmth (like +9C 850) promote melting?
-
5 hours ago, ORH_wxman said:
The ensembles are tryng to split the PV and have one half over the Kara region and the other half over Baffin Island...with the latter weakening and becoming less of an influence. We see some weak signs of blocking trying to get into Greenland from the east as you said.
I'd def be in the "wait and see" camp though. We've seen this a lot in recent summers, where the ensembles try and do something, but every time, the PV just sort of reconsolidates over the CAA/Greenland corridor. I'd want to see a good dipole get within 7 or 8 days on the ensembles to start really thinking about a different pattern this summer. I'd also add that the GEFS are more enthusiastic about a dipole pattern than the EPS.
It still looks like just a moderate melt pattern unless the PV over Baffin Island loses all influence. It's rare to get such a widespread high pressure extending from the Beaufort to Greenland, as we had in 2012. The usual response to ridging over Alaska is lower heights and associated PV in the Baffin region.
The PV has been very stubborn in recent summers. With early indications that it is re-establishing in an environment of lower overall hemispheric heights, I remain skeptical of a 2012/2007 melt unless we see major changes.
-
1
-
-
On 5/23/2018 at 11:18 AM, ORH_wxman said:
Yeah recently, it's been colder over the arctic versus the first week of the month.
There looks to be a dipole still trying to set up as we head into June, but the sig is def weaker than it was a few days ago on the Euro ensembles....it shows more low pressure poking up from the CAA and also hanging back down from the Kara to try and go over the pole. It still has the general low pressure over the Kara area and the general high pressure over the Beaufort, but the high is covering less area than before. If we end up with some low pressure over the pole with a smaller high over the Beaufort, then the sensible wx impact of the pattern will be greatly diminished versus a true dipole blocking pattern. For bigger impact, I want to see that high sprawl to the east toward Greenland the low pressure over the Kara shift a little more toward the Barents....really start churning that fram export and also help the wind come more off Siberia.
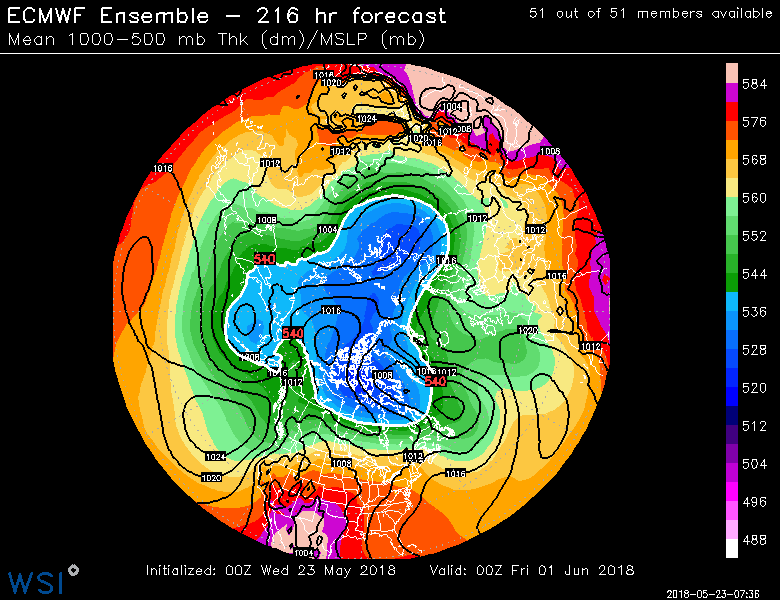
It's hard to get a strong high pressure over Greenland with the near constant vortex near Hudson Bay. Some of the long range GFS runs have shown a ridge poking into Greenland from the east, however. Do you think the PV may finally drop further south and be forced out of the Baffin/Hudson Bay region?
-
11 hours ago, ORH_wxman said:
We don't have good real time meltponding data unfortunately. We'll prob have to wait until early June when Schroeder gives an update (he's the guy who authored the original paper in 2014 on melt ponding).
The month stated off warm in the arctic, but the melt ponds typically don't get going until later in the month in the peripheral areas....and the past 7-14 days have not been very warm in the peripheral areas like the Kara, Laptev or the Beaufort where it's been an ice box. The Chukchi has been the exception...so that might be where to watch. The Laptev may try and get a good shot of warmth this week over the next few days.
Will, the maps I'm seeing are showing relatively low heights over the Arctic and overall much cooler temperatures in the Northern Hemisphere compared to recent extreme warmth...this has a weak dipole signature but still looks chilly over the North Pole and parts of the Canadian Archipelago/Greenland...the rest of the Arctic would probably be near average in this pattern:

-
On 5/21/2018 at 11:40 AM, ORH_wxman said:
Euro ensembles are showing a classic dipole pattern setting up in early June...low pressure over Kara/Laptev region with high pressure over the Beaufort and CAA. If that verifies, we would have a good jump start to the melt season in June for the first time in years.
How does melt ponding look at this point in May?
-
58 minutes ago, DaculaWeather said:
And laser beams.... don't forget the laser beams. :-)
And the contrails...don't forget the contrails.
-
28 minutes ago, skierinvermont said:
Ranting about how the Russians are punishing us with cold weather is a valid point?
Maybe ban this guy too.
I think they should both go.
Guys, this thread is about Arctic Sea Ice, not about the current cold snap in the Northeast U.S., or the Russian plot to displace cold from Siberia and move it to North America, or anything else. Keep it on track about the health and state of the cryosphere. Is that so difficult?
-
25 minutes ago, WeatherFeen2000 said:
You win. You're going to get all the snow way before us and lots of it. Any given town in the Dakota states have a way more extreme and colder winter pattern than ours. Have fun in 3 feet of snow and low of -14.
Actually plenty of areas of the Dakotas average less snow than parts of the NYC metro. Exceptions being the higher elevations in the western parts of the state like the Badlands, the Black Hills, Theodore Roosevelt Natl Park.
-
8 hours ago, WeatherFeen2000 said:
Yeah I remember now, that was an amazing winter with amazing snowpack for almost 7 weeks if I'm not mistaken
Nope, there wasn't much snowcover. The Feb 11-12 storm disappeared in a few days, and January and March both torched. There was a small period in mid-December with snow on the ground but nothing noteworthy.
-
On 9/21/2017 at 11:26 PM, forkyfork said:
another early winter for russia

Yes, this could be another good fall for Eurasian snow cover with a large ridge over the Kara/Barents area as well as a ridge over most of North America. This pushes all the cold into Russia/Mongolia/China as the PV sets up there early on.

My Summer Outlook 2019 VERIFICATION
in New York City Metro
Posted
I like the looks of a weak Niña, warm NP, and low solar activity.
How is ozone and strat temps?