
uncle W
-
Posts
9,826 -
Joined
-
Last visited
Content Type
Profiles
Blogs
Forums
American Weather
Media Demo
Store
Gallery
Posts posted by uncle W
-
-
I'll go out on a lim here and say December will be warmer than 1989...
-
91...
-
8 hours ago, Wxoutlooksblog said:
Just wait until we get that ridge over us in August.
WX/PT
that's what I'm afraid of...
-
 3
3
-
-
July 2010 was on the dry side...2011 was closer to averege...Aug 2011 was very wet...this year is not exactly wet so 100 can be reached...
-
thunder and lighting now with rain...
-
14 minutes ago, Stormlover74 said:
if central park ever reaches 100 again we'll all be dead
98 last June...100 can be reached...it will be 110 in Newark though...
-
18 minutes ago, bluewave said:
Highs around the region today…
ALB….95°
POU…94°
EWR….99°
Harrison…97°
LGA….93°
NYC….91°
Harrison was two degrees cooler and it comes from someones back yard off of Harrison ave and Davis ave...not much greenery except for some trees...
-
5 minutes ago, uncle W said:
this is how it looks for the third la nina or weak negative year...
NYC averages slightly above average for temperatures...slightly below average snowfall...
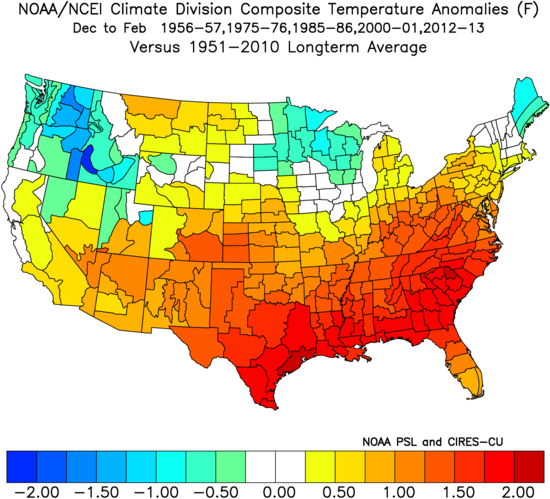
1957, 1976 and 1986 became an el nino for the next winter...2001-02 and 2013-14 were weak negatives...
-
18 minutes ago, SnowGoose69 said:
It'll probably basically fall off to nothing though by January which will make the winter forecast virtually impossible this year.
this is how it looks for the third la nina or weak negative year...
NYC averages slightly above average for temperatures...slightly below average snowfall...
-
43 minutes ago, uncle W said:
last year and this year could be off a bit...has Newark been checked lately...
Harrison was 90 today...
-
I know Newark's obs are across from IKEA between 10 traffic lanes to the SE and runways to the NW...there is a canal which is next to the obs sight...they can't find a better area on the north side of the airport?...
-
1
-
-
last year and this year could be off a bit...has Newark been checked lately...
-
40 minutes ago, forkyfork said:
ewr is 74 this month. if the park asos wasn't garbage it would be close to that
there has been talk that Newark is two degrees warmer than Harrison and Elizabeth...there are problems with the big three sights and JFK is for beach goers...
-
1
-
-
13 minutes ago, forkyfork said:
reminder: if we used normals going back 100 years we'd all be well above average this june. thanks <3
since 1870 the average June temperature in NYC is close to 71.0...since 1930 the average is 71.7...this year could end up 71.4...
-
87/64 today...79 now...
-
15 minutes ago, bluewave said:
The 1983 precipitation totals still haven’t been corrected for NYC.
https://www.nytimes.com/1983/12/31/nyregion/city-s-rain-83-record-is-in-doubt.html
The heavy rains that pounded New York City during 1983 may not have broken the annual rainfall record here, after all, the National Weather Service said yesterday. The only thing broken for certain, it said, was the official rain gauge in Central Park.
To no one's surprise, the Weather Service announced on Nov. 15 that the year's drenching rains in Manhattan had surpassed a record of 67.04 inches, set in 1972. As of early yesterday, additional rains were said to have brought the year's total to 80.56 inches.
But the Weather Service's data acquisition division in Garden City, L.I., suspected something was amiss because the Central Park readings were much higher than official measurements at Kennedy International, Newark International and La Guardia Airports.
So the gauge at Belvedere Castle in the park was taken apart. It was found to be leaky. A faulty weld apparently was allowing water to seep in the side and be measured with rain entering the calibrated opening.
No one knows how much rain fell in the park in 1983. But the Weather Service said that an official estimate based on nearby readings would be made and that ''it likely will be close to the record, either just above or just below.''
they took the record away and erased all the 1983 rainfall totals...years later they reinstated the data...
-
Newark NJ Feb 1994...no hourly precip for some reason...the 2.06" precip total on the 11th is suspect too...
-
1
-
-
Newark NJ's 18" storm on Feb 11, 1994 is wrong...no other sight had over 13"...the snow depth was 18" after the storm ended...there was 8 or 9 inches on the ground when it started...The real total should be 9 or 10 inches...
-
2
-
-
2 minutes ago, bluewave said:
While the snowfall since 2003 has been very impressive, the old method of measurement undercounted snowfall totals. So we need to adjust the earlier snowfall era measurements higher to match the current methodology. The 1888 blizzard total was based on the liquid equivalent and not an actual snow depth measurement.
https://news.ucar.edu/14009/snowfall-measurement-flaky-historyEarlier in our weather history, the standard practice was to record snowfall amounts less frequently, such as every 12 or 24 hours, or even to take just one measurement of depth on the ground at the end of the storm.
You might think that one or two measurements per day should add up to pretty much the same as measurements taken every 6 hours during the storm. It’s a logical assumption, but you would be mistaken. Snow on the ground gets compacted as additional snow falls. Therefore, multiple measurements during a storm typically result in a higher total than if snowfall is derived from just one or two measurements per day.
That can make quite a significant difference. It turns out that it’s not uncommon for the snow on the ground at the end of a storm to be 15 to 20 percent less than the total that would be derived from multiple snowboard measurements. As the cooperative climate observer for Boulder, Colorado, I examined the 15 biggest snowfalls of the last two decades, all measured at the NOAA campus in Boulder. The sum of the snowboard measurements averaged 17 percent greater than the maximum depth on the ground at the end of the storm. For a 20-inch snowfall, that would be a boost of 3.4 inches—enough to dethrone many close rivals on the top-10 snowstorm list that were not necessarily lesser storms!
Another common practice at the cooperative observing stations prior to 1950 did not involve measuring snow at all, but instead took the liquid derived from the snow and applied a 10:1 ratio (every inch of liquid equals ten inches of snow). This is no longer the official practice and has become increasingly less common since 1950. But it too introduces a potential low bias in historic snowfalls because in most parts of the country (and in the recent blizzard in the Northeast) one inch of liquid produces more than 10 inches of snow.
This means that many of the storms from the 1980s or earlier would probably appear in the record as bigger storms if the observers had used the currently accepted methodology. Now, for those of you northeasterners with aching backs from shoveling, I am not saying that your recent storm wasn’t big in places like Boston, Portland, or Long Island. But I am saying that some of the past greats—the February Blizzard of 1978, the Knickerbocker storm of January 1922, and the great Blizzard of March 1888—are probably underestimated.
So keep in mind when viewing those lists of snowy greats: the older ones are not directly comparable with those in recent decades. It’s not as bad as comparing apples to oranges, but it may be like comparing apples to crabapples.
Going forward, we can look for increasingly accurate snow totals. Researchers at NCAR and other organizations are studying new approaches for measuring snow more accurately (see related story: Snowfall, inch by inch).
But we can’t apply those techniques to the past. For now, all we can say is that snowfall measurements taken more than about 20 or 30 years ago may be unsuitable for detecting trends – and perhaps snowfall records from the past should not be melting away quite as quickly as it appears.
https://www.wunderground.com/cat6/US-Snowfall-1900-2019-Decade-Decade-Look
As an observer who has used both techniques during his now-29-year COOP tenure in Boulder, Mr. Kelsch estimates that for extreme snowfalls the use of six-hourly snowboard measurements can result in snow totals that are 15 to 20 percent greater than what is actually measured on the ground. The potential for confusion became evident after New York’s official Central Park site reported a 24-hour snowfall of 26.8” on January 22-23, 2016, a new all-time record for New York City. That total was adjusted upward even higher, to 27.5”, after an NWS review found and corrected an error in the transmitted snow report. However, local weather-minded residents living near the site in Central Park (and there are many of those!) measured only 18” to 22” on the ground at the end of the storm.
At Newark International Airport, observations from the same storm showed a preliminary record of 28.1”. That total was declared invalid by the NWS because the private contractor who measured the snowfall took snowboard measurements once per hour, as opposed to the standard six-hour interval. The revised total of 24.0” fell short of the record of 25.6” set on Dec. 26, 1947.
Another example: The great Blizzard of March 1888 brought Central Park 2.10” of melted precipitation, resulting in the official 21.0” snowfall reported. Since temperatures during the height of the blizzard were in the low teens, it is likely that the ratio was much greater than 10 to 1, and thus the actual snowfall considerably more than the 21.0” officially reported.
all the big storms from my youth were measured when the snow ended...the 26" in 1947 must have been over 30" if measured today...the Feb 1978 storm was 17.7" falling on a trace of leftover snowcover...the total snow depth after the storm was 18"...Jan 12-13th 1964 had 12.5" measured...the snow depth after the storm was 13"...no snow on the ground when it started...many more examples of this in the 60's and 70's...
-
5
-
-
7 hours ago, SnowGoose69 said:
Yeah I forget when they moved it. My guess is probably 1996. I was also told once snow measurements prior to the 93-94 winter are questionable (yeah we know they are questionable after too lol) but the reason told to me was they used to measure somewhere downstairs from the NWS office up til 92-93 and the measurements were likely too low most times
I think we can all agree Central Park, Newark and LGA have issues...The NWS was at Rockerfeller Plaza...Did they measure there?...in the 1890's snow was measured in lower Manhattan...some of those totals were higher than Central Park especially the 1892-93 and 1893-94 winters...more snow fell in 1892-93 than 1995-96...some big descrepancies with snow totals from lower Manhattan and Central Park...
-
15 minutes ago, bluewave said:
Central Park is wrong since the old sensor used to be out in the open instead of under the trees before the 1990s. Deep shade with leaf transpiration can shave at least 2-3° off the high temperature on sunny days. That’s why the highs used to be much warmer at Central Park before the overgrowth in the 1990s. A sensor on the Great Lawn in Central Park would be at least 2-3° warmer than under trees.
someone with a shield and temperature probe should stand in the middle of the great lawn during the hottest part of a Sunny day and then compare readings....Newark is getting warmer and development to its west doesn't help cooling things off...Prosect Park in Brooklyn is probably cooler than surrounding built up areas...many years ago there was obs taken from that park but I have never seen them...
-
2
-
-
the area from Newark southwestward to Piscataway is the hottest part of the near New jersey area...add parts of Staten island to that...both down hill from hilly areas...
-
1
-
-
1 minute ago, bluewave said:
Not if you are using dense ranking like the NWS OKX climate page does.
https://towardsdatascience.com/how-to-use-sql-rank-and-dense-rank-functions-7c3ebf84b4e8
Differences between RANK and DENSE_RANK
The difference between these two functions comes down to how they handle identical values. Let’s say we have two students who have the same grade; both scored 90s on their math test.
RANK and DENSE_RANK will assign the grades the same rank depending on how they fall compared to the other values. However, RANK will then skip the next available ranking value whereas DENSE_RANK would still use the next chronological ranking value.
So with RANK, if the two 90s are given a ranking of 2, the next lowest value would be assigned a rank of 4, skipping over 3. With DENSE_RANK, the next lowest value would be assigned a rank of 3, not skipping over any values.
Let’s compare the outcomes of both of these functions.
Again, you can see there is no rank 2 in the column using RANK in contrast to the DENSE_RANK column which contains rank 2 and ends with rank 4 despite there being 5 rows in the table.
Hopefully you now understand how to use RANK and DENSE_RANK and when to use each. Typically, I use DENSE_RANK as my default rank function in SQL. I find more problems want you to go in chronological ranking order without skipping a number. However, make sure you read the problem carefully and think about the output you’re trying to achieve.
regular ranking was fine...no need to event the wheel again...
-
1
-
-
4 hours ago, bluewave said:
Last June was a tough act to follow for Newark. It was the 2nd warmest on record. This year Newark is currently in 14th place.
Time Series Summary for NEWARK LIBERTY INTL AP, NJ - Month of Jun
Click column heading to sort ascending, click again to sort descending.RankYearMean Avg TemperatureMissing Count1 1994 77.8 0 2 2021 76.2 0 - 2010 76.2 0 3 1993 75.8 0 4 1943 75.4 0 5 2008 75.3 0 6 1984 75.0 0 7 1971 74.8 0 8 2005 74.6 0 - 1981 74.6 0 - 1973 74.6 0 9 2011 74.5 0 10 2020 74.4 0 - 1987 74.4 0 11 1989 74.3 0 12 1999 74.2 0 13 1991 74.1 0 14 2022 74.0 3 15 2001 73.9 0 16 1966 73.8 0 - 1957 73.8 0 17 1949 73.7 0 18 1976 73.6 0 19 1983 73.5 0 20 1990 73.4 0 - 1952 73.4 0 its really the 18th mildest with 17 years ahead of it...
Summer Banter
in New York City Metro
Posted
another la nina December with blocking could be very good like 2000...or bad like 2012...