
uncle W
-
Posts
9,826 -
Joined
-
Last visited
Content Type
Profiles
Blogs
Forums
American Weather
Media Demo
Store
Gallery
Posts posted by uncle W
-
-
I felt a drop before...
-
 3
3
-
-
3 minutes ago, Roger Smith said:
Since I am doing research involving the NYC data base, I would be interested in thoughts about how long the tree canopy issue has possibly been affecting temperatures and by what amount, also could we say it was an issue only during foliation season? How strong a wind negates it?
My belief is that the July 1936 heat wave would have registered something well over 100 F even in today's setting, but that aside, I am looking at comparing data with urban effects considered, and this tree canopy issue is an urban effect in the opposite direction to the urban heat island. My comparisons assumed a gradual rise in the u.h.i. throughout the data set to 1980 and a level signal since 1980 (at some point the urban area gets so large that increases stop happening near its center and are observed further out). The adjustments are more relevant to minimum than maximum temperatures for urban heat islands (typically, if an urban heat island is on the order of 2 F deg, then the average increases will be 0.5 daytime and 3.5 overnight).
So I am considering adjusting the urban filter that I applied to include this tree canopy issue, any suggestions? Or is there an argument to be made that larger tree canopies have spread through significant portions of the metropolitan area therefore this is just part of the historical trend and something not to be filtered out, since we don't filter out changes to the agriculture of the great plains etc.
urban heat island is enhanced by the suburb heat island and soon it will be one big island...I think using record lows from the 1800's only show how cold it could get if everything was still trees and farms...start when electronics took over?...
-
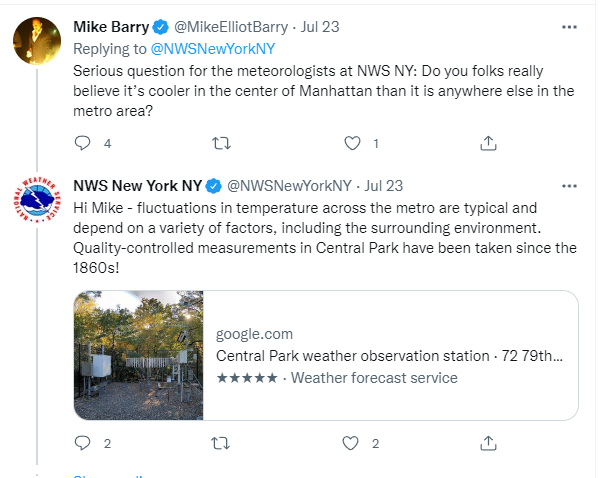
15 minutes ago, TWCCraig said:
In regards to the Central Park issue, this was OKX's response when someone asked about it. Wow
except snow measurements...
-
6 minutes ago, Stormlover74 said:
Oldies means 80s now
lol...I stopped listening in the early 1980's...
-
5 minutes ago, HailMan06 said:
It’s 101.5 what do you expect?
oldies?...
-
NYC has 3.45" of rainfall this month...Newark 0.39"...big reason for the Newark area being so hot...
-
 1
1
-
-
2 minutes ago, uofmiami said:
Fan aspirated?
no need today with the wind we have...
-
can someone show what town has the perfect weather observation sight?...I think Newark and Harrison are right because that's what it is there...Harrison is in someones back yard and Newark is where it is...mine was on my roof back when...I've seen one on rt206 near Bedmunster...traffic is very close to the equipment...
-
1
-
-
this is the most compfortable major heat wave I can remember...
-
2
-
1
-
-
July 7-13, 1993 was one of the hottest weeks on record...
Newark.....
day...max...min...
07.....103.....78
08.....105.....82
09.....104.....83
10.....105.....84
11........99.....80
12........97.....80
13........98.....79
-
3
-
-
only 97 imby before the sea breeze...89 now...
-
1
-
-
92...
-
18 minutes ago, SACRUS said:
10 AM Fry up
ACY: 91
JFK: 91
PHL: 91
New Brnswck: 90
EWR: 89
BLM: 89
TEB: 88
ISP: 87
TTN: 87
LGA: 86
NYC: 84lets all go to Central Park and cool off...
-
3
-
-
in July 1966 NYC had 13 of 14 days above 90 with a few 100's for good measure but dew points averaged mid 60's at best...
-
98 three days in a row imby is a real heat wave...its been dry here so the humidity is much lower in my hood except for a drop or two a little while ago...a drop in the bucket so to speak...down to 88 now...
-
1
-
-
1 hour ago, bluewave said:
These are among the lowest soil moisture levels from Central NJ to the LI South Shore in late July.
https://www.drought.gov/data-maps-tools/nasa-sport-lis-soil-moisture-products

i'm in the dark red or should be...
-
2 minutes ago, Rjay said:
Forky was hiking in this shit.
when I was in my 20's I would ride my bike in this crap...hiking in the woods is different than walking in the city...its a lot cooler....its like having a weather obs sight in Central Park...
-
1
-
-
I was inside with the ac going like the rest of the board members...even the hot trollers...
-
1
-
-
98...oh the humanity...
-
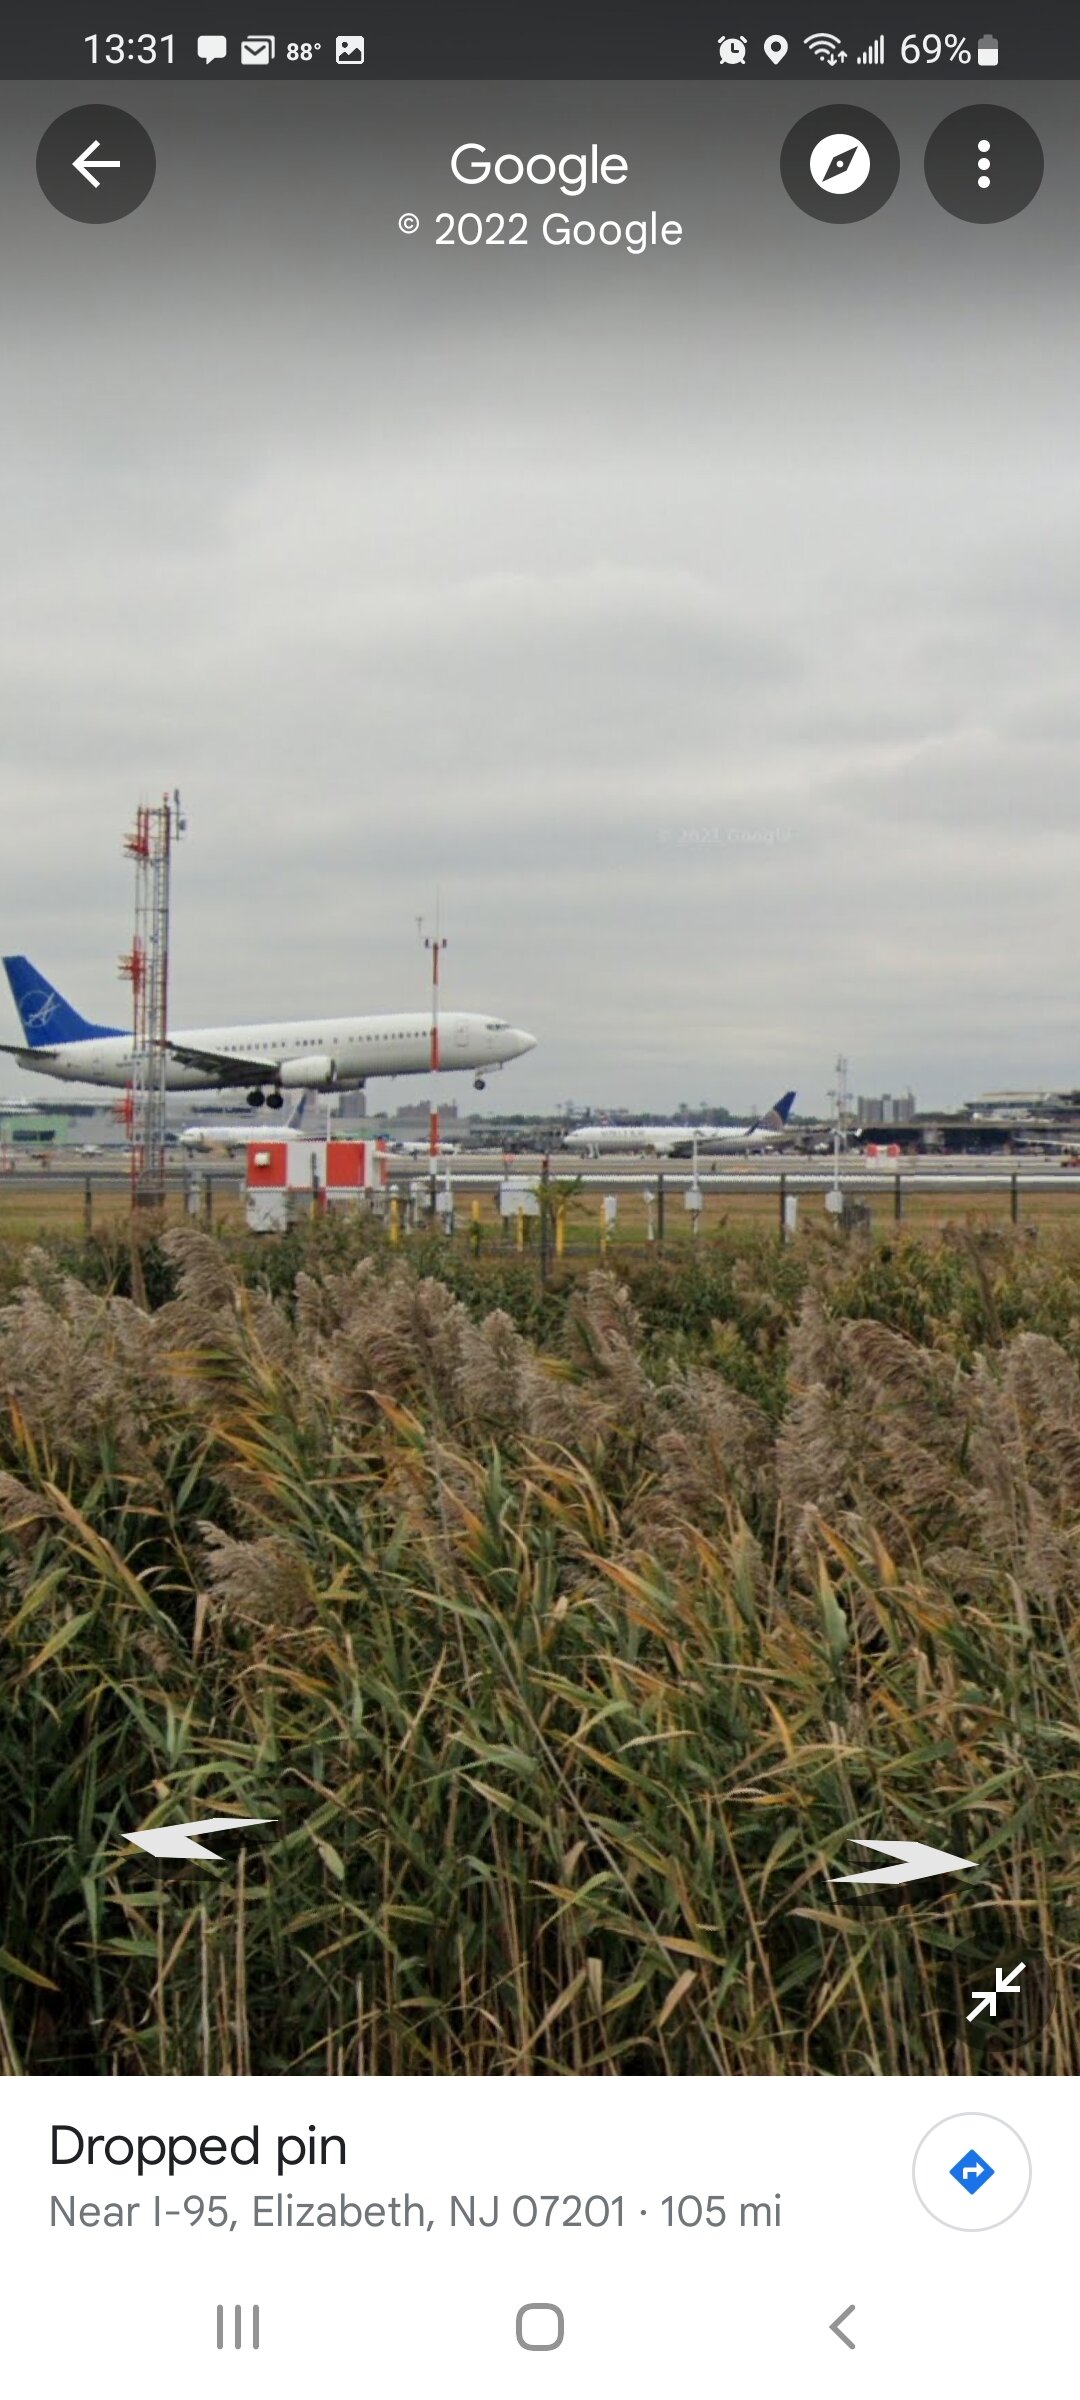
53 minutes ago, wthrmn654 said:
Newark Airport equipment looks fairly mint, visible from the turnpike.
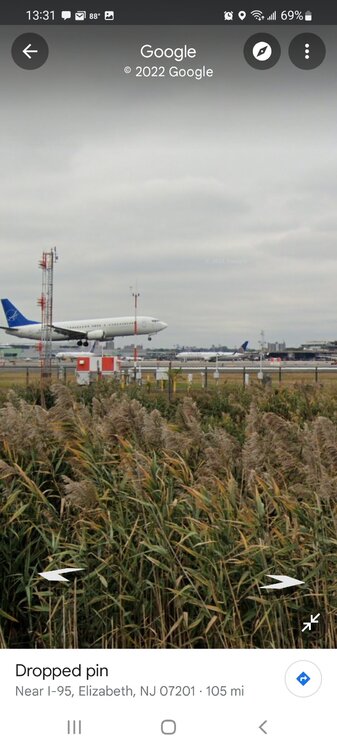
there is a little canal between the airport and turnpike and a huge frying pan to the west...
-
95...down from 98 a while ago...
-
some of these sights are wrong...most are right but fix the bad ones like the Newark Firehouse...
-
43 minutes ago, bluewave said:
The cold January this year was the one outlier from our new climo since 2010. December was the warmest departure month of winter as usual. The record heat at the end of May matched the typical highest departure month of spring. The slow start to summer in June for most was right on also. Now the expected big July warm up right on cue. The August departure should be higher than June was. Then our classic endless summer pattern in September.
The monthly temperature increases from 81-10 to 91-20
……….EWR…..ISP
Dec…+1.5….+1.5
Jan….+1.2…+1.3
Feb….+0.5….+0.5
Mar….+0.4….+0.6
Apr….+0.5…..+0.6
May...+0.6….+0.9
Jun….+0.3….+0.6
Jul…..+1.4…..+1.1
Aug...+0.6….+0.9
Sep….+1.0….+1.3
Oct…..+0.9..+1.4
Nov….+0.2..+0.5
that doesn't include the lack of thunder storms until recently and snowfall that was basicly in January only...
-
the summer is behaving like the winter by starting slowly but picking up speed mid January as the summer started out slowly and is hot now...if the trend continues August wont be as hot like February wasn't as cold...one can only hope...
-
2
-

July 2022
in New York City Metro
Posted
I had a brief thunder shower that barely wet the ground...