

wxmx
-
Posts
3,684 -
Joined
-
Last visited
Content Type
Profiles
Blogs
Forums
American Weather
Media Demo
Store
Gallery
Posts posted by wxmx
-
-
Quote
Product: Air Force Vortex Message (URNT12 KNHC)
Transmitted: 20th day of the month at 18:00Z
Agency: United States Air Force
Aircraft: Lockheed WC-130J Hercules with reg. number AF97-5305
Storm Number & Year: 15 in 2017
Storm Name: Maria (flight in the North Atlantic basin)
Mission Number: 9
Observation Number: 05
A. Time of Center Fix: 20th day of the month at 17:40:20Z
B. Center Fix Coordinates: 18°32'N 66°56'W (18.5333N 66.9333W)
B. Center Fix Location: 58 statute miles (93 km) to the W (279°) from San Juan, Puerto Rico (U.S.).
C. Minimum Height at Standard Level: 2,744m (9,003ft) at 700mb
D. Estimated (by SFMR or visually) Maximum Surface Wind Inbound: 76kts (~ 87.5mph)
E. Location of the Estimated Maximum Surface Wind Inbound: 20 nautical miles (23 statute miles) to the W (269°) of center fix
F. Maximum Flight Level Wind Inbound: From 22° at 85kts (From the NNE at ~ 97.8mph)
G. Location of Maximum Flight Level Wind Inbound: 33 nautical miles (38 statute miles) to the W (271°) of center fix
H. Minimum Sea Level Pressure: 960mb (28.35 inHg)
I. Maximum Flight Level Temp & Pressure Altitude Outside Eye: 10°C (50°F) at a pressure alt. of 3,046m (9,993ft)
J. Maximum Flight Level Temp & Pressure Altitude Inside Eye: 14°C (57°F) at a pressure alt. of 3,044m (9,987ft)
K. Dewpoint Temp (collected at same location as temp inside eye): 12°C (54°F)
K. Sea Surface Temp (collected at same location as temp inside eye): Not Available
L. Eye Character: Poorly Defined
M. Eye Shape & Diameter: Circular with a diameter of 16 nautical miles (18 statute miles)
N. Fix Determined By: Penetration, Radar, Wind, Pressure and Temperature
N. Fix Level: 700mb
O. Navigational Fix Accuracy: 0.02 nautical miles
O. Meteorological Accuracy: 1.5 nautical miles
Remarks Section:
Maximum Outbound and Flight Level Wind: 102kts (~ 117.4mph) which was observed 35 nautical miles (40 statute miles) to the NE (45°) from the flight level center at 17:50:30Z
Dropsonde Surface Wind at Center: From 205° at 11kts (From the SSW at 13mph) -
959.4 extrapolated MSLP and 97FL/91SFMR in the NE quad. There's a chance it might be downgraded all the way to high end Cat 2
-
2 minutes ago, donsutherland1 said:
Ultimately, yes. But by then Maria will already have found the weakness in the ridge (due in part to Jose's current expansive circulation) and Jose's remaining circulation will still have enough influence to assist in Maria's turning out to sea. IMO, it's no coincidence that the earlier GFS runs that showed Maria posing the greatest chance of landfall were those that also featured much faster weakening in Jose, along with its faster departure from the scene so to speak.
On that I agree.
-
 1
1
-
-
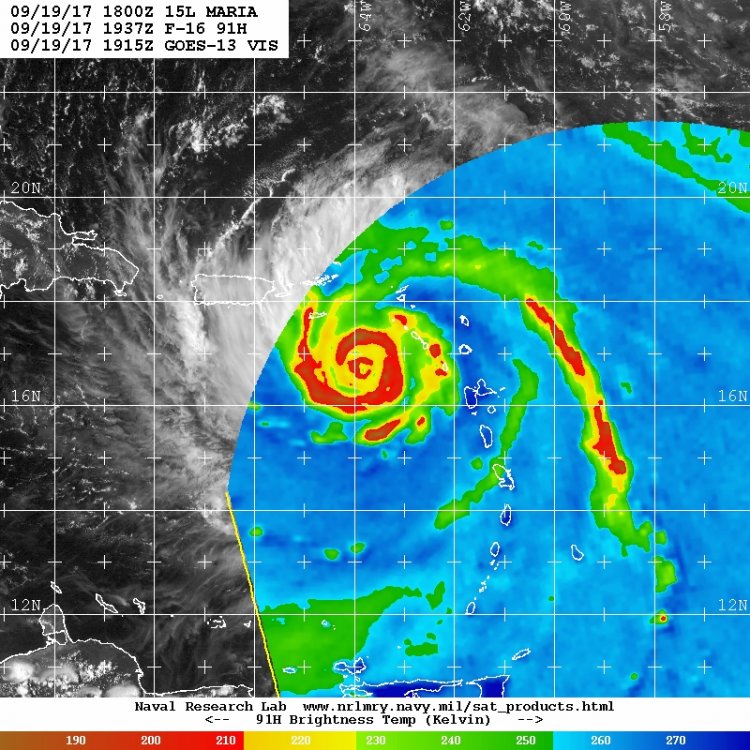
8 minutes ago, Drz1111 said:
I think the ll vortex is jumping to the coast b/c of the lee cyclogensis.
Visible shows the eye is almost fully offshore now. When recon approached, they got into part of the eye, but winds were still above 20 kts in there. Eye looks big, probably around 30 nm or so. Highest winds were 89FL/87SFMR, but I expect higher winds in the NE quad. My WAG is low end cat 3 right now.
-
2 minutes ago, donsutherland1 said:
Maria might have a little influence, but Jose currently has the larger circulation. Jose's IKE is also quite a bit higher than Maria's despite Maria's intensity. That also suggests that Jose is more likely to have a greater impact on Maria's track than Maria would have on Jose's track. Jose is also leaving a weakness in the ridging that might otherwise be more expansive, thus allowing Maria greater opportunity to find that larger weakness.
That is now, but Maria's circulation is expected to grow as it gains latitude, while forecasts for Jose show it gradually weakening. Forecasts show that Maria will be the dominant feature, by far, in case of an interaction.
0z Euro and 12z GFS
-
1
-
-
Eye is still partially inland, but looking at data from recon, pressure is probably up in the 950s
-
Latest Maria's IKE @11 pm EDT calculated by myself is 46 (up from 38 @5 pm EDT). SDP (Surge Destructive Potential Index), up to 3.7 from 3.4 (out of a max of 6)
-
1
-
-
1 minute ago, NoOneAtAll (NOAA) said:
Would appreciate someone looking at this display of wind speeds (set at surface but adjustable up - click "earth" for menu) in Maria:
I can't get a result that equates with Cat 5 speeds anywhere. Is this site getting faulty data or is there another explanation?
Thx.
Low resolution
-
2 minutes ago, bdgwx said:
I'm getting about 40 nm for the OEW and 8 nm for the IEW. I always measure perpendicular to the beam so that my reference points are at the same height.
Radius or diameter?...maybe you are both measuring the same thing.
-
1
-
-
1 minute ago, catdaddyfalcon15 said:
857mb lol what a joke. anyway does the ERC seem to be beginning soon?
It's already underway. It will take many hours to complete, if at all, taking into consideration the outer eyewall is still very large and the inner one is just beginning to show signs of being "choked"
-
4 minutes ago, WishingForWarmWeather said:
Is there a good link/resource you like to use to read up on TIKE versus IKE? Thank you for the information.
TIKE is just the sum of IKE during the TC lifespan. Similar to ACE
http://journals.ametsoc.org/doi/full/10.1175/MWR-D-12-00349.1
-
1
-
-
Just now, WishingForWarmWeather said:
Thank you for that info. I was a bit confused on how to use the resource but that is extremely helpful.
That seems so low for IKE. Is it because it's such a small eye and a relatively low time of being a cat5?
Time is not a variable taken into account by IKE. It's a compact storm, that's why it's "low". Andrew's IKE was around 20 at peak and Charley's around 10.
-
1
-
-
32 minutes ago, WishingForWarmWeather said:
I was trying to find the resource that calculates IKE and had no luck, except for one that wanted me to plug in my own numbers. Do you know where to find the resource that people were posting for Irma that calculated her IKE? I'd love to see that for Maria.
No, but you can use the one that wanted you to plug the numbers. I explained where to get the data here
I got an IKE of 38.2 for Maria using the data from the 5pm EDT advisory
-
17 minutes ago, Paragon said:
IKE is the best way to judge how high the storm surge will be, Jorge? I wish we could calculate the IKE of some historic storms that supposedly had amazingly high surges, like the 1821 Hurricane (29 foot surge in NJ). Katrina and Sandy also must be high on the list. Does it also work with Pacific typhoons and super typhoons like Haiyan?
How high the storm surge will be? It's a good indicator, there's actually the SDP (surge destruction power) that's related to IKE. But there are other factors not taken into account, like coast geography, angle of approach and historic IKE prior to landfall.
My SDP calculations yield an index of 3.2, out of a scale that goes from 0 to 6, where 6 is the max destruction power. Katrina had an index of 5.2
-
1
-
-
10 minutes ago, Paragon said:
IKE is the best way to judge how high the storm will be, Jorge? I wish we could calculate the IKE of some historic storms that supposedly had amazingly high surges, like the 1821 Hurricane (29 foot surge in NJ). Katrina and Sandy also must be high on the list.
.jpg.426ee99b4fa736206af7fd3a0f7dcfd4.jpg)
-
1
-
-
5 minutes ago, JC-CT said:9 minutes ago, wxmx said:Not sure what you are talking about. I'm comparing IKE when the mentioned historic storms were at their max IKE.
I guess my point is that storms with a lot lower SS rating have had a similar IKE.
Gotcha. My point with that statement was to show skepticism at the 60TJ IKE figure. My own calculations point to around 40TJ
-
Just now, JC-CT said:1 minute ago, wxmx said:Did you follow the links? You have to input data related to size
No I did not. Just responding to the last sentence, to not create confusion that 60 IKE is like the max a hurricane can get. I'm sure you know that's not even close to the max.
Not sure what you are talking about. I'm comparing IKE when the mentioned historic storms were at their max IKE.
-
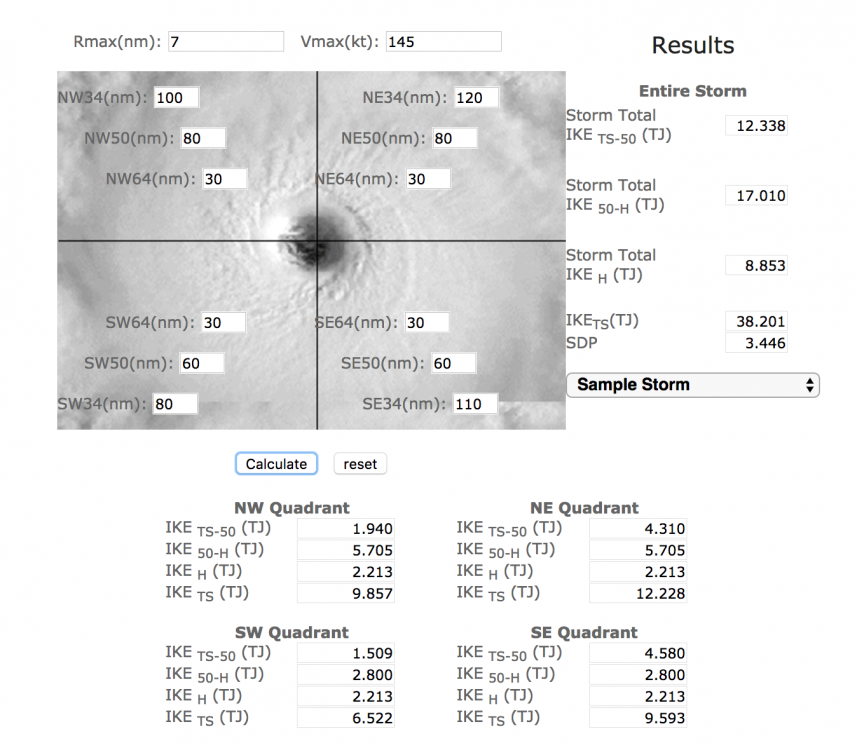
Just now, JC-CT said:2 minutes ago, wxmx said:You can calculate it yourself:
http://storm.aoml.noaa.gov/hwind/ikeCalculator/IkeCalculator.php
You can fill in the data with the latest Forecast Advisory:
http://www.nhc.noaa.gov/text/refresh/MIATCMAT5+shtml/192042.shtml?
The only data missing is the Rmax, which is the radius of maximum winds. It's not that important for results, but I calculated about 6-7 nm.
Not sure where the 60TJ came from, I think the standard is to use the IKE TS, and I only get an IKE of around 38, which is double of Andrew's, for example. Hurricanes with IKE around 60 are like Camille or Ike.
Can't really do a "hurricanes with ike around x are so and so." It takes into account a cyclone's size.
Did you follow the links? You have to input data related to size
-
1
-
-
34 minutes ago, WishingForWarmWeather said:
Does anyone have the link handy where they measure the IKE for the current hurricanes?
You can calculate it yourself:
http://storm.aoml.noaa.gov/hwind/ikeCalculator/IkeCalculator.php
You can fill in the data with the latest Forecast Advisory:
http://www.nhc.noaa.gov/text/refresh/MIATCMAT5+shtml/192042.shtml?
The only data missing is the Rmax, which is the radius of maximum winds. It's not that important for results, but I calculated about 6-7 nm.
Not sure where the 60TJ came from, I think the standard is to use the IKE TS, and I only get an IKE of around 38, which is double of Andrew's, for example. Hurricanes with IKE around 60 are like Camille or Ike.
-
-
148FL/139SFMR, 912.7mb extrapolated during the last pass. Comparing to previous pass, it looks like it's down to around 914mb, which was the lowest for Irma.
-
It looks to me like a secondary eyewall is there. It will take some time to constrict the inner eyewall
-
2
-
-
28 minutes ago, Drz1111 said:
Kingston actually reasonably protected from hits from the west by the blue mountains, which tends both to weaken approaching storms and deflect them (remember Ivan), and though elevations lower, has plenty of land to the east for late-season west carib cyclones. It's vulnerable to a hit straight from the south, but that's an unusual track likely requiring a very late season storm. One day it'll take one, but the odds are pretty low in any given year.
San Juan is well-protected compared to say, Ponce, from the typical W-WNW CV track; it's most vulnerable to a storm deflecting WSW b/c of a super strong WAR. Again, possible, but relatively uncommon. Also helps that the water WNW from San Juan generally has a bit less TCHP than the water in the Caribbean or north of Hispanola.
I don't know, it seems pretty vulnerable...prone to surge, a very fragile airport location (in a barrier island)...and Blue Mountains did nothing during Gilbert...it even wobbled in the worst way possible towards Kingston. A place like Montego Bay looks much more protected. There have been plenty cyclones moving around Kingston in late season, coming from the SW, it's just that they have been relatively weak.
-
6 minutes ago, WishingForWarmWeather said:
And this is because it takes a dip under the island puts the in in the RFQ, as well as surge issues from that direction that it came in?
That's right. Obviously it also depends on the storm intensity and size...a larger, stronger storm from the south, would trump a smaller cane from the "ideal" direction. Drz1111 made a good point about cities being established on the protected side of an island/peninsula. Also, a good deal of coastal cities prone to cyclone hits were first built a bit inland and in higher terrain. There are exceptions, of course, and most exceptions are in the CONUS
-
1
-


Hurricane Maria
in Tropical Headquarters
Posted
2pm Advisory has it as a 100 kt Cat 3 hurricane.