
BarryStantonGBP
-
Posts
786 -
Joined
-
Last visited
Content Type
Profiles
Blogs
Forums
American Weather
Media Demo
Store
Gallery
Everything posted by BarryStantonGBP
-

2025 Atlantic Hurricane Season
BarryStantonGBP replied to BarryStantonGBP's topic in Tropical Headquarters
-
2025 Atlantic Hurricane Season
BarryStantonGBP replied to BarryStantonGBP's topic in Tropical Headquarters
LMAO at the cope. And LMAO at the warm neutral copers. Have you even checked out Gary Lezak's forecast Many models and mainstream forecasters have been busting hard -
2025 Atlantic Hurricane Season
BarryStantonGBP replied to BarryStantonGBP's topic in Tropical Headquarters
Models are busting hard, so I'm not even paying attention. -
2025 Atlantic Hurricane Season
BarryStantonGBP replied to BarryStantonGBP's topic in Tropical Headquarters
Too bearish -
2025 Atlantic Hurricane Season
BarryStantonGBP replied to BarryStantonGBP's topic in Tropical Headquarters
Lmao keep dreaming ive given up on mainstream forecasters and models and note the similarities in 2017 and 2025 -
2025 Atlantic Hurricane Season
BarryStantonGBP replied to BarryStantonGBP's topic in Tropical Headquarters
That’s why I’ve given up on mainstream forecasters -
2025 Atlantic Hurricane Season
BarryStantonGBP replied to BarryStantonGBP's topic in Tropical Headquarters
Also ignore Joe Bastardi’s babbling on twitter. He’s jumping to conclusions and omitting important information by cropping off graphs he is not seeing the whole picture -
2025 Atlantic Hurricane Season
BarryStantonGBP replied to BarryStantonGBP's topic in Tropical Headquarters
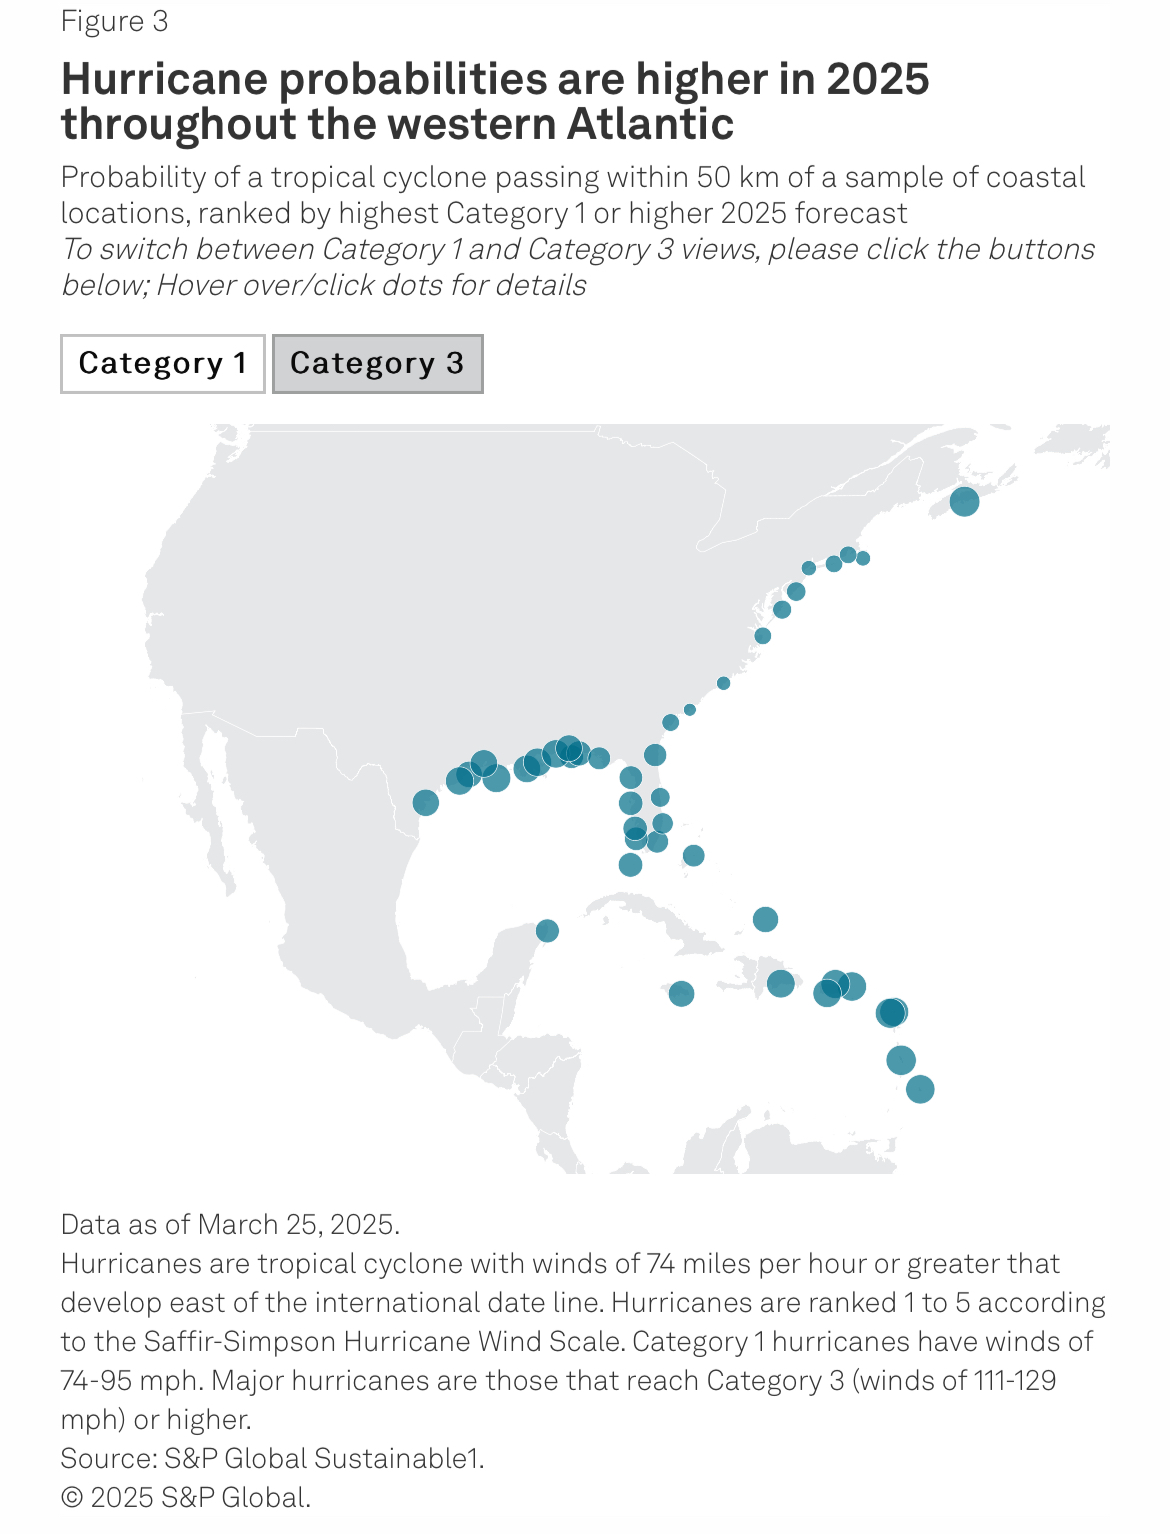
“But decreased landfall expectations!” ”My EURO! My models!” An Elevated 2025 Hurricane Season Forecast for the 2025 Hurricane Season and Retrospective Analysis of the 2024 Forecast Published: April 7, 2025 HIGHLIGHTS The S&P Global Climate Center of Excellence forecasts above-average hurricane activity in the North Atlantic, Caribbean, and the US and Mexican Gulf Coasts for the upcoming 2025 season. Our forecasts include the overall number of hurricanes as well as local probabilities of hurricanes passing nearby. Though lower than 2024, probabilities for impact by a major hurricane on large stretches of US and Caribbean coastlines are still forecast to be 50%-80% above their long-term average values. The driving climate factors in the forecast are El Niño/La Niña and sea surface temperatures in the subtropical North Atlantic. El Niño/La Niña is currently forecast to be close to neutral from July to September, compared to the La Niña state in 2024, while North Atlantic temperatures are forecast to be significantly elevated, though not as high as 2024. In this report we provide details of the forecast, including occurrence probability maps. We also present a retrospective analysis of our forecast for the 2024 season. The 2024 forecast was largely successful, confirming the model’s forecast skill. Authors Timothy Hall | Senior Scientist, S&P Global Climate Center of Excellence Hurricanes: What’s at stake and who could be impacted Powerful tropical cyclones — known as hurricanes in the North Atlantic and typhoons in the Pacific — are among the most deadly and destructive natural disasters on the planet. Understanding them can help protect lives, homes and businesses. The Atlantic hurricane season runs from June through the end of November, and for 2025, the seasonal hurricane model from the S&P Global Climate Center of Excellence forecasts eight hurricanes, with four of them reaching major hurricane status. Hurricane intensity is labeled on a range from Category 1 on the low end up to Category 5 on the Saffir-Simpson Hurricane Wind Scale, and major hurricanes are defined as Category 3 and above. The hazard forecast that follows is relevant for many stakeholders, from residents and municipalities to property owners, businesses, and energy production facilities along the US Gulf Coast, US East Coast, Gulf of Mexico and Caribbean Islands. The information is also relevant to insurers and investors with portfolios located in these regions. We forecast that these stakeholders will have elevated risk to property and infrastructure damage and financial loss in 2025 compared to long-term averages. To put some additional context around what’s at stake here: the National Oceanic and Atmospheric Administration Office (NOAA) has tallied 403 weather and climate disasters since 1980 that each resulted in costs of $1 billion or more, with a total cumulative cost of more than $2.9 trillion. Of all those $1 billion-plus weather disasters, tropical cyclones/hurricanes caused the most damage, at over $1.5 trillion total with an average cost of $23 billion per event. Hurricanes also caused the most deaths — more than 7,200 since 1980. Looking ahead: What we’re forecasting for 2025 In most regions of US and Caribbean coastlines, we forecast hurricane occurrence probabilities (passage of a hurricane within 50 km) to be substantially higher than their long-term (1948-2022) mean values. Many sections of US and Caribbean coastline have probability of a hurricane impact (Category 1 and up) approximately 30%-50% higher than the long-term mean (1948-2022), and major hurricane impact (Category 3 and up) 50%-80% higher than the long-term mean. For example, the forecast hurricane impact probability on Corpus Christi, Texas, is 0.078, compared to the 1948-2022 mean of 0.053, an increase of 47%, and major hurricane impact of 0.034 compared to the 1948-2022 mean of 0.019, an increase of 79%. These increased probabilities can be seen in Figures 1 and 2, which show 2025 forecast and 1948-2022 mean maps of impact probability for all hurricanes (Figure 1) and major hurricanes (Figure 2). We show best-estimate probabilities on a mapped sample of coastal locations in Figure 3. Large uncertainty is an inherent feature of seasonal forecasting, and location data available in Figure 3 also lists our lower and upper estimates from our ranges of uncertainty. (There’s a 5% chance the true value falls below the lower estimate or above the upper estimate.) For most locations, however, even the lower estimate forecast sits near or above the 1948-2022 mean, providing confidence in the overall forecast of an above-average 2025 season. Figure 3: Hover over each location to view the probability of hurricane passage within 50 km of a sample of coastal locations. Probabilities are provided for the long-term average (1948-2022) and 2025 forecasts for Category 1 and higher and Category 3 and higher hurricanes. For the forecasts, uncertainty ranges are also provided at the 5% and 95% confidence level; that is, there’s a 5% chance the true value falls below the lower estimate (5%) or above the upper estimate (95%). The total number of hurricanes and major hurricanes that form in the season is also forecast to be elevated, though not as elevated as the local impact probabilities. The best-estimate forecast is 8.1 hurricanes (4 to 13, 5%-95% uncertainty) and 3.5 major hurricanes (1 to 7, 5%-95% uncertainty), compared to 1948-2022 mean values of 6.6 and 2.6. The uncertainty distribution is wide, and the distribution overlaps the 1948-2022 means. The smaller increase in total storm count compared to local probabilities highlights the importance of forecasting local impacts, not just Atlantic-wide formation rates. A small fractional increase in overall formation rate can lead to a larger increase in local probability. If a tropical cyclone reaches hurricane or major hurricane status even briefly during its life cycle, it counts as a storm formed at that intensity level. But by itself, the overall formation says nothing about how long the tropical cyclone remained at that intensity. Our model also predicts how long tropical cyclones remain intense. The combination of more hurricanes and major hurricanes and longer duration at those intensities increases the odds of a locality being impacted beyond merely the overall formation rate. In addition, the model predicts seasonal changes in average paths of tropical cyclones, which can have a further impact on local probabilities. The factors driving our hurricane forecasts are forecasts of the state of El Niño/La Niña, an irregularly varying signal in sea surface temperatures (SSTs) in the tropical Pacific, and SST in the subtropical North Atlantic. We make use of SST forecasts from the European Centre for Medium-Range Weather Forecasts (ECMWF), which has one of the best track records. As of early March, ECMWF forecast El Niño/La Niña states near neutral for June-July-August (the bulk of the hurricane season), but SST in the subtropical Atlantic significantly elevated above long-term averages. El Niño suppresses Atlantic hurricane activity, while La Niña enhances it, so a near-neutral forecast has little impact. Meanwhile, warm subtropical Atlantic SSTs drive active hurricane seasons. Taken together, the El Niño/La Niña and Atlantic SST inputs, when run through our model, result in elevated hurricane activity. Looking back: Analysis of our 2024 forecast Our successful forecast of the 2024 hurricane season lends credibility to the 2025 forecast. In March 2024 we forecast an upcoming season of highly elevated activity, driven by forecasts for a strong La Niña phase of El Niño/La Niña (Atlantic hurricanes tend to be more active during the La Niña phase) and extremely warm SSTs in the subtropical North Atlantic. While the 2024 La Niña was not as pronounced as ECMWF forecast, an extremely warm North Atlantic did occur, and the hurricane season was one of the most active on record. In March 2024, we forecast a 2024 formation rate of 14 hurricanes, with eight of them reaching major hurricanes status. The season actually experienced 11 hurricanes, including five classified as major. How good is this agreement? Seasonal forecasts are probabilistic in nature. That is, the best we can do is forecast a range of results. As seen in Figure 4, the 2024 forecast range is far more consistent with the actual numbers that occurred than is the long-term average distribution. In other words, the forecast performed better than just using historical average rates. Figure 5: Forecast impact probability maps for the 2024 season made in March 2024. Hurricanes of all intensities (Category 1 or higher) are shown on the left, while major hurricanes (Category 3 or higher) are shown right. Also shown (black dots) are observed locations of tropical cyclones when they were at hurricane and major hurricane intensity. The inset values are the Brier Skill Score (BSS) measures of the forecast performance, with positive values indicating skill. Looking beyond Atlantic-wide rates, we can also assess the performance of our forecast on a regional level. Figure 5 shows the forecast probability maps, and the observed hurricane tracks for all hurricanes and major hurricanes. Seasonal forecasts are inherently probabilistic — the maps display the probability of occurrence, not a deterministic forecast for a particular event at a particular time — and assessing the performance of the forecast requires the use of a probabilistic skill score diagnostic. In assessing the skill of such a forecast, one asks if the forecast assigned higher probability to what ultimately occurred than did long-term climatological average maps. A common probabilistic forecast diagnostic is the Brier Skill Score (BSS). The differences between the forecast probabilities and the ultimate occurrences (yes or no, 1 or 0) are summed up over the region shown in the maps. This sum is then repeated using the long-term (1948-2022) climatological probabilities instead of the forecast, and the two sums are compared. The BSS is designed so that BSS=1 is a perfect deterministic forecast (forecast probability of 1 where events occurred and 0 where they didn’t); BSS=0 indicates a forecast no better than long-term climatology, that is, no skill; and BSS<0 indicates a misleading forecast worse than climatology. A perfect BSS=1 is impossible to achieve, even for tomorrow’s weather forecast. But a useful forecast must have BSS>0. Our 2024 forecasts have BSS>0, indicating skill beyond climatology. For hurricanes of any intensity, the forecast’s BSS=0.12, and for major hurricanes BSS=0.07. As difficult and uncertain as seasonal forecasting is, this positive skill indicates that our forecast model has utility and lends credence to our 2025 forecast. The Atlantic is poised for another busy hurricane season in 2025. While not forecast to be as active as the 2024 season, nonetheless the probability of North American and Caribbean coastal regions being impacted will be significantly higher than the long-term average. Populations, businesses, and investors in these regions should pay close attention to hurricane forecasts and alerts as the season evolves.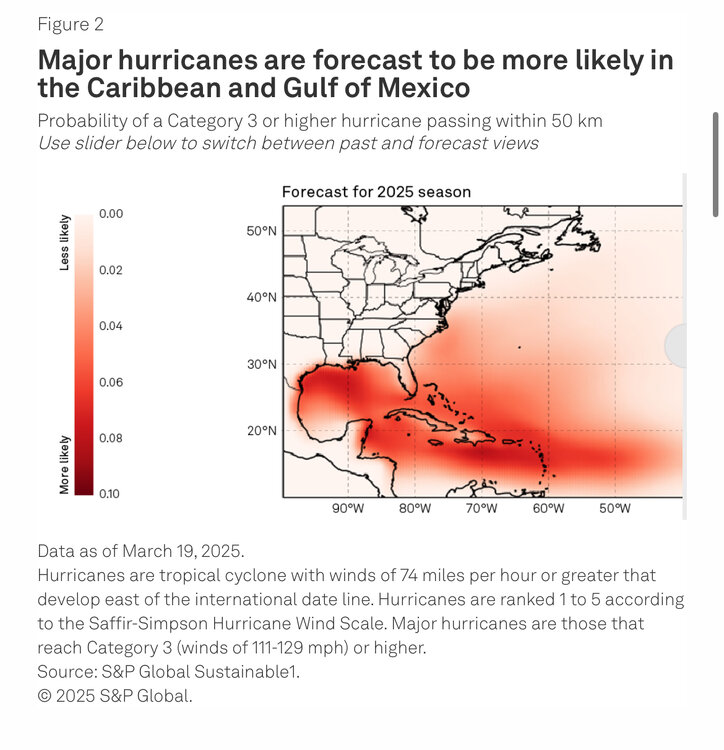

-
2025 Atlantic Hurricane Season
BarryStantonGBP replied to BarryStantonGBP's topic in Tropical Headquarters
“But increased trades” LMAO -
2025 Atlantic Hurricane Season
BarryStantonGBP replied to BarryStantonGBP's topic in Tropical Headquarters
You’re welcome im mostly ignoring any howling for “below normal or normal” seasons because they’re only focusing on “but the MDR IS COLD” they have been hyper fixating on Eastern Africa and yes it will reheat in the coming weeks as trades lessen. I don’t know why they’re jumping to conclusions plus models can be incorrect sometimes if you remember 2018-19 and of course 2022 I have just checked the Caribbean and gulf ssts still above normal even the ohc so I don’t know why they’re jumping to conclusions plus I look at the LRC and more for landfall risks I am looking at an above average season despite howling yourself? -
2025 Atlantic Hurricane Season
BarryStantonGBP replied to BarryStantonGBP's topic in Tropical Headquarters
“From today's trip to the weather twitters. Deep tropic suppression because of warm sub-tropics would seem, to me, to decrease risk of a major landfall in the Caribbean and Central/North America.” LMAO no whoever said this keep getting your hopes up -
2025 Atlantic Hurricane Season
BarryStantonGBP replied to BarryStantonGBP's topic in Tropical Headquarters
Lmao not only the east Atlantic matters. Stop jumping to conclusions it will be above average at least -
2025 Atlantic Hurricane Season
BarryStantonGBP replied to BarryStantonGBP's topic in Tropical Headquarters
It will warm up soon btw “it will be below average/average!” -
2025 Atlantic Hurricane Season
BarryStantonGBP replied to BarryStantonGBP's topic in Tropical Headquarters
but cold sstas https://www.tropicaltidbits.com/analysis/models/cansips/2025040100/cansips_ssta_noice_atl_6.png -
2025 Atlantic Hurricane Season
BarryStantonGBP replied to BarryStantonGBP's topic in Tropical Headquarters
8 hurricanes, 4 majors expected, and a landfall-heavy year Agreed more with these lot than most of the mainstream https://www.spglobal.com/esg/insights/featured/special-editorial/an-elevated-2025-hurricane-season -
2025 Atlantic Hurricane Season
BarryStantonGBP replied to BarryStantonGBP's topic in Tropical Headquarters
*which WILL warm up soon -
2025 Atlantic Hurricane Season
BarryStantonGBP replied to BarryStantonGBP's topic in Tropical Headquarters
Gary Lezak > jb -
2025 Atlantic Hurricane Season
BarryStantonGBP replied to BarryStantonGBP's topic in Tropical Headquarters
Not bullish im trusting Lezak more than the mainstream and he was more right about 2024 months before the season began, no revisions, more than the mainstream -
2025 Atlantic Hurricane Season
BarryStantonGBP replied to BarryStantonGBP's topic in Tropical Headquarters
-
2025 Atlantic Hurricane Season
BarryStantonGBP replied to BarryStantonGBP's topic in Tropical Headquarters
I am mostly relying on the LRC and Lezak forecasts -
2025 Atlantic Hurricane Season
BarryStantonGBP replied to BarryStantonGBP's topic in Tropical Headquarters
-
2025 Atlantic Hurricane Season
BarryStantonGBP replied to BarryStantonGBP's topic in Tropical Headquarters
yes (cool neutral) -
2025 Atlantic Hurricane Season
BarryStantonGBP replied to BarryStantonGBP's topic in Tropical Headquarters
Do you think they didn’t want to lose funding hence the over inflated storm numbers -
2025 Atlantic Hurricane Season
BarryStantonGBP replied to BarryStantonGBP's topic in Tropical Headquarters
He’s calling for 20-12-5 / 180 this year my forecast has somewhat similar numbers. 19-11-6 or something like that speaking of last year, here is what Lezak predicted versus the mainstream, which is why I’m not really taking mainstream forecasters that seriously these days: Actual Outcome (2024 Atlantic Hurricane Season)• Named storms: 18• Hurricanes: 11• Major hurricanes: 52024 FORECAST RESULTS – Graded Clinically Source Forecast (NS/H/MH) Accuracy Grade Notes TSR (Dec) 20/9/4 Overpredicted NS, nailed MH B- Started strong, but jumped the gun Lezak (Mar) 14–19 / 7–10 / 4–5 EXCELLENT A Criminally underrated. Nearly perfect CSU (Apr) 23/11/5 Overpredicted NS B Good hurricane count MFM (Apr) 21/11/– Missed NS by 3 B Solid hurricane prediction, vague TSR (Apr) 23/11/5 Overpredicted NS B Clean on H & MH UA (Apr) 21/11/5 NS too high B Middle of the road MU (Apr) 26/11/5 NS +8 = fail D+ MH decent but otherwise bloated NCSU (Apr) 15–20 / 10–12 / 3–4 Solid all-around A- Only slight MH undercall UPenn (Apr) 27–39 / ?? / ?? LOL F Must’ve been high SMN (May) 20–23 / 9–11 / 4–5 Slight over, still fair B+ Rounded accuracy UKMO (May) 22/12/4 Over NS B- Mid pack NOAA (May) 17–25 / 8–13 / 4–7 Too wide but technically right C+ Cowardly range TSR (May) 24/12/6 NS +6 D Wrong type of aggressive CSU (Jun) 23/11/5 Same B Clean hit on H & MH UA (Jun) 23/10/5 Also solid B But too high NS again TSR (Jul) 26/13/6 Wild overprediction D- Absolutely NOT CSU (Jul) 25/12/6 Big miss on NS D+ MH okay TSR (Aug) 24/12/6 Same as July D Doubling down on wrong CSU (Aug) 23/12/6 At least H & MH matched B- But still too much juice NOAA (Aug) 17–24 / 8–13 / 4–7 Safe again C Politician forecast -
2025 Atlantic Hurricane Season
BarryStantonGBP replied to BarryStantonGBP's topic in Tropical Headquarters
Praise lord lezak