Moderately Unstable
-
Posts
324 -
Joined
-
Last visited
Content Type
Profiles
Blogs
Forums
American Weather
Media Demo
Store
Gallery
Everything posted by Moderately Unstable
-
It's a public forum, not a professional forecasting office. The point is to discuss things, learn, and make mistakes. Also, websites like this operate based on ad revenue. They're expensive, and need eyes and participants. There are plenty of private weather chats you can join on social media apps. If you want only expert guidance, there are many better sources. Bring people in, educate, correct, and comment.
-
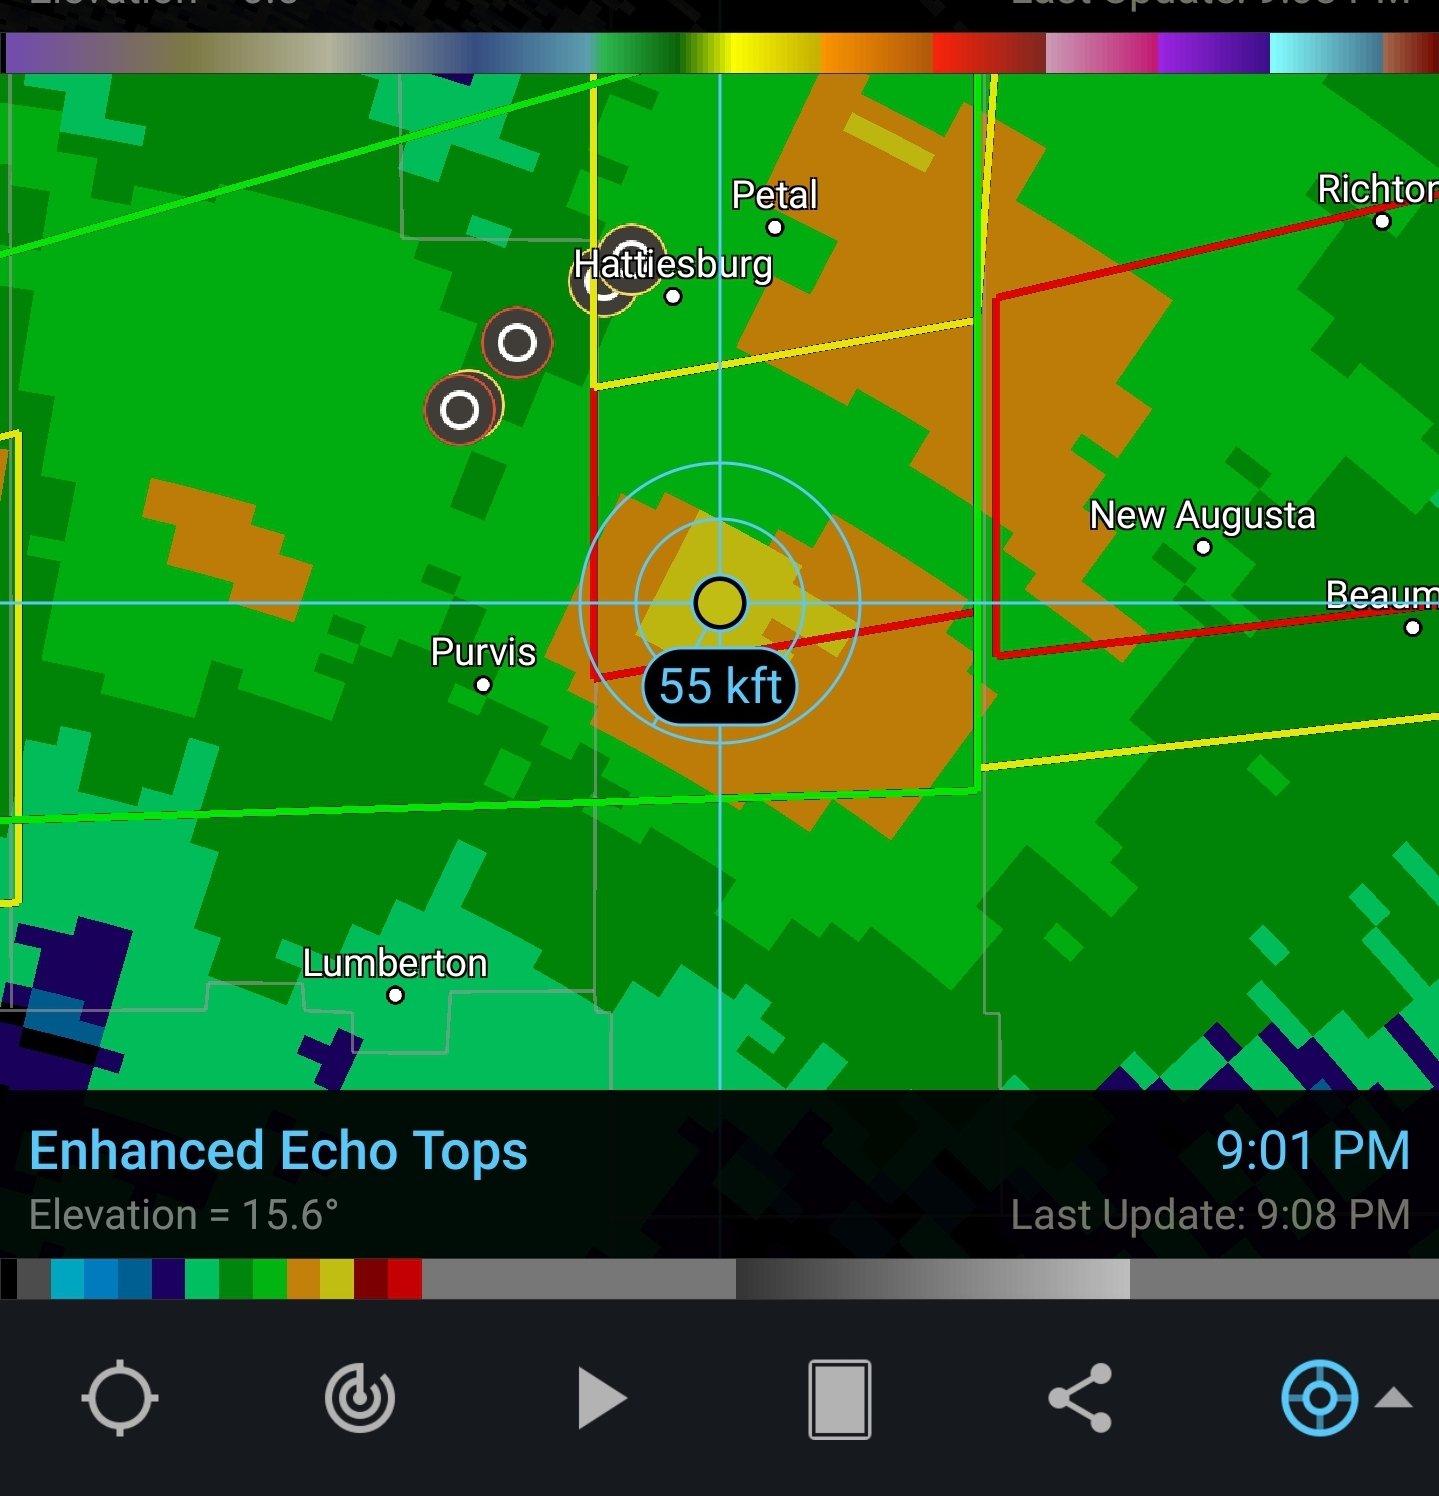
55k actually. It is entraining air from other storms and isn't staying discrete. As with most supercell structures, when a well defined structure like this crashes into another storm, it makes a mess. If it sorts that out, it has plenty of energy and space to produce. Couplet never really went away, but it is far from the radar. Beam height at the couplet is centered at 6.2k feet. Strong rotation, if it follows a typical sig tor tornadic supercell pattern, it will produce again. More a question of how strong, how long, and what does it do with the other cells in the area. That last one was pretty serious, and we will hear about problems from that one later. Does this go on to now put down an EF0, or does it keep it together and drop another 3? Outflow dominance has been the theme of the day.

-
If I had to guess, looking at the echo tops, these storms probably have stronger updrafts than last week. That would make some sense, we aren't lacking instability. Last weeks storms had more spin and low level shear, but updraft strength wasn't as strong (iirc). Also, what we define as "a lot" is subjective. I haven't seen a "lot" of anything today. A lot of crudvection, yes.
-
Welp, that couplet is going directly over Fort Polk. I don't remember what the 88ds are rated to withstand. I do recall the dome is several tons, they're doing upgrades on KDIX soon and read a notice a couple weeks back about a crane needed. Who needs a dow truck? Edit: ah I can still see the couplet se of the radar site. Wow that's close.
-
Not necessarily. What that reads to me as is, we don't think there will be many tornadoes, but the tornadoes that do occur, will likely be strong. That makes sense, given what has been discussed about storm mode above, and questionable sfc conditions, but concurrently, favorable overall dynamics and elongating hodographs. Fwiw, models do show things getting more favorable late afternoon early evening. This whole event, while thus far a snooze fest, has been excellent educationally. It's a complex forecast over a huge area with multiple storm modes, risk types, surface and elevated convection including storms transitioning from one to the other, upscale growth, areas of veering wind vs backing wind, etc. Sometimes in the plains forecasting is almost perfunctory on a gangbusters day. This setup is making everyone have to think, I know I am.
-
Can someone take a look at the storm near Lenox GA and tell me what they think? KVAX is showing a TVS but it is far from the radar site.
-
Ok, yeah that makes the most sense actually, especially if the trees recently leafed and some still have flowers etc. Thanks guys
-
I'm almost wondering if that isn't a tds actually, or, if it was, wasn't indicative of the size. Could it be straight line winds, some ground based phenomenon, flowering trees all blown up by a small spin up creating unusually strong returns.
-
Oof.
-
Jojo, I agree with you, though I lack a crystal ball, ef2+, this ain't/was not striking me as, right now. But there are a few reasons for weak-ish low level radar returns. It's been several years since I took meso and went a different direction since then, so, ya know, I'm rusty, but.. when you have a super classic hook like that, you can get a spin up or two. WSR88ds are great but not infallable. Just like model analysis, and idk why I'm telling you this since you know it better than me, you look at all the data. What's holding it back right now appears to be a lack of singular focus for low level rotation. I'm personally more interested in the development of a meso closer in on the flanking line, not the one that produced the spin up..if something sig were to occur. Environment is there. Again imma preface that by saying I probably don't know what I'm talking about. But I think it'll produce again, and I think nws does too bc they extended the warning.
-
It is confirmed on the ground now.
-
Classic hook on HGX. Can't upload image because file size is too big. Took its time didn't it? Looked like it was fizzling for awhile, interacted with another upshear storm, developed new low level rotational foci. Keep your eye on the CC panel.
-
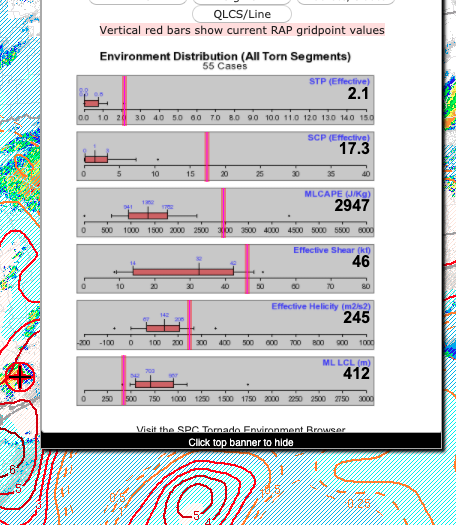
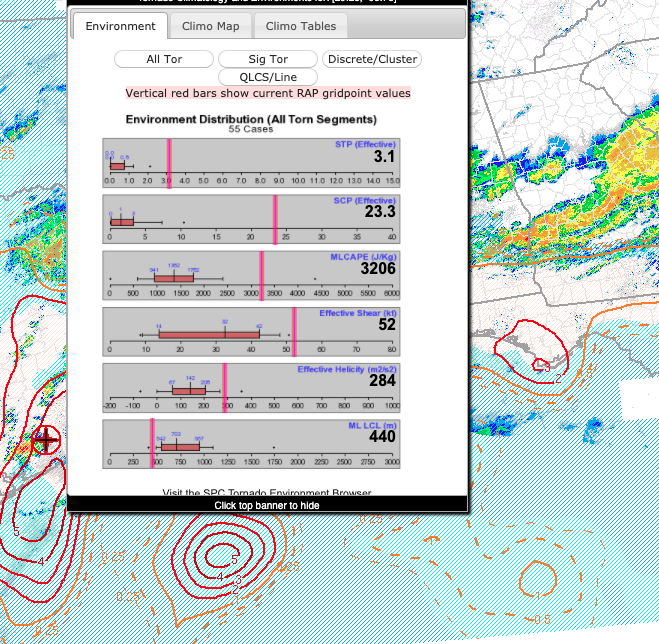
Storms SW of Houston do need to be watched. Mesoanalysis trends are favorable for further development, STP is high. Things are starting to light up at this point all over east TX and southern and western LA as diabatic heating increases amidst already high dew points and strong(er) deep-layer sheer. We're heading into the active part of the day--whatever that ends up meaning. I see I've been beaten to this as well by a bunch of folks but I was waiting to post until the two cells had finished merging to see what happened with that interaction before sounding a fool. Looks like a couplet is forming right now so any chaser in that area is probably seeing a developing wall cloud. Ignore the second attachment, the first one is the newer update.
-
It's not PDS due to the EF2+ odds. In watch 110 it was 95/90. Here it is 90/70 over similar areas. Difference between a "couple" intense tornadoes, and "several" intense tornadoes. Not saying whether or not that's right, just guessing why the issuing met didn't choose PDS language.
-
I mean it is clearly a high risk writeup with a moderate forecast cone. It's almost comical to read.
-
Mkay, think this is a sound call. Few thoughts--this isn't wishcasting. There isn't enough confidence here to issue high right now. They can absolutely go high in the AM if they need to. Broad area of SOME risk, different than concentrated area of HIGH risk. Once we see how things shape up in the AM, there will be a better handle on the setup. I'm going to play the reverse card: if tomorrow is a bust, would you rather it was a high risk or moderate? You can always up your warning language, hard to go down. For the public, this will have the same warning language and be communicated effectively, and that's what matters. There is 0 chance anyone who hears about this, in the public, will act differently, because the risk is moderate (aka 4) instead of high (5). They don't know what that means. This is for emergency managers. And they can get the last update in the AM. No one is going to die because a moderate was issued instead of a high. The same person will or will not die. I hope that the rumors I read that Birmingham doesn't want a high period bc this isn't as severe as last week's setup, period, no matter what, isn't true though. That similarly shouldn't have any bearing here. Statistics are statistics. Either your probability is high enough or it isn't. However I'm guessing bc it covers some of the same area, they advocated that lower risk shouldn't be articulated as higher risk. Sigh.
-
Quoting (they don't), bolding mine: NWSChat You are accessing a U.S. Government information system, which includes: 1) this computer, 2) this computer network, 3) all computers connected to this network, and 4) all devices and storage media attached to this network or to a computer on this network. You understand and consent to the following: you may access this information system for authorized use only; you have no reasonable expectation of privacy regarding any communication of data transiting or stored on this information system; at any time and for any lawful Government purpose, the Government may monitor, intercept, and search and seize any communication or data transiting or stored on this information system; and any communications or data transiting or stored on this information system may be disclosed or used for any lawful Government purpose. NWSChat is an Instant Messaging program utilized by NWS operational personnel to share critical warning decision expertise and other types of significant weather information essential to the NWS's mission of saving lives and property. This information is exchanged in real-time with the media and emergency response community, who in turn play a key role in communicating the NWS's hazardous weather messages to the public. NWS partners can use NWSChat as an efficient means of seeking clarifications and enhancements to the communication stream originating from the NWS during a fast-paced significant weather or hydrologic event. In order to participate in NWSChat, you must meet at least one of the following standards: NWSChat Live! Access NWSChat Live. Access Online Tools NWSChat Username (not handle) : @nwschat.weather.gov Password: Important Links Change NWSChat Password Request NWSChat Account - NWS Partners Request Account - NWS Personnel Documentation Office Contacts News and Notes NWSChat Server IP Change Posted on: 14 Sep 16:38 GMT Brief Google Maps Issue Posted on: 27 Mar 12:44 GMT Updated NWSChat Terms of use Posted on: 03 Dec 16:36 GMT 18 Nov Planned Outage Posted on: 18 Nov 15:59 GMT 3 September Outage #2 Posted on: 03 Sep 16:52 GMT Be a member of the emergency management (EM) community with a need to actively participate in discussions with NWS on imminent weather or other hazards: Members of the EM community include public safety officials who serve as employees or contract agents of a government agency at the federal, state, local, or tribal level and are charged with protecting the public from hazards that are influenced by weather or weather-related events. Other members of this community include: safety and emergency personnel, from universities or other large entities with large populations, whose roles are functionally equivalent to the public safety officials described above, and Skywarn Net Control Operators, such as Amateur Radio Emergency Services (ARES) and Radio Amateur Civil Emergency Services (RACES). Be a government partner of a NWS office: This includes Government partners who have missions that require close coordination with the NWS. Government partners include (but are not limited to) the FAA, and water and land management officials. Be a member of the electronic media: Members of the electronic media are parties, and contract agents of parties who: Have a need to actively participate in discussions with NWS Forecast Offices on imminent weather or other hazards, and Operate systems that routinely and rapidly relay weather and water watches, advisories, warnings and forecast information to a significant part of the population served by an NWS office; via electronic information distribution such as radio, television, internet, cellular, and other wireless means. Note: Individuals, companies, or other entities involved in ‘chasing’ weather events and posting or streaming text or pictures of the event, but do not otherwise have a need to communicate with NWS do not meet the qualifications for this Service, regardless of the number of ‘followers’ or recipients.
-
Messy forecast. Could go either way. High end potential is there. Easy to bust. Some may depend on what you define high risk to be. Technical definition of probability of a tornado within certain distance, vs. large potential area of strong tors, multiple rounds and foci, and two modes (isolated cells, QLCS's). Clearly, going to be an active day for the south. The corrected HREF probabilities are sort of telling--a conservative model showing a very high cumulative risk. Conditionals favor a moderate, at any given time, BUT, overall setup favors a high. The risk at any single point in time may not meet the 30% guideline, but it is possible that the cumulative 24 hour period WOULD justify it. However... bust potential also high. So, do they issue a high tonight, or stay moderate and change it in the AM, as was floated last week but ultimately never done? Beyond the nerd factor, high risks get carried pretty widely across the media. You don't want to play boy who cried wolf, we've seen high profile high risk busts. So before issuing a high, you want confidence that basically sounding your red alert alarm is warranted. People won't pay attention if you overwhelm them with too many warnings. I think, if you're the SPC, given the data, high risk is justified here. It was justified last week too. But it's hard to argue keeping a moderate until the AM. Edit: Re crying wolf. Here's the thing, this is a philosophy question. The reason you don't over-warn, is because you get warning fatigue. I live in Philly. People DO NOT change their behavior when even a tornado warning is issued. At ALL. "Oh my phone just said there's a tornado warning *proceeds to go outside to go run x errand*". I've seen this a lot. When everything is a severe thunderstorm, nothing is, until it's on top of you and, oops. The public is constantly being distracted with many different stimuli. As with a tornado emergency, you can warn a tornado that may kill people, and is large, with an emergency, or pds warning. Death, however, does not justify issuing an emergency, or a high risk. They are not related concepts. Many things are deadly, and they are not related to probabilities. You can absolutely say, this storm is dangerous and may kill you. That's quite different from a high risk of someone experiencing that in a given area. And that matters, because if 90% of your warning group sees nothing, they WILL NOT pay attention to the next one, which may NOT be so kind. Does not matter if 10% saw destruction, the 90% do not equate that to mean them. Similarly, tornado emergencies are best used when a big tornado is striking a large population center. A tornado warning, should be sufficient to tell people "take cover". Dixie alley is not a place to use your finite "pay attention to me" ammo, unless you really feel you need to. Otherwise, use a lower tier, and warn the heck out of that. In a nutshell: people dying is not sufficient for high risk (sad to say), and people will die tomorrow. Somewhere, in the south, a storm, in a 24 hour period, will kill someone. We don't know how many, or where. That's the truth. However, you risk more people dying in the future if you warn too strongly, and it doesn't pan out. Hence, this isn't just a forecast question. It's the trolley problem. Next Thursday remains another, uh oh, kind of possibility. Do not use your ammo, before you need to. Given who is writing the outlook, high risk is certainly likely.
-
Thanks, edited.
-
Short version, giant hodograph, high critical angle. Longer version...When you're looking for a strong tornado, you look for that big right turning hodograph. There's also a decent amount of academic literature now that discusses the link between critical angle and strong tornadoes. That's the angle between storm motion, and the low level shear. The closer to 90, the more likely you are to have an environment favorable for producing a strong tornado. Think about a boat, flowing down a river. That's the storm. Ok, now, imagine you tie a giant rope to that boat, and yank the back of it at a 90 degree angle. What happens? It spins. Or you fall into the river cause you thought you were stronger than a multi-ton boat in a current. Anywho, combined with a low LCL, large cape, AM cap, discrete cells...you have a problem on your hands. Hodographs let us plot wind speed and direction with height. It's an easy to read way to measure speed and directional shear together. When you combine those, we find that a large, right curving hodograph, signals that the *wind field* in an area is supportive of tornadoes. I feel compelled to add at this point...when we see a large, right curve, we're expecting a right-moving supercell. A "right mover", moves to the right of the mean flow. Hodographs are an easy way to determine this (and remember it). Large hodograph, in right quadrant, with right curve, equals right mover. Right movers tend to produce stronger and more frequent tornadoes due to some fancy dynamics. For tornadogenesis, we focus on the curvature of the hodograph in the first 2-3 km of the atmosphere. This is telling us about low-level shear. This is another area of tornadogenesis research that has become more clear in the last few years. It is part of why some supercells produce tornadoes, and others don't, and it is how the SPC can say now, x region will likely see supercells capable of "all hazards", where others will see a large hail threat. Basically, you start with a mid-level mesocyclone, and then that storm pulls in some additional rotational energy which enhances low level rotation. You can detect that on a hodograph through its low level curvature. You may also have noticed folks talking about the low "ground scraping" LCL's. That is, in essence, the cloud base. The closer that is to the ground, the easier it is for that strong low-level rotation to actually get to the ground. Skew-T's, and hodographs, tell us all of this information. At the end of the day, hodographs are one plotting method used to tell us what's *possible*. The reason we use hodographs to prog wind profiles in severe setups, is they allow us to *easily* and *quickly* identify how risky a particular setup is, for a certain area. Thus when you read something "looks bad", it's because that chart or graph, is designed to allow us to easily interpret what we're viewing and come up with solutions. We could just look at the wind barbs on a Skew-t, or winds on pressure surfaces, but hodographs give us a better snapshot of what's happening at different heights, when it comes to shear and spin. A tip for the future: don't overcomplicate chart analysis. When you forecast, you're considering many parameters. What's the starting setup? Do the models correctly capture this? Which capture it best? OK, what are the models that understand the situation to start with saying WILL happen in the future? How are they changing their forecasts with time? What do I know about the local area that could affect this setup? Do the models STRUGGLE with this setup, or area? What does this setup remind me of (or if you're me and have a bad memory, what does this remind a computer database of)? In all of that, you're going to look at many different charts, tables, plots, and figures. Trying to get down deep into the weeds of a single hodograph in a scenario like this, isn't something anyone has time to do (or I suppose...should have time to do). Same is true for a Skew-T. I see folks overcomplicate them all the time, and you can come up with plenty of interesting things from them, some of which are useful. At the end of the day though--for a skew-t, what I'm going to look at....: what's the temp profile, what's moisture look like, is there a lot of CAPE, ok, where's that concentrated (aka, what's the profile), is it surface based, what's the wind, any significant advection occurring, anything else jumping out at me? If it's particularly noteworthy, what are possible analogs of that setup? Ok, got it, NEXT. Thus, for a hodograph--long curvy rightward turning hodograph = bad. The bigger, and stronger the curve, in general = more bad. .
- 460 replies
-
- 19
-

-

-
Probability of hail after a few minutes of rain?
Moderately Unstable replied to KLM212's topic in Meteorology 101
Well, the short answer is, it doesn't always. For small hail, you can get rain-hail-rain. As you know, hail is produced when we have an updraft strong enough to lift rain droplets above the freezing level, which then condense into a hail embryo, which grows with time. If you picture a storm traveling along, the updraft is ahead of the storm, pulling in warm air. That's also the part of the storm that keeps hailstones aloft. Thus the densest objects, aka heaviest relative to surface area, will fall faster, after growing to sufficient size high up in the upper levels of the storm clouds. Smaller hail will fall next, relative to the direction of motion, as it gets more tied up in the overall wind structure of the storm. Rain follows last. Large hailstones are falling from beneath the tallest parts of the storm cloud--areas that have the highest updraft speed, right after the rain free base area. As they fall back into the lower levels of the storm, they're too heavy to be "mixed up" by the turbulence in the mid-level flow. The main cold downdraft region is behind this segment of the storm. Hence why you will often see large hail-small hail-rain. Now, this rule applies for supercells and other storms with very strong updrafts. But not for marginal hail cases. In other words, if you have, say, a storm producing pea sized hail, the dynamics will often have that small hail corridor within a surrounding area of heavy rain. You can see this easily using dual pol radar products. In this case, the storm is producing through one of a few mechanisms, a region of marginal hail, and that correlates with the greatest intensity of precipitation. E.g, maximum downdraft intensity = hail zone, for small hail. Having a relatively cold air mass with low freezing height coupled with a nice strong cold front is a great way to produce this type of hailstorm.