ORH_wxman
-
Posts
93,099 -
Joined
-
Last visited
2 Followers

About ORH_wxman

- Birthday 07/14/1981
-
NSIDC extent is actually at a record low for today’s date. But due to the factors explained above, it probably won’t sniff a new record this year.
-
See my response above to GaWx…not familiar with climate reanalyzer but it’s probably pretty accurate given that AMSR2 area is very low too. NSIDC area is quite low as well, just not as low as AMSR2 or climate reanalyzer. But we aren’t that interested in getting the most accurate area measurement right now for “seasonal minimum” record purposes. We’re more interested in what can give the most accurate forecast…which I outlined above in that response.
-
AMSR2 area is totally fine as an instant metric. It’s more accurate than NSIDC SSMI/S area….but the key is that SSMI/S area has much more predictive power than AMSR2 area. SSMI/S (what NSIDC uses) gets fooled by melt ponds whereas AMSR2 not nearly as much. But we actually like that SSMI/S gets fooled by melt ponds because melt ponds in June are more predictive of seasonal minimum area than AMSR2 area itself. So we’re basically using SSMI/S as a proxy tool for meltponding. This is why there are some years where we may be flirting with the lowest extent or area late in June and I’ll make a post that says a new seasonal record is almost impossible and many will ask why or in earlier times, call me crazy and a science denier. The reason is that meltponding isn’t prolific enough to sustain huge melting deeper into the summer. The second half of June was quite cold in the Beaufort/Chukchi region which has the highest sea ice area in the post-2007 arctic right now at this point (nearly tied with 2009). That is another bearish sign for a new record. That region is typically where we see huge losses in record or near-record low sea ice years. A lot of the low area numbers are currently being driven by record low sea ice in Hudson Bay, Greenland sea, and Baffin Bay. These are mostly irrelevant to the minimum later in the season. In fact, if you go just by arctic basin (Beaufort/Chukchi/East Siberian Sea/Laptev/Central arctic basin) plus CAA (Canadian Archipelago) composite area, the only post-2007 years that are higher than 2026 are 2009, 2013, and 2014. Those also happen to be the 3 highest minimums post-2007.
-
As of 6/29, 2026 sea ice area is 7.09 million sq km. This is currently 5th lowest: 2012: -380k 2010: -280k 2019: -170k 2024: -40k 2011: +2k 2020: +4k 2025: +10k Still another day or two before I run the numbers but a new record is nearly ruled out. Top 3 is definitely still on the table.
-
Area on 6/13….8.66 million sq km Heres how other years faired on the same date (I.e, 2012 had 420k less area than this year on the same date) 2012: -420k 2025: -130k 2019: -60k 2016: -50k 2007: +150k 2020: +190k 2011: +230k 2010: +240k 2023: +250k 2022: +280k 2021: +300k 2017: +310k Still a lot of time left in the critical month of June. We’re lagging 2012 decently but it’s definitely possible to catch up. On the flip side, if we continue to lose ground to 2012 over the next couple weeks, then we can rule out a new record this year. Most of the cake gets baked in May and June in the arctic sea ice workd
-
Winter 25-26 (All Snowfall Maps & Season Total)
ORH_wxman replied to The 4 Seasons's topic in New England
Upper outer cape will frequently do a little better than a place like MVY on a seasonal level. That extra latitude makes up for being out there. They usually get a few extra inches per season from OES too. The outer cape can get clipped on a NNW OES setup while everyone else misses. -
Winter 25-26 (All Snowfall Maps & Season Total)
ORH_wxman replied to The 4 Seasons's topic in New England
Good map....def a lot of weirdness to the snowfall distribution this season....that Feb blizzard def juiced SE MA/RI I had 68.5" so the 66.6 near me is pretty accurate....we might need to fire those two coops in SE ORH county. Are those Buffumville and Northbridge? -
I thought we'd get a legit threat in the second half of the month, but guidance really was kind of clueless on the pattern. Kept flip flopping. IT was actually kind of a disaster on model guidance really since we got to February....we had so many fake torches get canned on guidance during February and then the reload in March basically turned into this half baked semi-chilly pseudo-zonal pattern with flat/truncated ridges out west interrupted by deep troughs to mix in a cutter or two. .
-
Always love seeing BN heights in New Foundland and Labrador in late March and April with the ridge axis 800 miles west of us.
-
That's almost certainly what happened. In ORH, they were able to get some measurements from the airport for a while despite no official observer, but then that stopped eventually and they started using an observer near the airport. This process happened faster at BDL. You see so many instances of no report at BDL airport but then you get "East Granby" and I also remember a few times seeing them identical when they happened to put both in the report. It's like when BOS had the Winthrop coop doing the Logan measurements for a while...you'd see something like "0.6 W Winthrop" and Logan airport would have identical totals to the nearest tenth.
-
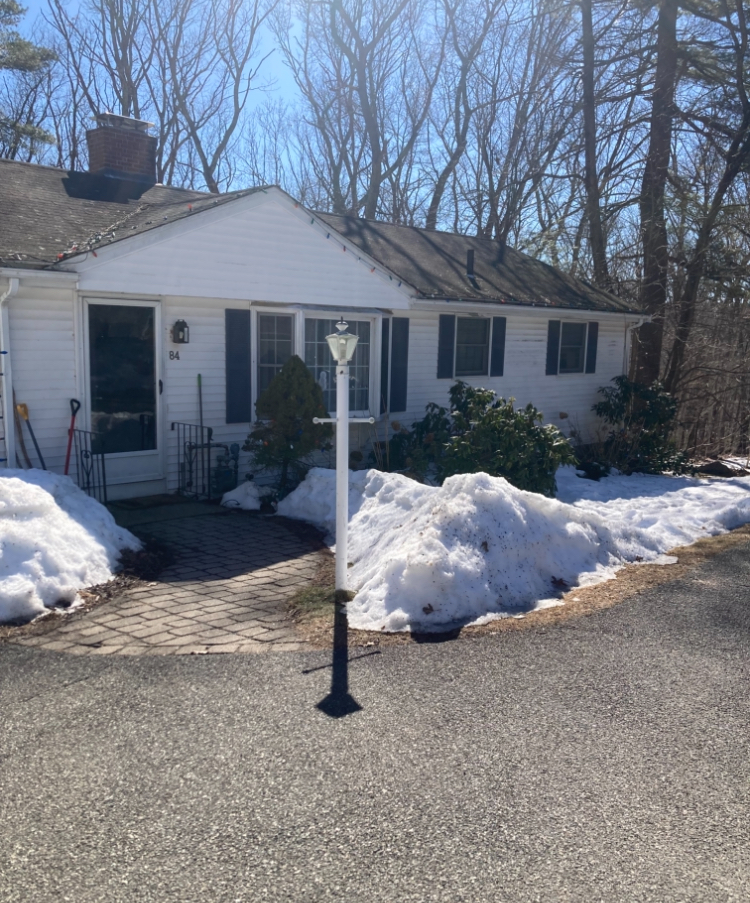
It could depend on your yard too this time of year. There’s a house at the bottom of our hill that has full pack right now on almost all sides except one. It’s deep too. At least 6-8”. Almost everyone else is bare ground with just piles. It’s tucked into the hillside just a bit so it prob catches all the cold dense drainage and maybe a little extra shade…but I think the former is the better explanation. Plenty of other shaded areas have less or just patches.
-
More water in the snow at Ray’s?
-
The old East Granby reports are definitely BDL. At least most of them are I’d think of not all of them. There wasn’t an active coop there either.
-
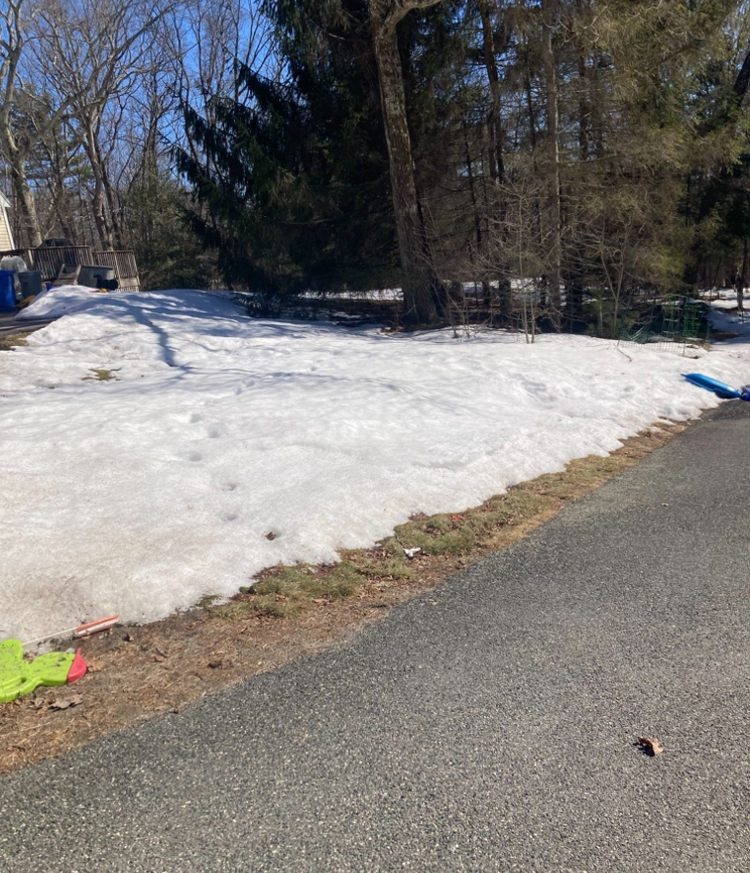
It’s so nice out….but it’s mostly useless this time of year since we still have snow pack or soggy ground where wet it just recently melted. You can’t do shit except walk in the street, lol. Oh well, back to dogshit tomorrow. Too bad next week couldn’t pan out. Cutter, cold, cutter, cold.
-
Edges retreating quickly.