

blizzard1024
-
Posts
1,078 -
Joined
Content Type
Profiles
Blogs
Forums
American Weather
Media Demo
Store
Gallery
Everything posted by blizzard1024
-
Global Warming Makes Weather In Boreal Summer More Persistent
blizzard1024 replied to bluewave's topic in Climate Change
Don't they have specific humidity? Plus this is a reanalysis dataset. It is nice to see another dataset and I thank you but where did you get this from? I would like to explore it. Thanks -
Global Warming Makes Weather In Boreal Summer More Persistent
blizzard1024 replied to bluewave's topic in Climate Change
The paper on increasing stratospheric water vapor is relevant to enhancing the Greenhouse effect. But what is odd, is that the stratosphere has been cooling mainly due to ozone loss and lack of volcanic eruptions,and CO2 increases as well. This increase in water vapor has to be from another mechanism and not a positive water vapor feedback. It is likely related to more tropical convection from increased El Ninos since 1977 from overshooting tops into the stratosphere. It also (I believe) is related to increased air travel through the decades. This increase in water vapor does enhance the Greenhouse effect but it likely is not related to CO2 increases directly. That is your opinion which you are entitled too. Here are two other peer review papers. https://www.researchgate.net/publication/226349531_Trends_in_middle-_and_upper-level_tropospheric_humidity_from_NCEP_reanalysis_data Paltridge et al. (2009) and https://judithcurry.com/2015/01/08/miskolczi-discussion-thread/ Miskolczi's paper What is your opinion of these papers? They are peer reviewed too. Also spencer and christy have published a lot too. Judith Curry as well. But if these don't conform they are dismissed and indeed I agree that especially Miskolczi may have some problems. Paltridge et al. (2009) is important in that it shows how much uncertainty there is in upper level tropospheric water vapor. You may not agree with NCEP reanalysis and NASA NVAP satellite data which show a drying upper troposphere and that is fine. I happen to think there is validity since they are independent datasets, but that is my opinion. My main question is where can we find a time series of upper tropospheric AIRs data? That showed a positive feedback trend with higher temperatures from Dessler's research a while ago. I want to see if it is ENSO related or not. It is difficult to find such a time series anywhere. Global cloud fraction is very important too. Both of these are critical to assessing the Greenhouse effect and feedbacks in real-time and it is shame that they aren't available. I want to see this data. If this data indeed shows an enhancement to the Greenhouse effect that is when a skeptic like myself will start agreeing more with you folks. Thank you. -
Global Warming Makes Weather In Boreal Summer More Persistent
blizzard1024 replied to bluewave's topic in Climate Change
People assume more water vapor through the atmospheric column leads to enhanced greenhouse effect. That is not true. The paper should have looked at upper tropospheric water vapor where it counts. I don't know why this is a very relevant paper. Warmer Earth, more evaporation off oceans = higher PWV. Not much new here. And please don't put me in the "denier" crowd. I don't deny that CO2 causes some warming. I just am skeptical of the extreme viewpoint called the climate "crisis". Thank you skier. -
Global Warming Makes Weather In Boreal Summer More Persistent
blizzard1024 replied to bluewave's topic in Climate Change
Now 400 mb would have more of an effect as shown here. BUT you can easily see the ENSO signature which suggests the moistening is more from El Ninos and less from overall warming. You can't separate out the two. El Ninos lead to more tropical convection which moistens and heats the upper troposphere. 400 mb is not quite upper troposphere but it would easily be heated and moistened by said convection. This is basic radiative transfer. -
Global Warming Makes Weather In Boreal Summer More Persistent
blizzard1024 replied to bluewave's topic in Climate Change
Please explain. It is well known that it is upper tropospheric water vapor that is the most important when it comes to the Greenhouse effect. Why do you think they criticize NCEPs specific humidity? It does show rises in the lower troposphere but declines in the very dry upper troposphere. There was a peer reviewed paper that looked at this very effect and found a constant greenhouse effect based on NCEPs dataset of water vapor showing declines in the upper troposphere. This paper has been ignored because scientists don't believe NCEPs dataset showing declining upper tropospheric water vapor. I know I am correct on this, it is the upper troposphere that counts for the greenhouse effect. CO2 does nothing in the lower and even mid-troposphere, it is the high levels where it counts. This is fundamental.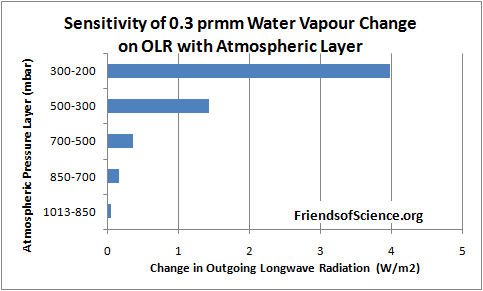
-
Global Warming Makes Weather In Boreal Summer More Persistent
blizzard1024 replied to bluewave's topic in Climate Change
Thank you for this paper. Here is the fundamental problem with their results. They are using global precipitable water vapor(PWV). Since water vapor rapidly decreases with height, this metric of water vapor is mostly what is happening in the lower troposphere. Since the oceans have been warming GPW has increased in all datasets (even NCEP). It is the upper troposphere that matters when it comes to the greenhouse effect. More greenhouse gases in the lower troposphere actually cool the layers above them. Similar to how the stratosphere cools above the troposphere with enhanced GHGs (assuming ozone is constant which it is not). So the upper troposphere is where it counts for both CO2 and H2O. These researchers do not seem to understand this. Here is a quote from the paper... "The increased greenhouse gases reduce the outgoing longwave radiation and contribute to the global warming phenomenon. Studies have shown that the global mean surface temperature has increased by 0.7–0.8°C since the beginning of the twentieth century [Hansen et al., 2001; Smith and Reynolds, 2005; Parker et al., 2007]. Atmospheric water vapor provides the single largest positive feedback on global warming [Dai, 2006; Mieruch et al., 2008; Zhang et al., 2013]. Both climate models and observations suggest that an upward trend in water vapor is expected to appear as a response to the surface temperature increase [Held and Soden, 2006; Santer et al., 2006; Zhang et al., 2013]. Monitoring the variation of atmospheric water vapor is thus significant not only for the detection of climate change but also for a better understanding of water vapor feedback on global warming." So they understand the role of water vapor as a feedback but use the wrong measurement. They use the whole troposphere. It needs to be upper troposphere. That is why you have to be careful about peer reviewed papers. These authors probably don't understand radiative transfer that well and the reviewers also. -
Global Warming Makes Weather In Boreal Summer More Persistent
blizzard1024 replied to bluewave's topic in Climate Change
Here are two papers related to AIRs moisture retrievals and ENSO that concerns me. https://agupubs.onlinelibrary.wiley.com/doi/full/10.1029/2008GL035333 So the premise is Dessler looked at global temperature and water vapor datasets from a warmer period DJF 2006-2007 El Nino and then subtracted a colder DJF 2007-2008 from a La Nina. The figure below does show warmer temperatures coincide with higher values of upper level water vapor, q. But mainly over the equatorial regions. There is drying north and south of the tropics is related to subsidence from enhanced tropical convection. Tropical convection does indeed increase during El Ninos vs La Ninas... see https://agupubs.onlinelibrary.wiley.com/doi/abs/10.1029/2019JD031026#:~:text=Convective organization has a large,scale circulations in the tropics.&text=The occurrence of organized deep,twofold outside of these regions. So with more tropical convection, it is the heat AND moisture fluxes associated with said enhanced tropical convection leading to this apparent positive feedback. You can't separate out the ENSO signal. To me, this clearly does not prove a long term positive feedback from warming. It is just tropical convection and heat/moisture fluxes upward.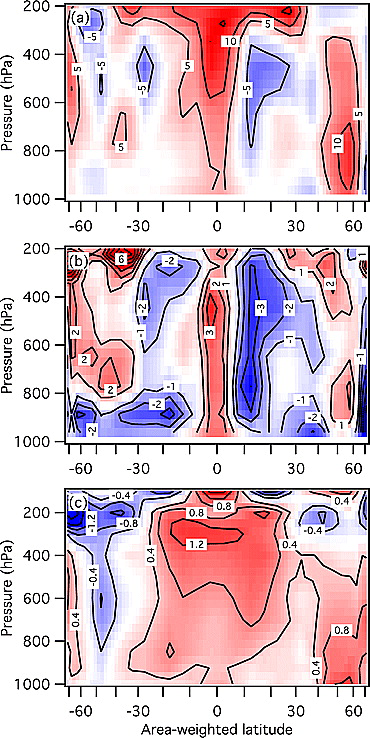
-
Global Warming Makes Weather In Boreal Summer More Persistent
blizzard1024 replied to bluewave's topic in Climate Change
I saw this. I am not saying that the Earth is not warming, it clearly is. So in a warming world, we would see extremes like this. The central question to me is how much is related to the enhanced greenhouse effect specifically from CO2 BUT also increases in upper level water vapor. I really would like to see real-time upper tropospheric water vapor data monthly like what you can get on the NCEP reanalysis. If you look at this monthly data, the greenhouse effect pretty much is stable since CO2 increases are offset by drying in the upper troposphere. This would suggest the warming is natural. HOWEVER, other datasets show upper tropospheric moistening and a positive feedback. Many don't agree with NCEPs data. That is fine. I would like to see the other dataset. In this way, we can monitor the greenhouse effect monthly. But this data is very hard to come by. I just can't find it. I also would like to see total cloud fraction of the Earth. NASA did this from 1983-2009. These two datasets on a monthly basis would be awesome to monitor the effect of clouds and the water vapor feedback. Until I can see this data, I am stuck with NASAs cloud data which showed an inverse relationship w/ global temperatures 1983-2009. And NASA NVAP water vapor data at high levels which was consistent with NCEP reanalysis data up until 2001. NASA never released this data to 2009 which is frustrating. AIRs satellite data apparently shows a positive feedback. Where is the upper level water vapor dataset in a time series. You can then tease out the ENSO signal to make sure it is not driven by ENSO. Soden's study in the 1990s showed a positive feedback after Pinatubo cooling. But when I examined the data in detail, his data started during an El Nino and ended in a La Nina which would affect the level of moisture in the upper troposphere. So it is hard IMO to separate the two out factors out. So if anyone can find a time series of AIRS data and also cloud fraction to recent years please share. Thank you. -
Phoenix Records its Hottest Summer on Record
blizzard1024 replied to donsutherland1's topic in Climate Change
I have read the abstracts and conclusions so far. I knew about the Norway papers from Oslo and of course I read the Lewis and Curry paper a while ago. These papers both are around 1.64 to 1.8K ECS. So most of these papers seem to converge on roughly 1.5 to 2.0K, again I read the Oslo one and Curry's before. And you state there are many more. OK, that is fine. But these folks don't get the splashy news headlines and hype. It is the researchers who promote their work to the media hype machine that get all the attention. These papers (except for the second and last one) don't really suggest much reason for alarm. Curry has been banished which is a big loss, the Oslo folks I saw years ago get crushed. I am not familiar with the other papers. I do thank you for your patience and providing these. The first paper uses the highly uncertain OHC and surface record back to preindustrial times which also is very uncertain as a metric. The second paper uses data from HadCRU, GISS and MSU TMT and this is probably why there is such a big range. GISS is an outlier in having too much warming. This paper doesn't really add much to the oft quoted 1.5 to 4.5K ECS for doubled CO2. It is just a little lower. Lewis and Curry talk about base periods in the 1800s, I can't remember what they used for temperature record since I don't have access right now to the full paper. But it has to be the very unreliable earlier datasets. The 4th paper uses HadCrut4 which again has a lot of uncertainties in the early predindustrial era. The last one constraints the ECS to above 1.5K but lowers the top more to 3.4K. They use CMIP models since 1975 a known global cool period. Natural processes were a part of the 1960s and 70s cool period and to assume all the warming since 1975 is from CO2 is erroneous. They also mention the uncertainties with aerosol forcing which I agree. There is a lot of uncertainties there. The biggest issues I see with all of this is 1) we really don't know what the global average temperature was in the late 1800s. 2) None of these papers account for natural processes that would affect the climate that are not understood, i.e clouds, convective overturning etc and 3) feedbacks and forcings can get messy in untangling see spencer and christy's work on this. The problem is extremely complex and to make policy decisions based on higher sensitivity or even 1.5K (the so-called danger mark) is nuts IMO. Plus we have warmed about .6C to .7C from both surface data and UAH since just before the El Chichon eruption in 1982. (RSS has too much warming compared to these datasets having .8 to .9C) Again the 1970s was globally a cool period so much of this warming could be related to interdecadal variability. To blame fires, heat waves, intensifying hurricanes, winter storms, arctic outbreaks, floods and individual weather events on climate change or a "climate crisis" right now on a small amount of warming is absurd and basically part of the ever worsening media-hype campaign. This hype is because the competition for news is extreme now with all the different sources. Climate change has become part of this hype and even weather forecasting too. The NHC is naming everything now and continues to overdo wind estimates of storms/hurricanes before landfall. I have seen this first hand. They want to get people to take action so they overdo the intensity of the storm as it approaches land to make sure people take the storm seriously and don't let their guard down. I have seen this on several occasions, but not all. So even weather forecasting has become part of this media-hype machine. This plays back into a university researcher trying to make a name for themselves or their institutions with research especially climate research. There is bias. I question everything that is my nature. If that offends people on this forum I apologize. But I do agree with all of you that we should stop polluting the atmosphere and environment (this includes pesticides herbicides too), help 3rd world countries have a decent quality of life and respect everyone no matter what your race, color, or creed is. If we can do this, it would solve many environmental problems and help calm down the insanity the world is going through right now. The media needs to STOP hyping everything and politicians need to start representing US. This utopian view unfortunately probably will never happen.... Thank you skier for a nice discord. Stay safe. -
Phoenix Records its Hottest Summer on Record
blizzard1024 replied to donsutherland1's topic in Climate Change
Please list them. I would like to read them. -
Phoenix Records its Hottest Summer on Record
blizzard1024 replied to donsutherland1's topic in Climate Change
I never said they are evil. It is a human bias. That's all my friend. -
Global Warming Makes Weather In Boreal Summer More Persistent
blizzard1024 replied to bluewave's topic in Climate Change
How did nature survive the last several glacial to interglacial cycles? They were far worse they anything we have seen the last 100 years or so. -
Phoenix Records its Hottest Summer on Record
blizzard1024 replied to donsutherland1's topic in Climate Change
Because the peer review process is corrupted. Scientists rely on the government for funding. If there are no serious problems, there is no funding. So climate scientists have to have a problem to get funding. The problem has to be more and more significant to keep getting funding. Since the climate is changing slowly and most Americans don't notice much change, they are trying to prove that weather events are now supercharged by CO2 and the media catches on and calls it a climate crisis and so on. Politicians now are worried and bingo more funding. Plus the folks that have all the power are of course biased to where the money is and referee the peer review process and won't let skeptical viewpoints publish. We saw that in the climategate emails and it continues more than a decade later. Follow the money, influence and power. Peer review doesn't mean much anymore. I have seen terrible papers get through when I was a reviewer. It depends on what the problem is. If it fits an agenda it gets published easier. This is just the truth and it unfortunately occurs outside climate science too. With blogs and open internet, peer review isn't what is was 20 years ago. -
Global Warming Makes Weather In Boreal Summer More Persistent
blizzard1024 replied to bluewave's topic in Climate Change
Thanks. It would be nice for this to transpire to a tasteful discourse. I will not attack anyone. Just because I don't agree doesn't mean a person should be discredited or called a name etc. Healthy debate is important to learn. I want to learn more and challenge people to really think. YES the climate is warming now. But how much really? How bad is it? What are ALL the causes. I may disagree with some or most of you but I will respect you as a person. But if attacked I will go to the moderators and if nothing happens I will defend my thoughts and not resort to name calling etc. Take care. -
Phoenix Records its Hottest Summer on Record
blizzard1024 replied to donsutherland1's topic in Climate Change
Sorry I don't agree. How can something else kick off a global warming event during the last glacial maximum, CO2 remains constant or even falls as it lags this initial forcing and then all of the sudden after several hundred years it becomes a positive feedback? That makes no sense. Obviously it is not the control knob of the climate if it doesn't kick off climate change. How can CO2 be still falling and global warming occurring and vice versa? Then after a lag it all of the sudden becomes a feedback? If that is the case, it is only a feedback to the warming we see today. Warmer oceans outgas CO2 and humans add some too. There is some effect from increasing CO2 but whatever kicked off the warming from the Little Ice Age to present is the dominant forcing. Since CO2 increases have a logarithmic effect radiatively CO2 should have more influence during ice ages and less so now as CO2 has rise to above 400 ppm. There is less warming for each additional ppm of CO2. So even if there is unnatural rises in CO2, the effects are diminishing on the climate system. All told 3.7 w/m2 of extra forcing for doubled CO2 vs OLR of 239 w/m2 is 1-2%. That is very little. There is SOME effect but it is not driving the climate. Climate models are flawed and do not account for natural processes well. They also assume the climate was in stasis in 1850 which it wasn't since we were warming out of the LIA. So climate models don't prove anything. -
Global Warming Makes Weather In Boreal Summer More Persistent
blizzard1024 replied to bluewave's topic in Climate Change
Sorry folks.I am baaackkkk! I was going to just leave this forum since it seems to be becoming a climate activist forum. I want to keep it a climate change forum so at least one skeptical viewpoint is needed. Climate models don't prove anything. Period. How can you say a model that is tuned to be sensitive to CO2 and assumes that the climate was in perfect balance in 1850 is proof that the warming we have seen recently is related to greenhouse gases. The climate system and natural forcings are so complex and unknown. To say that a small change in the greenhouse effect is causing the warming is presumptuous. I am not lying or trolling as implied by some person on this forum who I won't name because I don't want to attack anyone. I am sticking up for myself and my scientific opinion. That's all. The wildfires out west are related to a hot summer but it is mostly related to the poor fire management practices and humans causing the fires. Hurricanes are not strengthening because of global warming, the global ACE has been pretty steady. So all this political fallout from an active hurricane and fire season, likely related to La Nina, is very frustrating to see. The politicians fund the climate scientists. So it is in their best financial interest to tow the party line. The peer review process is corrupted by the fact that these same scientists now control what gets published and what doesn't. What dataset is considered good and what isn't. It is the corruption that Dwight D. Eisenhower warned about in his farewell address in 1961. We are living it today in climate science and because of this I believe we have put back climate science advancement at least a generation. It would be FAR better IMO to have climate scientists focus on seasonal forecasting and interannual variability. This would benefit society much more than global doomsday scenarios that will not ever come true. CO2 is a minor GHG. Period. End of story. It is not the control knob on our climate. The ice core data proves that. It is very unscientific to say that something else kicks off global cooling, CO2 remains the same for a thousand years or so while the Earth cools. Then it all of the sudden it becomes a feedback and amplifies the initial cooling? Then at glacial termination something else kicks it off and after a lag, THEN it again becomes a feedback? That is not physics. It's denial that something else controls the climate, not CO2. Certainly CO2 values do not cause heat waves or fires or hurricanes. Some warming of course will lead to a slower jet stream but it likely is natural processes combined with some CO2 forcing because CO2 is a small component of the climate system. -
Phoenix Records its Hottest Summer on Record
blizzard1024 replied to donsutherland1's topic in Climate Change
It's not CO2 entirely.CO2 always lags T in ice cores. It never drove the climate in the last 2.6 million years with the present ocean currents and geography. Why would it all of the sudden change? That's not physics. There is more to the climate system and we just don't understand enough about natural processes. But we shouldn't be polluting our atmosphere, so in the long run we need to go to renewables and cleaner energy sources. CO2 is a weak GHG. That is basic physics. The feedbacks can't be significantly positive or our climate would have gone off the rails a long time ago and it simply didn't. You need major positive feedbacks and high climate sensitivity. The observations are not showing this. If you pick warm biased data sources you get 2C per century or so. UAH is 1.4C per century. So split the difference... 1.5C to 2.0C increase over 1880 leads to another .5C to 1C for a doubling CO2 assuming the climate was in stasis in the 1800s. This is a BAD assumption since we were coming out of a global LIA. It is very possible that much of the 20th century warming is natural with some smaller CO2 component. Climate models are tuned to be sensitive to CO2 and have positive feedbacks which in nature likely doesn't exist. See Spencer's work on ERBE satellite data. Anyway, I am done. I don't buy your CAGW. It is hype. I see modest warming. I am finished here. You got your wish. No dissenters, no debate. No learning. Have a nice life. -
Phoenix Records its Hottest Summer on Record
blizzard1024 replied to donsutherland1's topic in Climate Change
By models. That is not proof. -
Phoenix Records its Hottest Summer on Record
blizzard1024 replied to donsutherland1's topic in Climate Change
Yeah this is what happens when the world warms. But it easily could be mostly natural too. You can't prove CO2 is the cause for the millionth time. -
Phoenix Records its Hottest Summer on Record
blizzard1024 replied to donsutherland1's topic in Climate Change
I am trying to get off this radical CAGW site. You are not a decent human being. I never lied. How dare you say I lied. That is offensive and you are attacking me and I won't leave it this way. I am going to stay on this forum until you are removed. You should be removed for personally attacking me. I will see to it. -
Phoenix Records its Hottest Summer on Record
blizzard1024 replied to donsutherland1's topic in Climate Change
This is my last post. You guys win. It is like talking to a brick wall. Skier you should be removed from this forum. period. The mods have done nothing and that is shameful. Keep living in your fantasy world. I know you think I live in one, but NO.... it is you guys. Mother Earth is just fine and modest warming will be beneficial. To think otherwise is just plain HYPE. -
Phoenix Records its Hottest Summer on Record
blizzard1024 replied to donsutherland1's topic in Climate Change
I have and don't agree with the methods. Others feel the same way. But of course they don't agree with the consensus so they are shunned. This is not science. This is shutting down the scientific process. people like you and others do this. Many of us folks who believe there is moderate warming not catastrophic warming are getting lumped in with the Alex Jones types, Trumpers etc. That is so wrong. -
Phoenix Records its Hottest Summer on Record
blizzard1024 replied to donsutherland1's topic in Climate Change
You are losing your mind my friend.... Its the highs and lows that matter. If they didn't do highs or lows prior to 1920 which I believe is true how can you stitch that together. -
Phoenix Records its Hottest Summer on Record
blizzard1024 replied to donsutherland1's topic in Climate Change
Its the highs and lows that matter. how can you stitch data together if they didn't do highs and lows before 1920? come on. that is vodoo statistics. -
Phoenix Records its Hottest Summer on Record
blizzard1024 replied to donsutherland1's topic in Climate Change
The IEM data source has unadjusted measured data which is the best. It should no warming AT ALL in my climate division. NONE. BUT NCEI reports 3F warming since 1893. It is MADE UP. It is NOT measured. How can you trust this MADE UP DATA. This is beyond silliness and common sense.
