

Dan76
-
Posts
2,487 -
Joined
-
Last visited
Content Type
Profiles
Blogs
Forums
American Weather
Media Demo
Store
Gallery
Posts posted by Dan76
-
-
''Nice'' is a subjective term.
-
 3
3
-
-
-
Lost it's mooring in the storm
-
1
-
-
1 hour ago, bluewave said:
Multiple stations hit 108° during a drier pattern in 2010 and 2011 which wasn’t nearly as dry as the spring of 2002 was. So we could easily beat that in this much warmer climate if we got into a summer drought with westerly winds. But since we have become so wet with more onshore flow, it hasn’t happened yet. All it took was a brief flash drought in October 2019 to set all time highs by several degrees for the month. Plus we had our first 80° during winter in 2018. So we have been lucky to an extent during the summer that the big highs have been elongated more east of New England instead of flatter into the Carolina’s or Tennessee Valley. When you look at what happened around the Pacific NW a few summers ago it shows how lucky we have been.
Just add 2-3° to the 2010-2011 maxes and you see potentially what a drought could do here in the summer.
Data for January 1, 2010 through December 31, 2011
Click column heading to sort ascending, click again to sort descending.StateNameStation TypeHighest Max TemperatureNJ NEWARK LIBERTY INTL AP WBAN 108 NY MINEOLA COOP 108 NJ CANOE BROOK COOP 107 NJ HARRISON COOP 107 NY WANTAGH CEDAR CREEK COOP 107
October 2019 and February 2018 records were 3-4°warmer than previous recordsTime Series Summary for NEWARK LIBERTY INTL AP, NJ - Month of Oct
Click column heading to sort ascending, click again to sort descending.RankYearHighest Max TemperatureMissing Count1 2019 96 0 2 1941 93 0 3 1949 92 0 4 1959 91 0 5 1939 90 0 - 1938 90 0
Time Series Summary for NEWARK LIBERTY INTL AP, NJ - Month of Feb
Click column heading to sort ascending, click again to sort descending.RankYearHighest Max TemperatureMissing Count1 2018 80 0 2 1949 76 0 3 2017 74 0 - 1997 74 0 - 1954 74 0 6 1985 73 0
Seattle surpassed previous summer record by 5° in the much warmer 2020s.Time Series Summary for Seattle Tacoma Area, WA (ThreadEx) - Jan through Dec
Click column heading to sort ascending, click again to sort descending.RankYearHighest Max TemperatureMissing Count1 2021 108 0 2 2009 103 0 3 1994 100 0 4 1991 99 0 - 1981 99 0 - 1960 99 0 5 2020 98 0 - 2007 98 0 - 1988 98 0 - 1979 98 0 - 1967 98 0 Just looking up the Mineloa coop they had 4 days in a row over 100 in 2010
-
1
-
-
5 minutes ago, psv88 said:
With a W/NW down sloping wind the coast is warmer than inland. Happens all the time…with a decent westerly the sea breeze isn’t a factor…in these setups JFK and LI go 100+.
i believe one of the barrier islands hit 108 on an offshore flow about 15 years ago. @bluewavecan confirm
When was the last time you cracked 100.
-
SW wind is off the ocean for Staten island east.
-
2 minutes ago, Ginx snewx said:
Saw that. Epic lighthouse wave pics by Eric if he can get there.
IOS 61kts
-
30 minutes ago, lee59 said:
Peak gust here only 35mph
FWIW Pretty windy
https://www.wunderground.com/dashboard/pws/KNYWANTA21
-
12 minutes ago, nycsnow said:
Anybody else notice the winds died down ?
Not as bad as before
-
1
-
-
1 hour ago, nycsnow said:
High wind watch up
Got are storm warning too.
-
47 minutes ago, Brian5671 said:
imagine sitting through that in sheet drizzle and 44 degrees
can't Imagine sitting through that in 80 degrees and full sun.
-
 1
1
-
-
WednesdaySleet likely before 8am, then snow and sleet. High near 29. Very windy, with an east wind 44 to 55 mph, with gusts as high as 65 mph. Chance of precipitation is 90%. New snow and sleet accumulation of 1 to 2 inches possible.Wednesday NightSnow, possibly mixed with sleet, becoming all snow after midnight. Low around 25. Strong and damaging winds, with an east wind 60 to 65 mph, with gusts as high as 80 mph. Chance of precipitation is 100%. New snow and sleet accumulation of 3 to 7 inches possible.
-
1 hour ago, nycwinter said:
i am looking forward to a possible soaker on tuesday...
We could use it.
-
2
-
-
1 hour ago, dendrite said:
Shorten the season and chop off all games pre 4/15. 162 games is ridiculous. Or at least go back to 154 and start a week in Napril.
No way $$$$$$$$$$$$$
-
1
-
-
Wonderful
-
I have pictures of 76-77 of ice around Meadowbrook bridge and state boat channel,but god knows where they are.
-
1
-
-
46 minutes ago, psv88 said:
Feeling good about the Mets this year?
Last year they were 92 1/2 this year around 82 1/2 so I guess not.
-
 1
1
-
-
Not much Rain
-
Wonder what Long Beach got.
-
1
-
-
Just now, LibertyBell said:
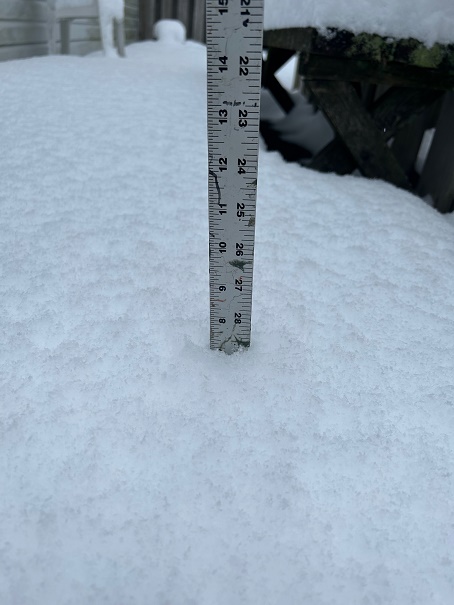
Thanks looks like we're close to 8 inches too, It's amazing when there is zero snow on the roads here lol
Yeah crazy but beautiful outside
-
1
-
-
29 minutes ago, LibertyBell said:
wow 6 inches really? I'm at the same latitude as they are, 5 miles to the east and nothing on the roads at any point during the storm but it looks really good on the trees, rooftops and driveway and sidewalks.
Same town as you
-
1
-
 1
1
-
-
49 minutes ago, snowman19 said:
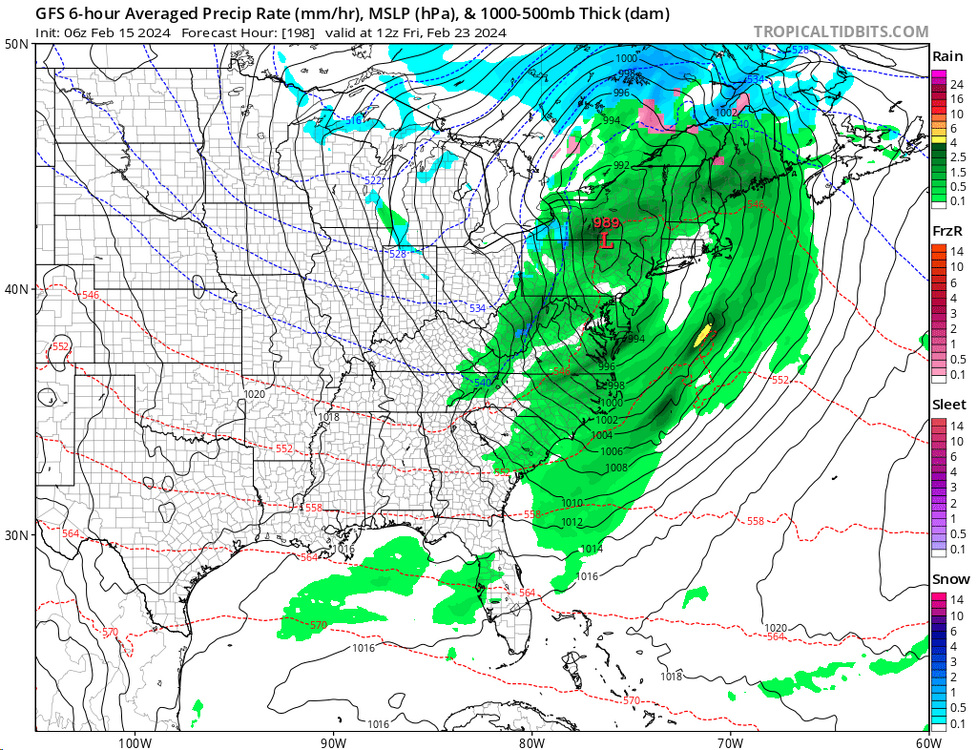
Next Fri/Sat looks awful. No cold going into it. No blocking. That has cutter/runner written all over it
Pretty much....
-
1
-
-
Just now, MJO812 said:
Melting going in
In here ?
-
1
-
-
Where's noSnowman19? In a drift?
-
1
-

April 2024
in New York City Metro
Posted
Pouring