
Mike Cycle
-
Posts
32 -
Joined
-
Last visited
Content Type
Profiles
Blogs
Forums
American Weather
Media Demo
Store
Gallery
Everything posted by Mike Cycle
-
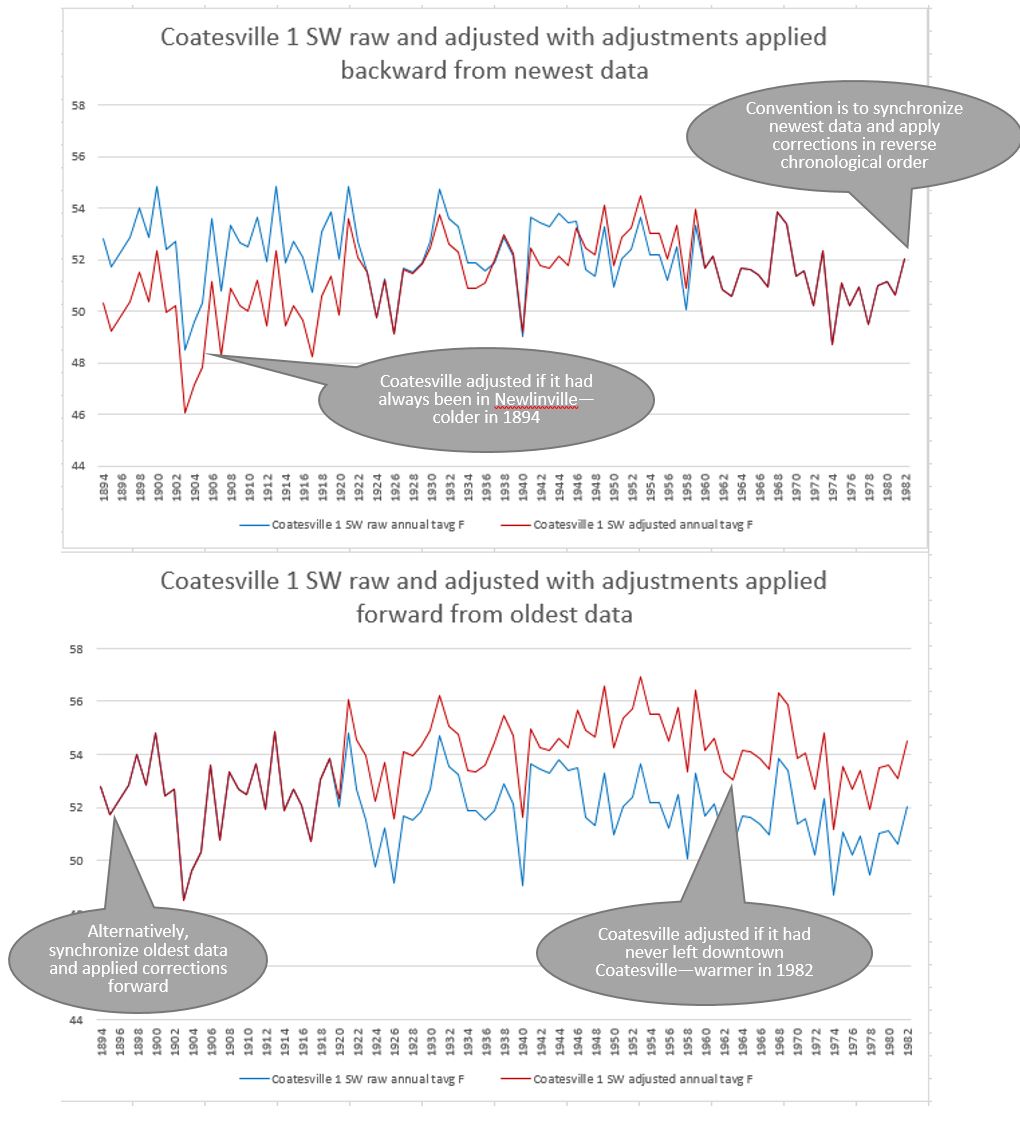
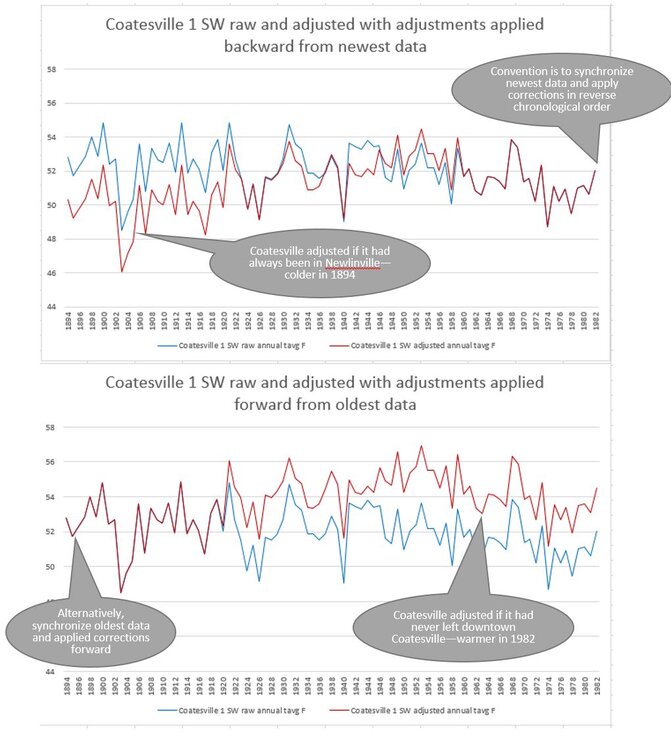
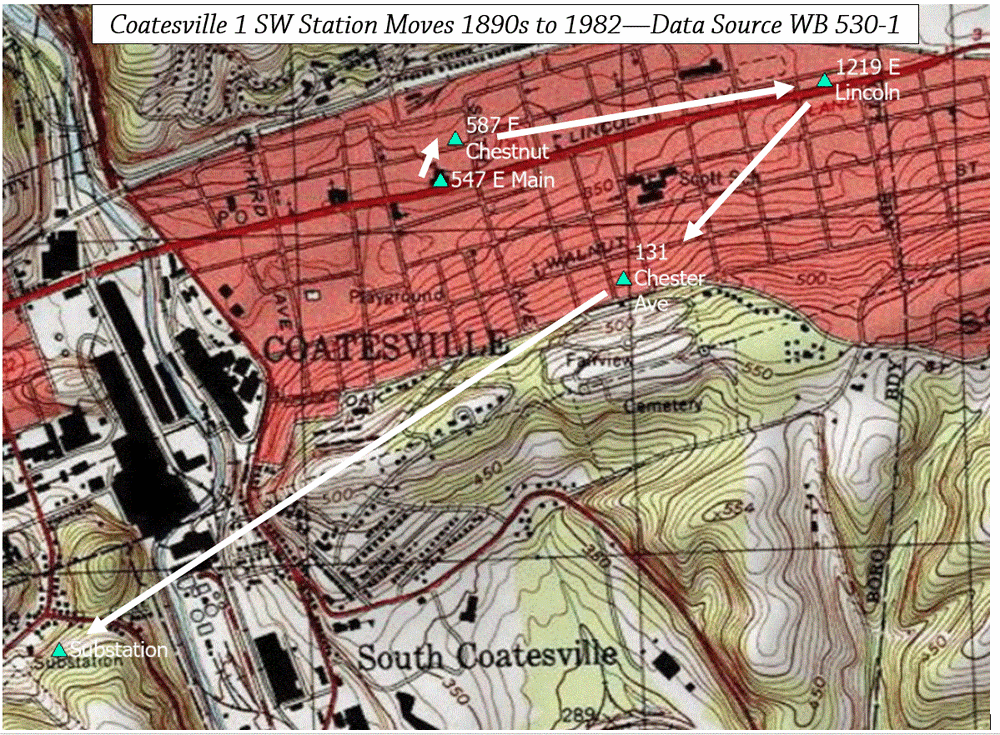
 Here is a graphic I hope illustrates that the goal of homogenization is not to create a new absolute temperature series for a given location, but to extract change over time information. With Coatesville 1 SW, because it moved to progressively cooler locations (break points finds these shifts), it is necessary to correct for those moves. Convention is to apply the corrections from most recent raw data backwards, but it is just as valid to apply them from oldest forward. Convention results in a repaired series that was always in its final location, and applying corrections from oldest forward results in a station that never left its first location.
-
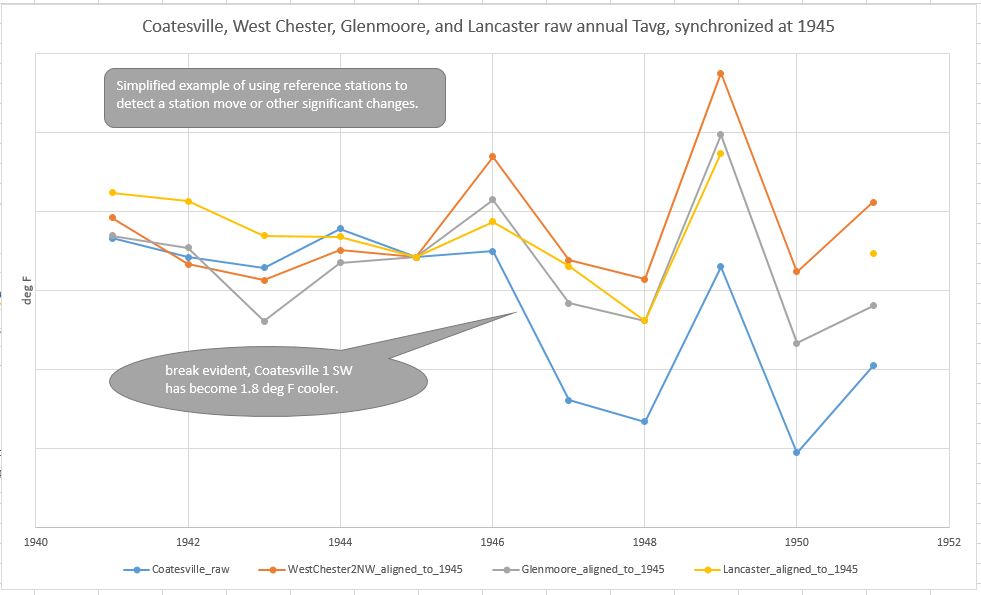
Chesco, you are quite welcome. Seems like an important step towards understanding the data adjustments done by NCEI and BEST, and the topic of this forum.. The next step is to look at how break points are identified using reference stations. Chubbs has a graph above showing the 1946 break resulting from 1 SW's move to Newlinville, and here is similar graph also using raw data. What I have done is synchronize the temperature series at 1945, and removed the absolute temperature values on the Y-axis--because the absolute values don't matter if we are looking for climate trends. This shows just the 1946 break, and shows the RESULT/IMPACT the station move made on Tavg. Now, imagine repeating this process with a large set of reference stations across the whole history of 1 SW to create a time line of breaks and the deg F size of the shift at each break. That is what is done. With the new information from the breaks, we can adjust the station data by reversing the IMPACT of the moves. With the repaired data set, we can then identify baselines and departures from those baselines--anomalies. Absolute values don't matter, the change over time does. Also, by convention the adjustments are made with the end of the raw data series aligned to the same temperature as the end of the adjusted data series. This may lead to confusion when the raw and the adjusted data are viewed in the same graph, because it looks like one series has been "chilled" or "warmed" with respect to the other. The reality is that the raw data for Coatesville is actually several distinct stations, and the adjusted data has been upgraded to be a lot closer to what the raw data would have looked like if the station never moved. Trying to assign absolute temperatures to either time series is not useful when the information we want is change over time. With that in mind, would you clarify what you mean by "there were no unusual temperature changes at Coatesville 1SW that were not statistically aligned with the nearby stations within 30 miles of that point" & "This supports the fact that there was no need for any adjustments to the raw data at all!"?
-
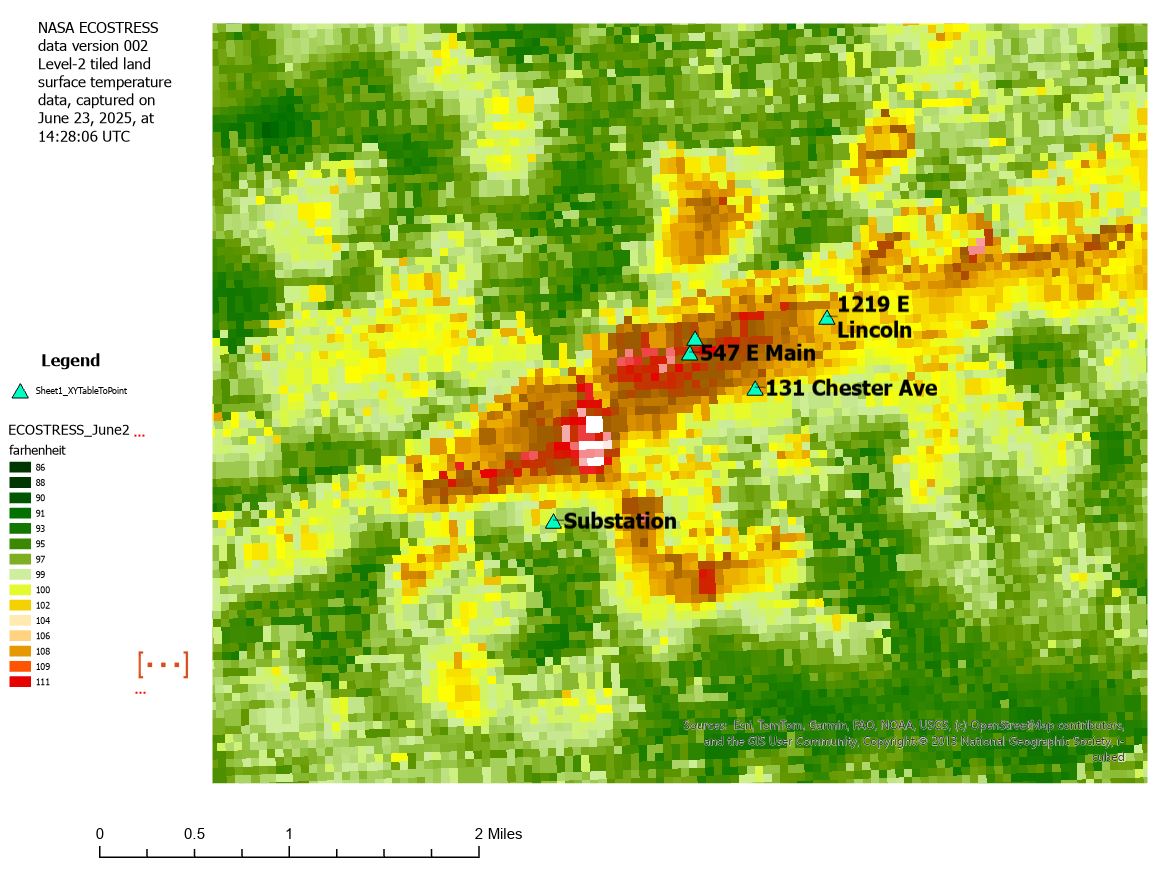
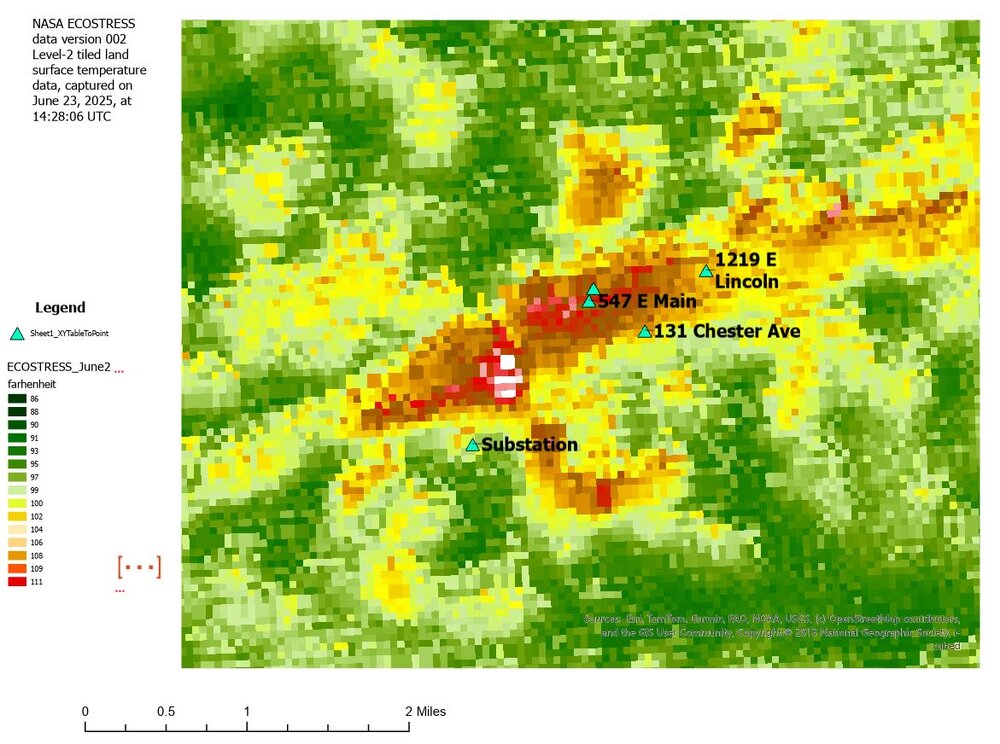
The 1946 station move looks like a train switching from one track to another. Nice. Here is a view of surface temperatures from NASA's ECOSTRESS instrument on the space station. Coatesville 1 SW generally moves progressively from hotter to colder microclimates.
-
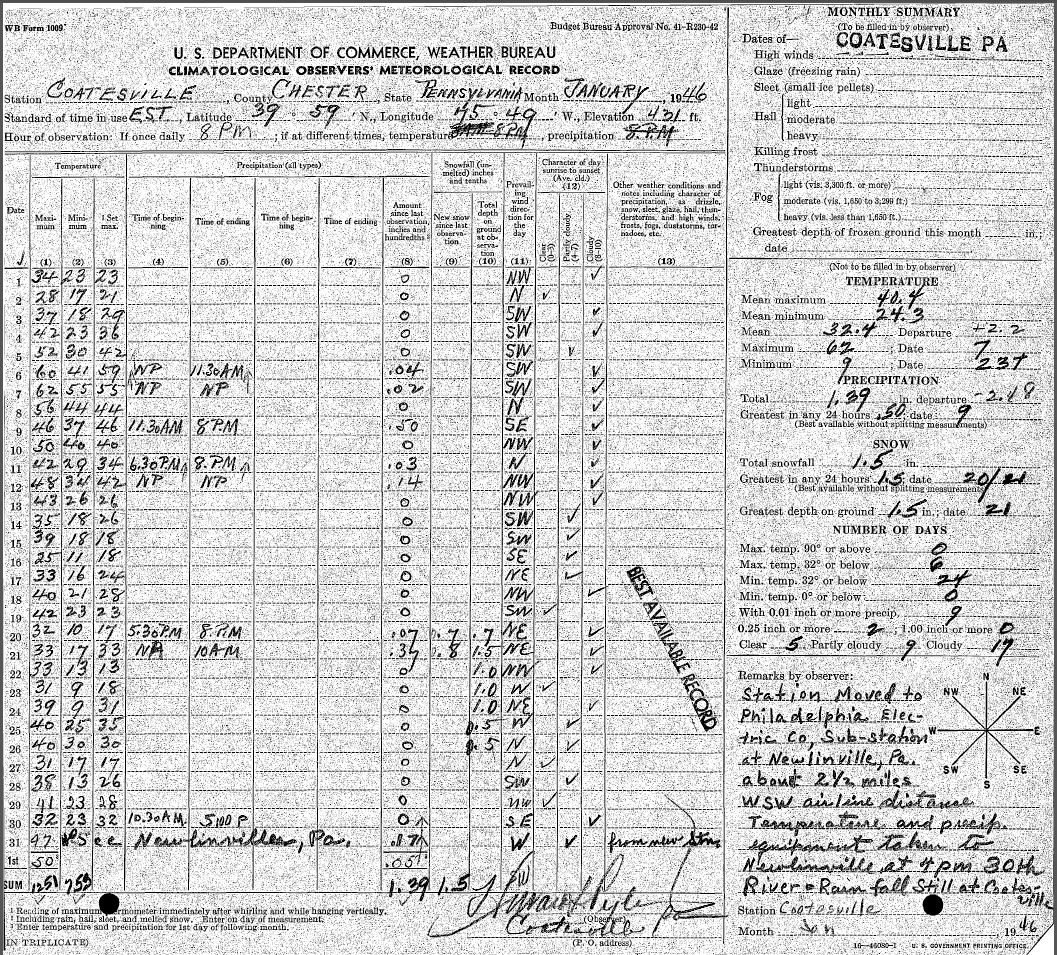
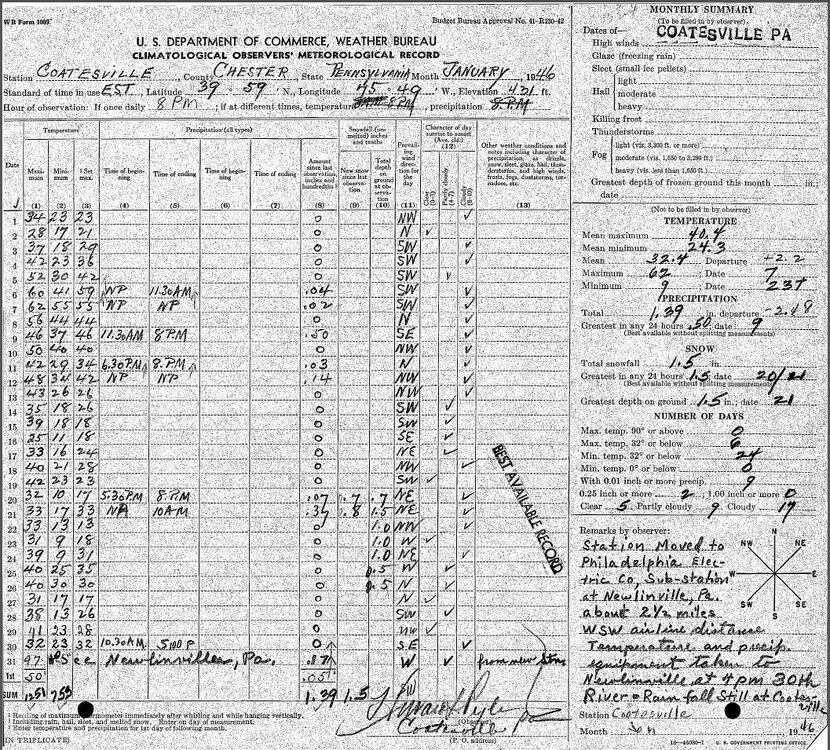
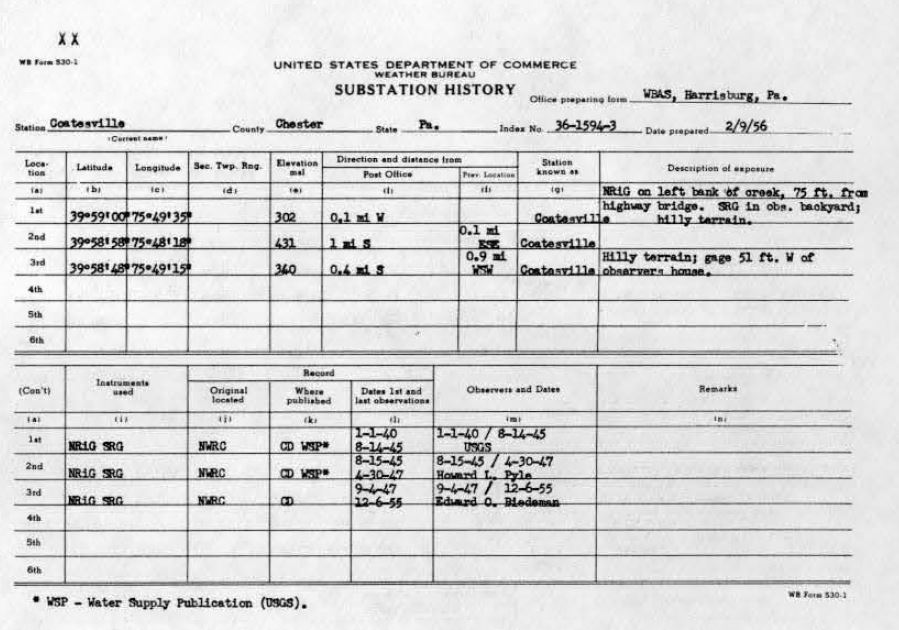
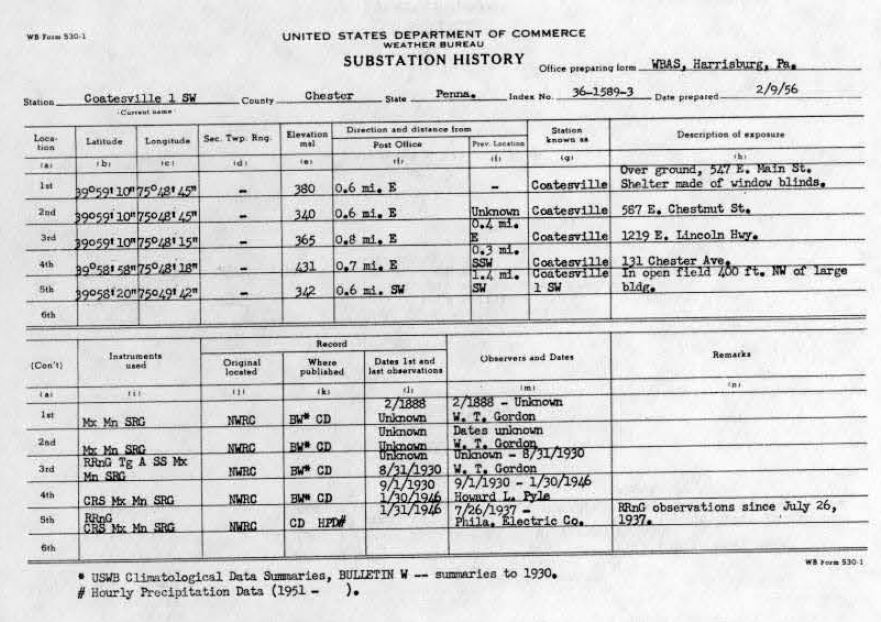
Observer Pyle made a remark about the station move on the January 1946 record. Then there is a record gap through to October 1948, when the first PECO observation record appears. I don't know if this is a real gap. During the same time, observer Pyle is also taking stream gage measurements. The earliest address is shown as 547 E. Main, across from the high school, but observer Gordon owned 574 E. Main, and there is no 547 E. Main on current mapping. https://arcweb.chesco.org/LR_INFO/lr_info.aspx?PARID=1606 03640000
-
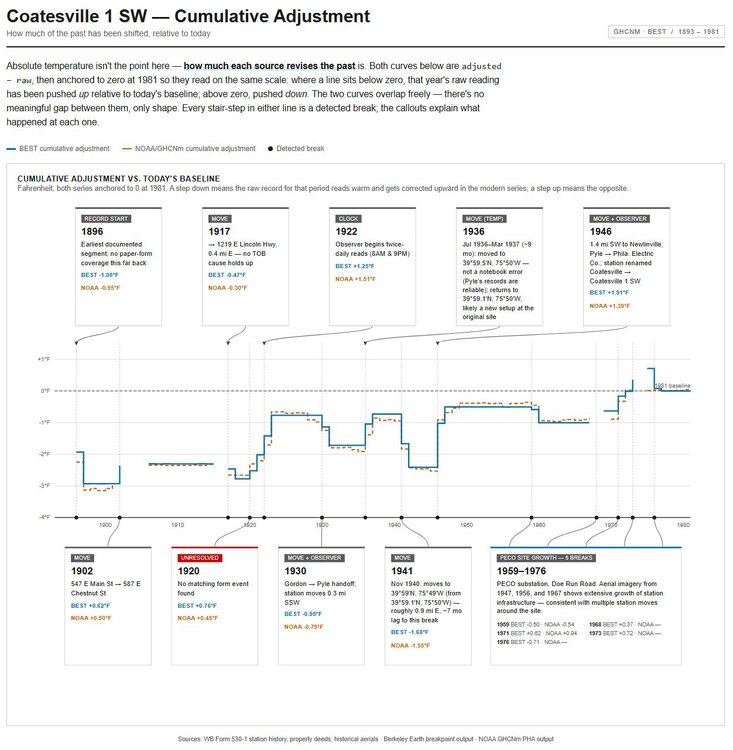
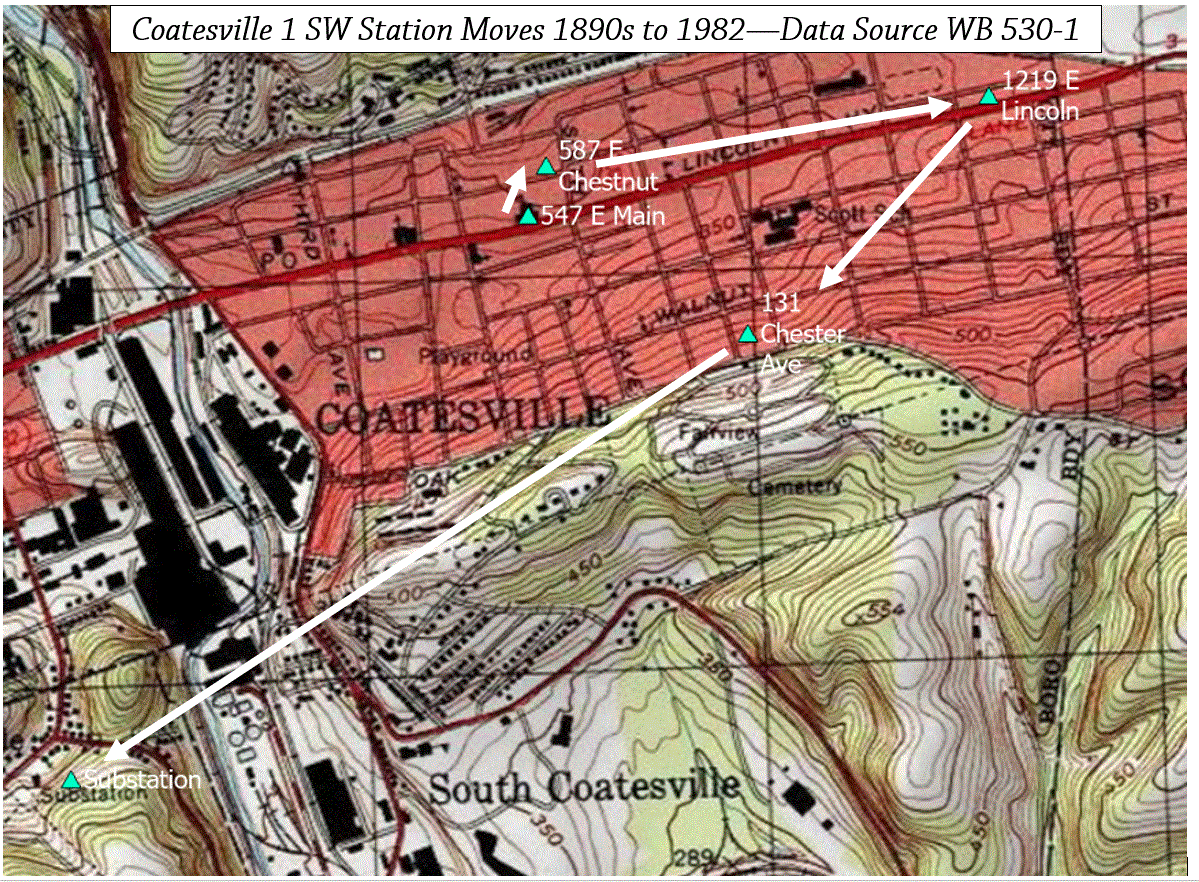
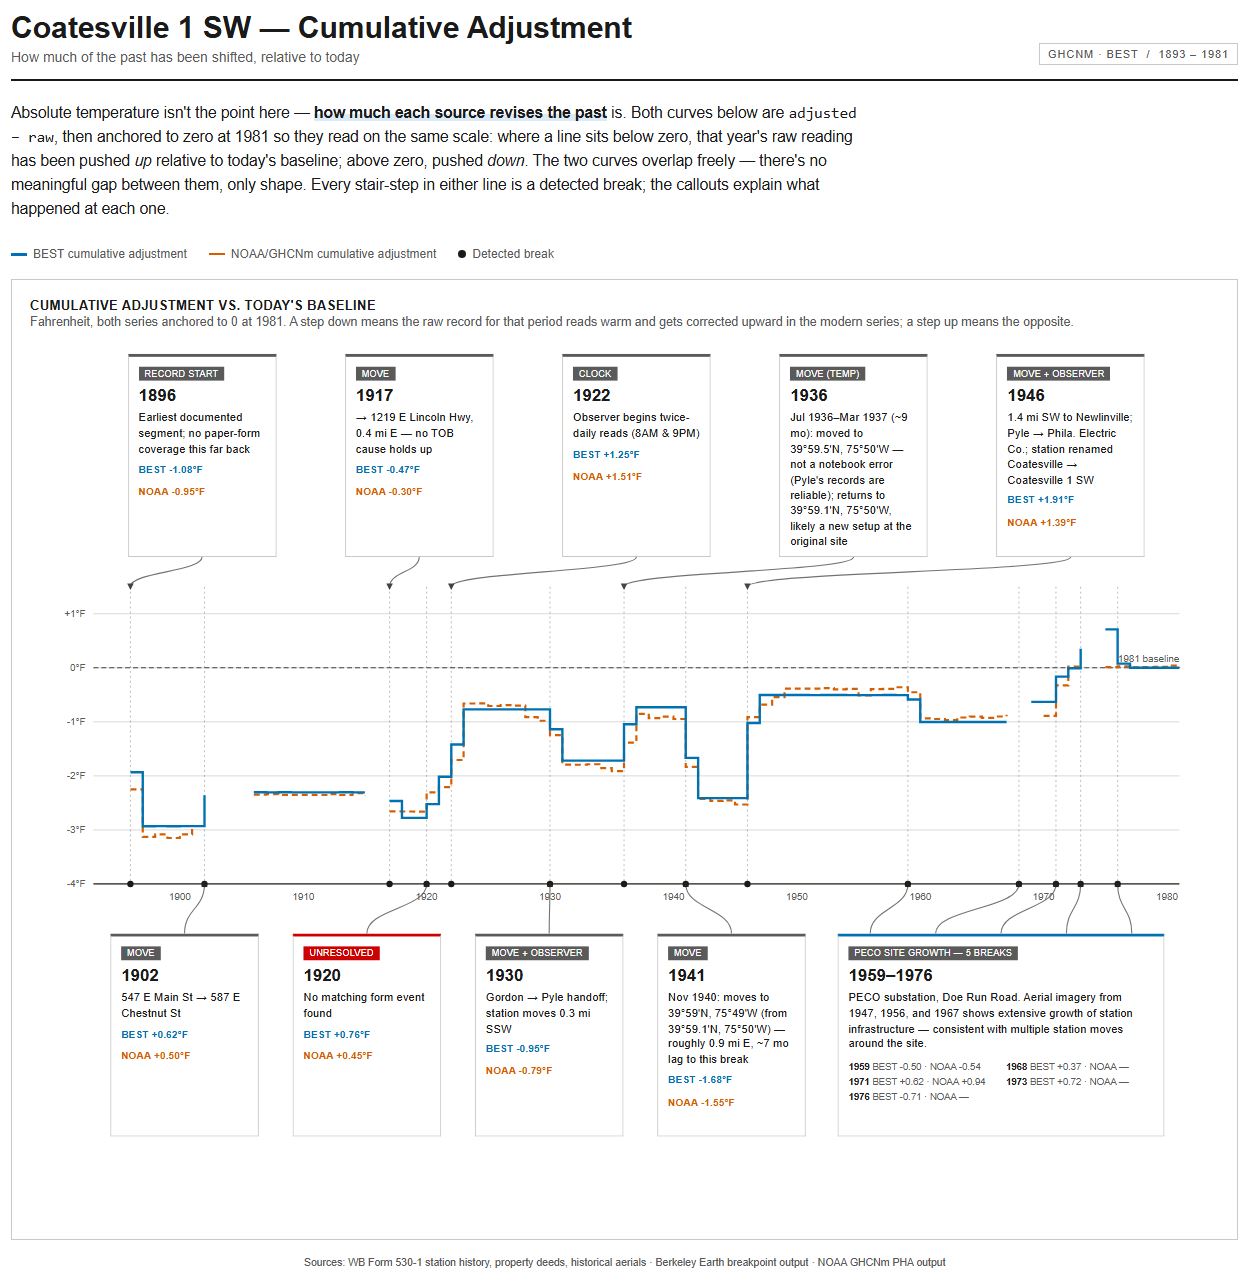
Hi All, occasional lurker and Chester County resident here. I have done a deep dive on Coatesville 1 SW's history, working through the 530-1, the monthly paper records and property deeds for observers Gordon, Pyle and PECO. I then compared the record of station changes with the breakpoints identified by NOAA/NCEI and Berkeley Earth Surface Temperature (BEST). Claude helped with the graphic. There is remarkable agreement between the history of changes at 1 SW and the breakpoints detected. edit: The HOMR record for this station, (presumably pulled from the 1956 530-1 (itself likely pulled from the B44s)) is flawed.