
Mike Cycle
-
Posts
29 -
Joined
-
Last visited
Content Type
Profiles
Blogs
Forums
American Weather
Media Demo
Store
Gallery
Everything posted by Mike Cycle
-
 Paul, your site functionality is impressive. This must have taken a lot of work to get it all running, even with AI writing code. TBH, though, we are still not agreeing on the use of raw weather data to develop climate trends, although at really large scales there is little difference between the raw and processed. --Mike edit: I see and appreciate the steps you have taken to improve the averaging process you are using, "Instead a level offset is solved for each station...". This to some extent mitigates the changing station locations over time, based on their official names, but I note that this still does not incorporate the information we have about station moves within a given station name, such as those for Coatesville.
 -
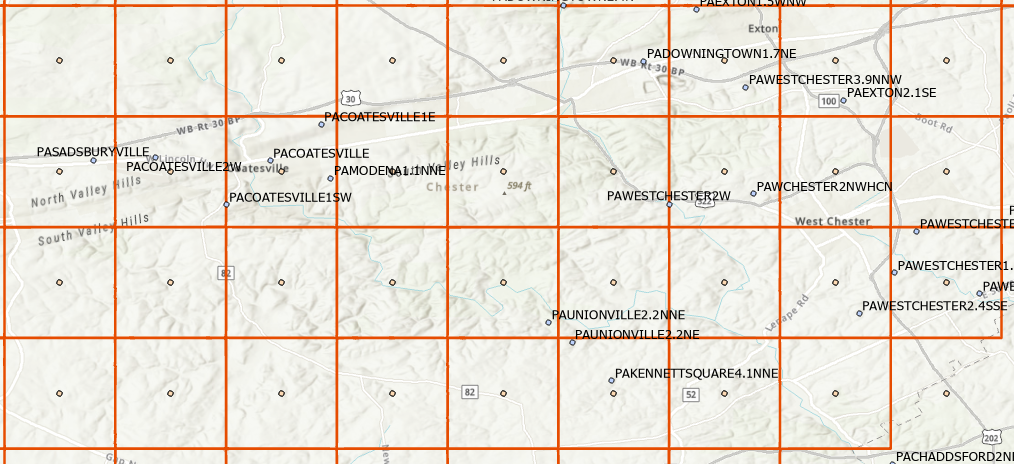
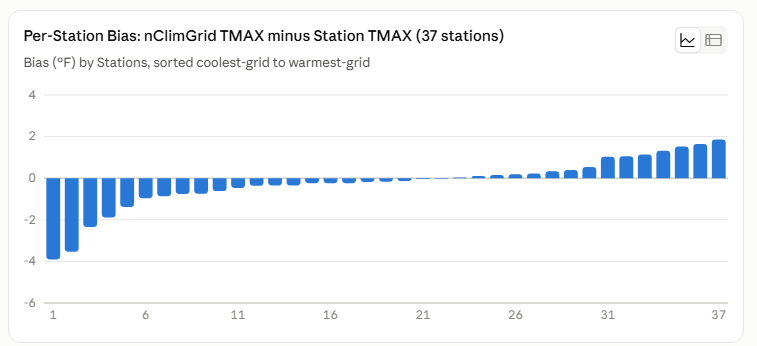
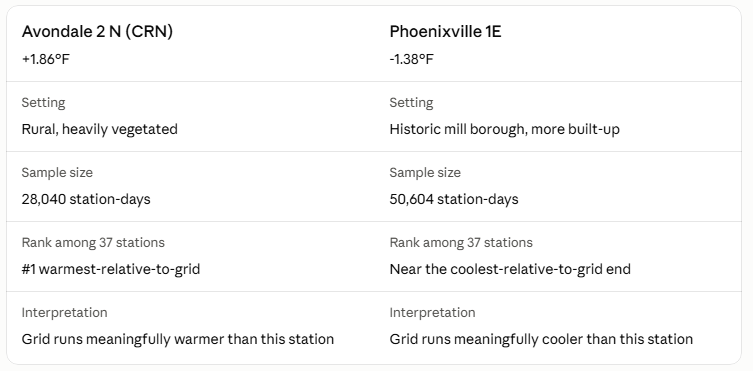
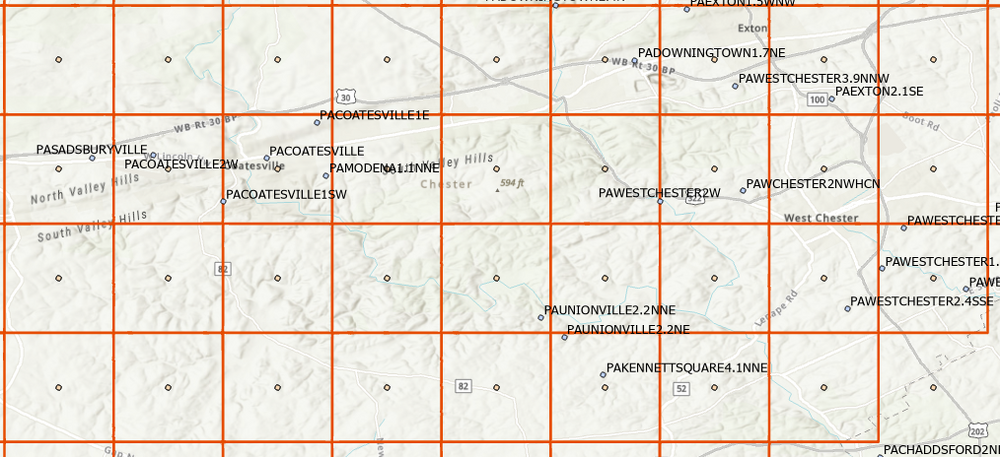
Paul, I started looking at the difference between the daily nclimgrid and daily raw station data for Chester County and surrounding area for 1951 forward. Daily data for nclimgrid starts at 1951. A sample of that analysis is attached, showing that the difference varies by station. This is interesting. The difference may be amenable to modeling. Cell size for the nclimgrid is about 2 X 2 miles--the red squares are each a cell with a time series. When looking at CAG, we are seeing an average for the county of these squares. Can you provide the station list for your recent analysis? Edit. Some of the difference may correlate with nearby forest ET, and some may correlate with site geomorphology.
-
Link to the pdf, its open access. https://rmets.onlinelibrary.wiley.com/doi/epdf/10.1002/joc.5203 A general takeaway is that they drilled in on the precision and accuracy of homogenization versus actual parallel data for several variables (tmin, tmax, etc) and generally find homogenization is better than no homogenization, but still needs refinements. Everyone would agree with that. No one is claiming homogenization is always accurate. What homogenization is doing is gathering information that is dormant in the stations around a target station, and adding that information to the raw target station data. Sharp changes at individual stations are visible against the backdrop of other stations, and this is information we want. This is what Chubbs is demonstrating directly in his examples. And looking at his examples, one can see there is a lot of noise inherent in the process.
-
Paul, you are correct that the magnitude of the adjustment is inferred, but not well documented in the sense that is has been verified by field measurements. This is how PHA works, and this is the data we have. Ideally all station moves should include a multi-year parallel observation period, where observation are made at both the old site and the new site to find the actual temperature difference. Here are two studies on that topic Valk, T., et al. (2023). "Homogenization of daily temperatures using covariates and statistical learning — The case of parallel measurements." International Journal of Climatology. Four Dutch KNMI stations (Den Helder/De Kooy, Groningen/Eelde, Vlissingen/Souburg, Maastricht/Beek) relocated from city to airport sites with true overlapping parallel measurements at old and new sites; used to build and test a statistical method against the directly-measured offset. Vincent, L.A., et al. (2018). "Uncertainty in homogenized daily temperatures and derived indices of extremes illustrated using parallel observations in Canada." International Journal of Climatology. 88 site pairs across the Canadian network with 5-year parallel observation periods, used to quantify how much uncertainty homogenization introduces relative to real, directly-measured ground truth. But, Berkeley Earth Surface Temperature's approach does not work like PHA. The magnitude of the temperature shift that BEST finds for a station moves is a byproduct--not an objective.
-
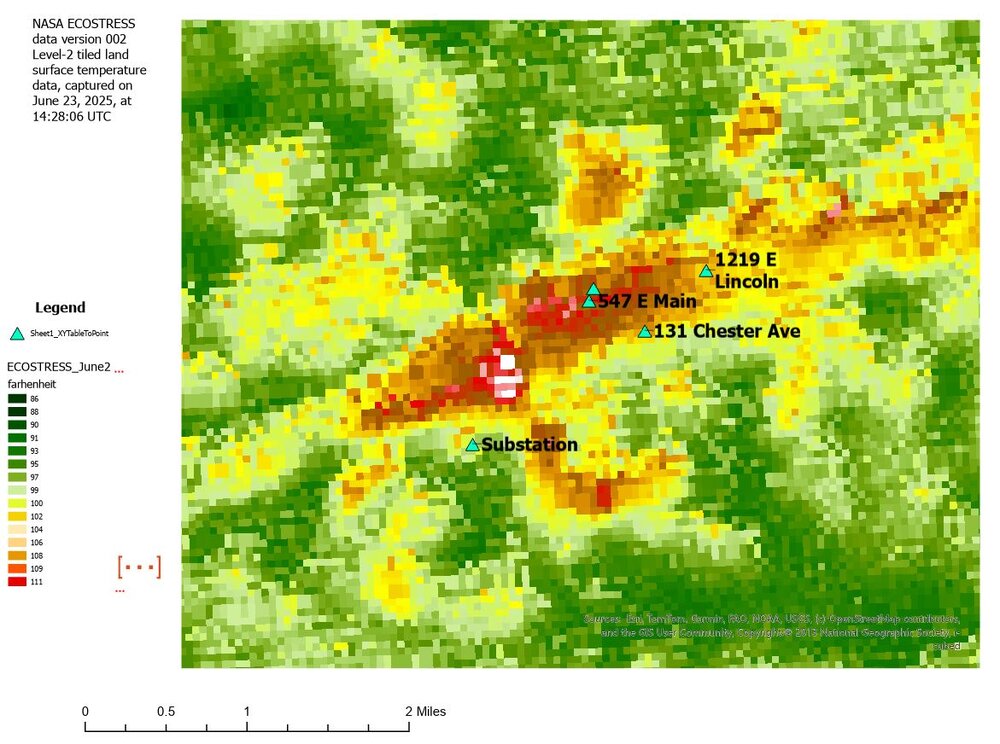
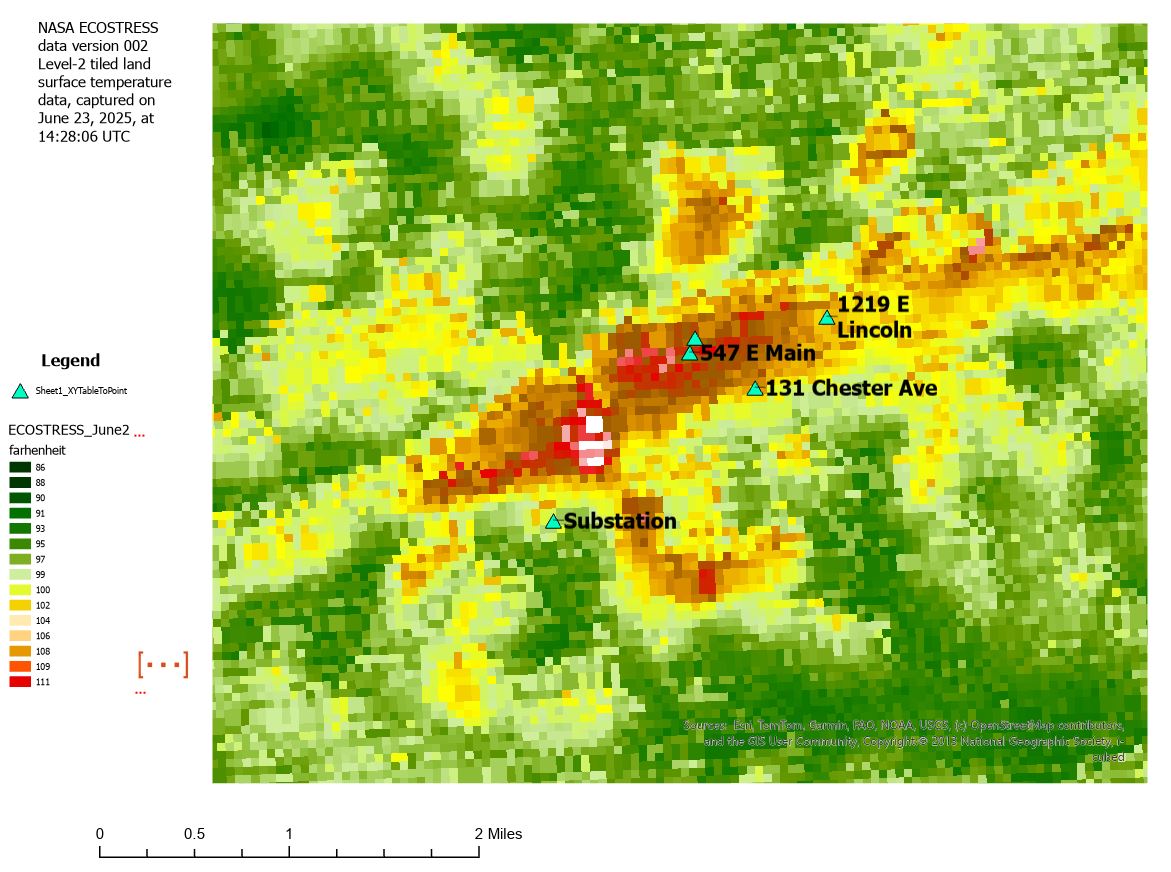
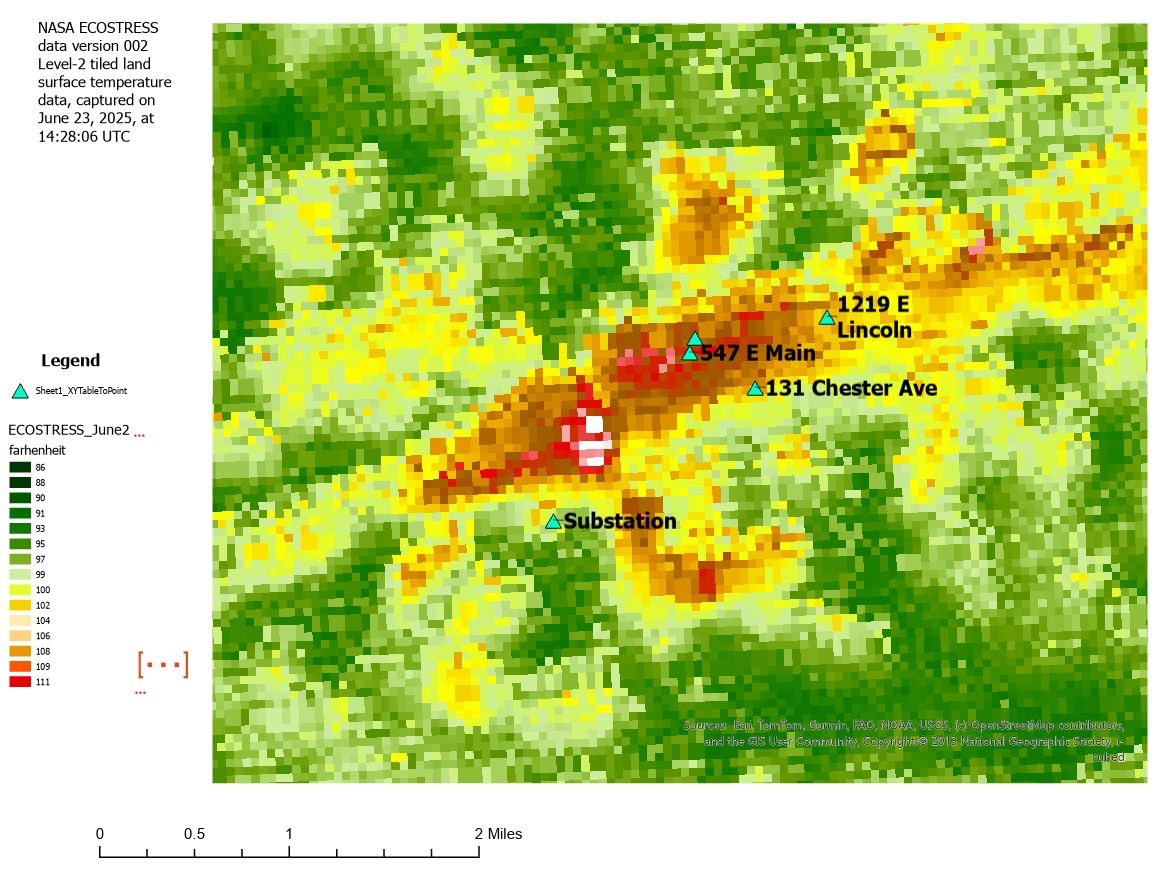
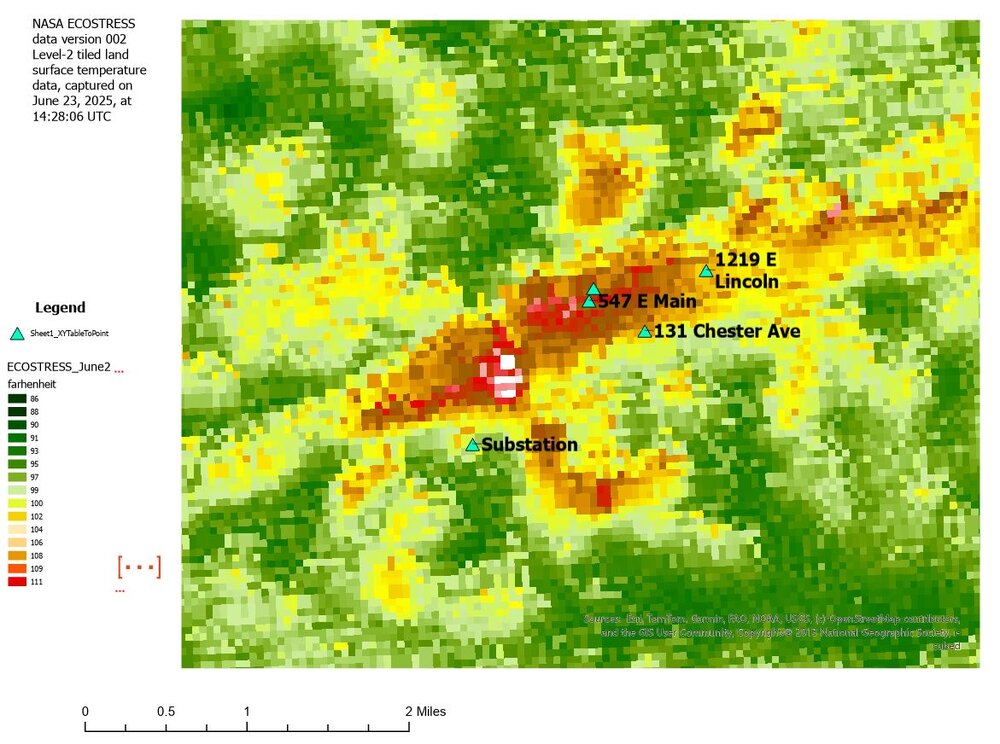
More strawmen! 1) The 1946-direction of temperature change. "If the station relocated onto a substation with massive transformers and high loads, the raw record should have jumped warm". Built on a mechanism I never asserted, but you attributed to me and then rebutted. 2) "Unverifiability is being offered as a reason for confidence". Same false premise as #1. 3) "Your mechanism implies a ramp, PHA fits steps — wrong shape". same false premise as #1. 4) "you claimed to know the direction/magnitude". Not something I ever said. I have offered a satellite-based 30 m pixel surface temperature map that showed progressively cooler station siting conditions for the day the satellite data was collected, and that "Coatesville 1 SW generally moves progressively from hotter to colder microclimates". The satellite map is pretty neat I think, so I put it here again. 5) The "documented" vs. "thermal zoo" contradiction charge. Not something I have claimed. I have said repeatedly, and will repeat now, that the I have fully documented the breaks as valid and necessary. I have never claimed to know or documented the precise direction or magnitude of breakpoints--that is your reading. To document the timing, direction and magnitude of each break I would need to have precise and accurate microsite details, precise and accurate knowledge of the instruments, and a precise and accurate records of every interaction of the observer with the instrument--probably much more--throughout the station's record. Beyond ridiculous.
-
AI can do that easily. I will put it to work. Should we look at daily, monthly, or annual? Tavg, or Tmin and Tmax?
-
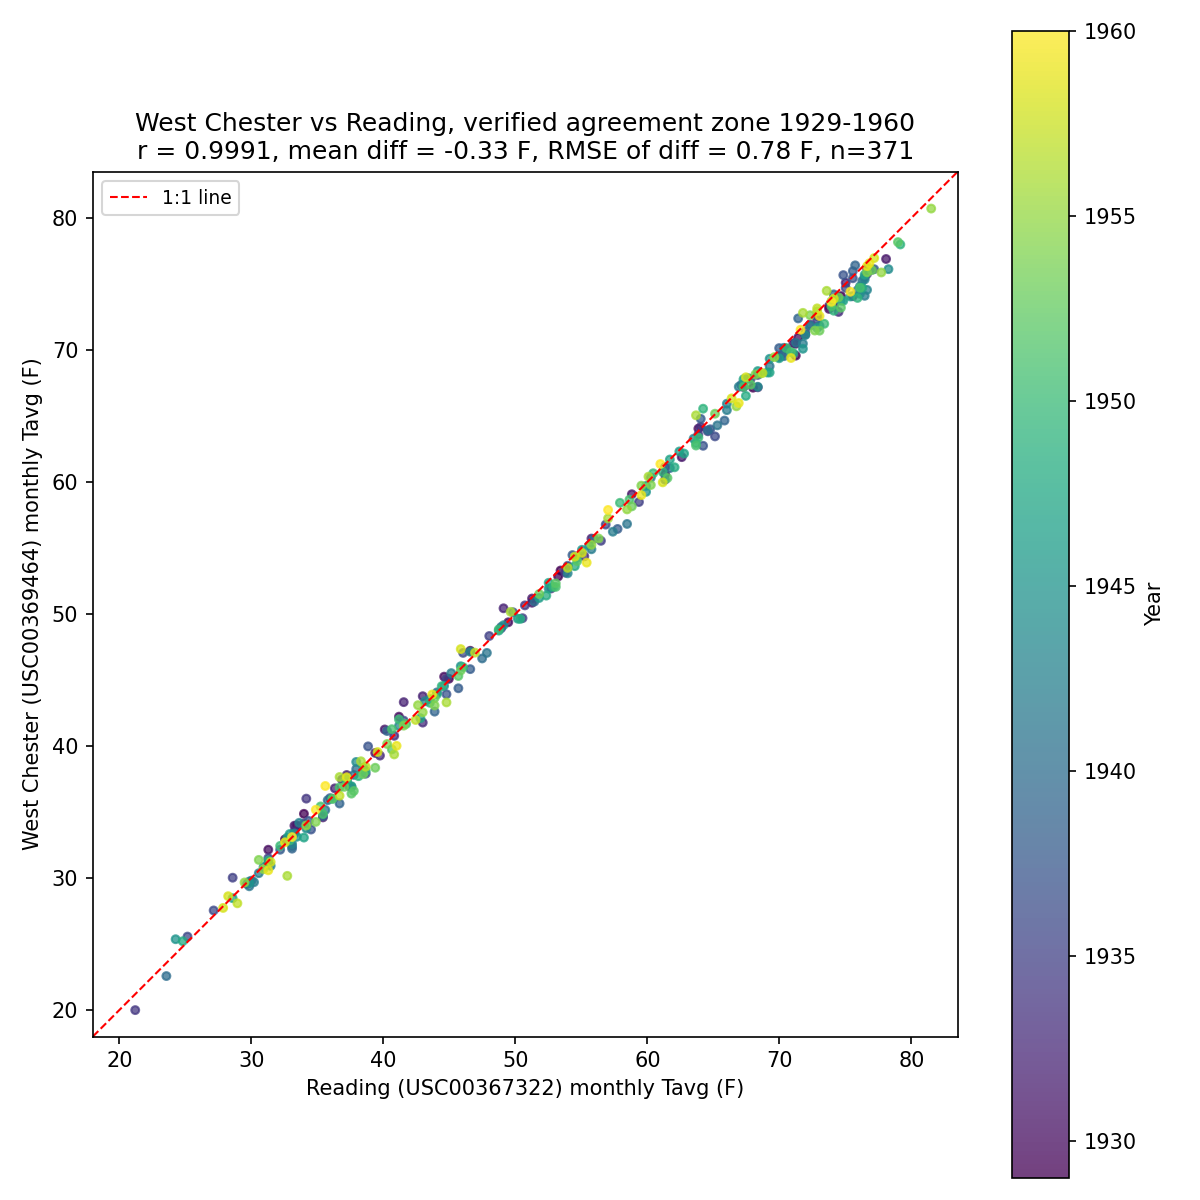
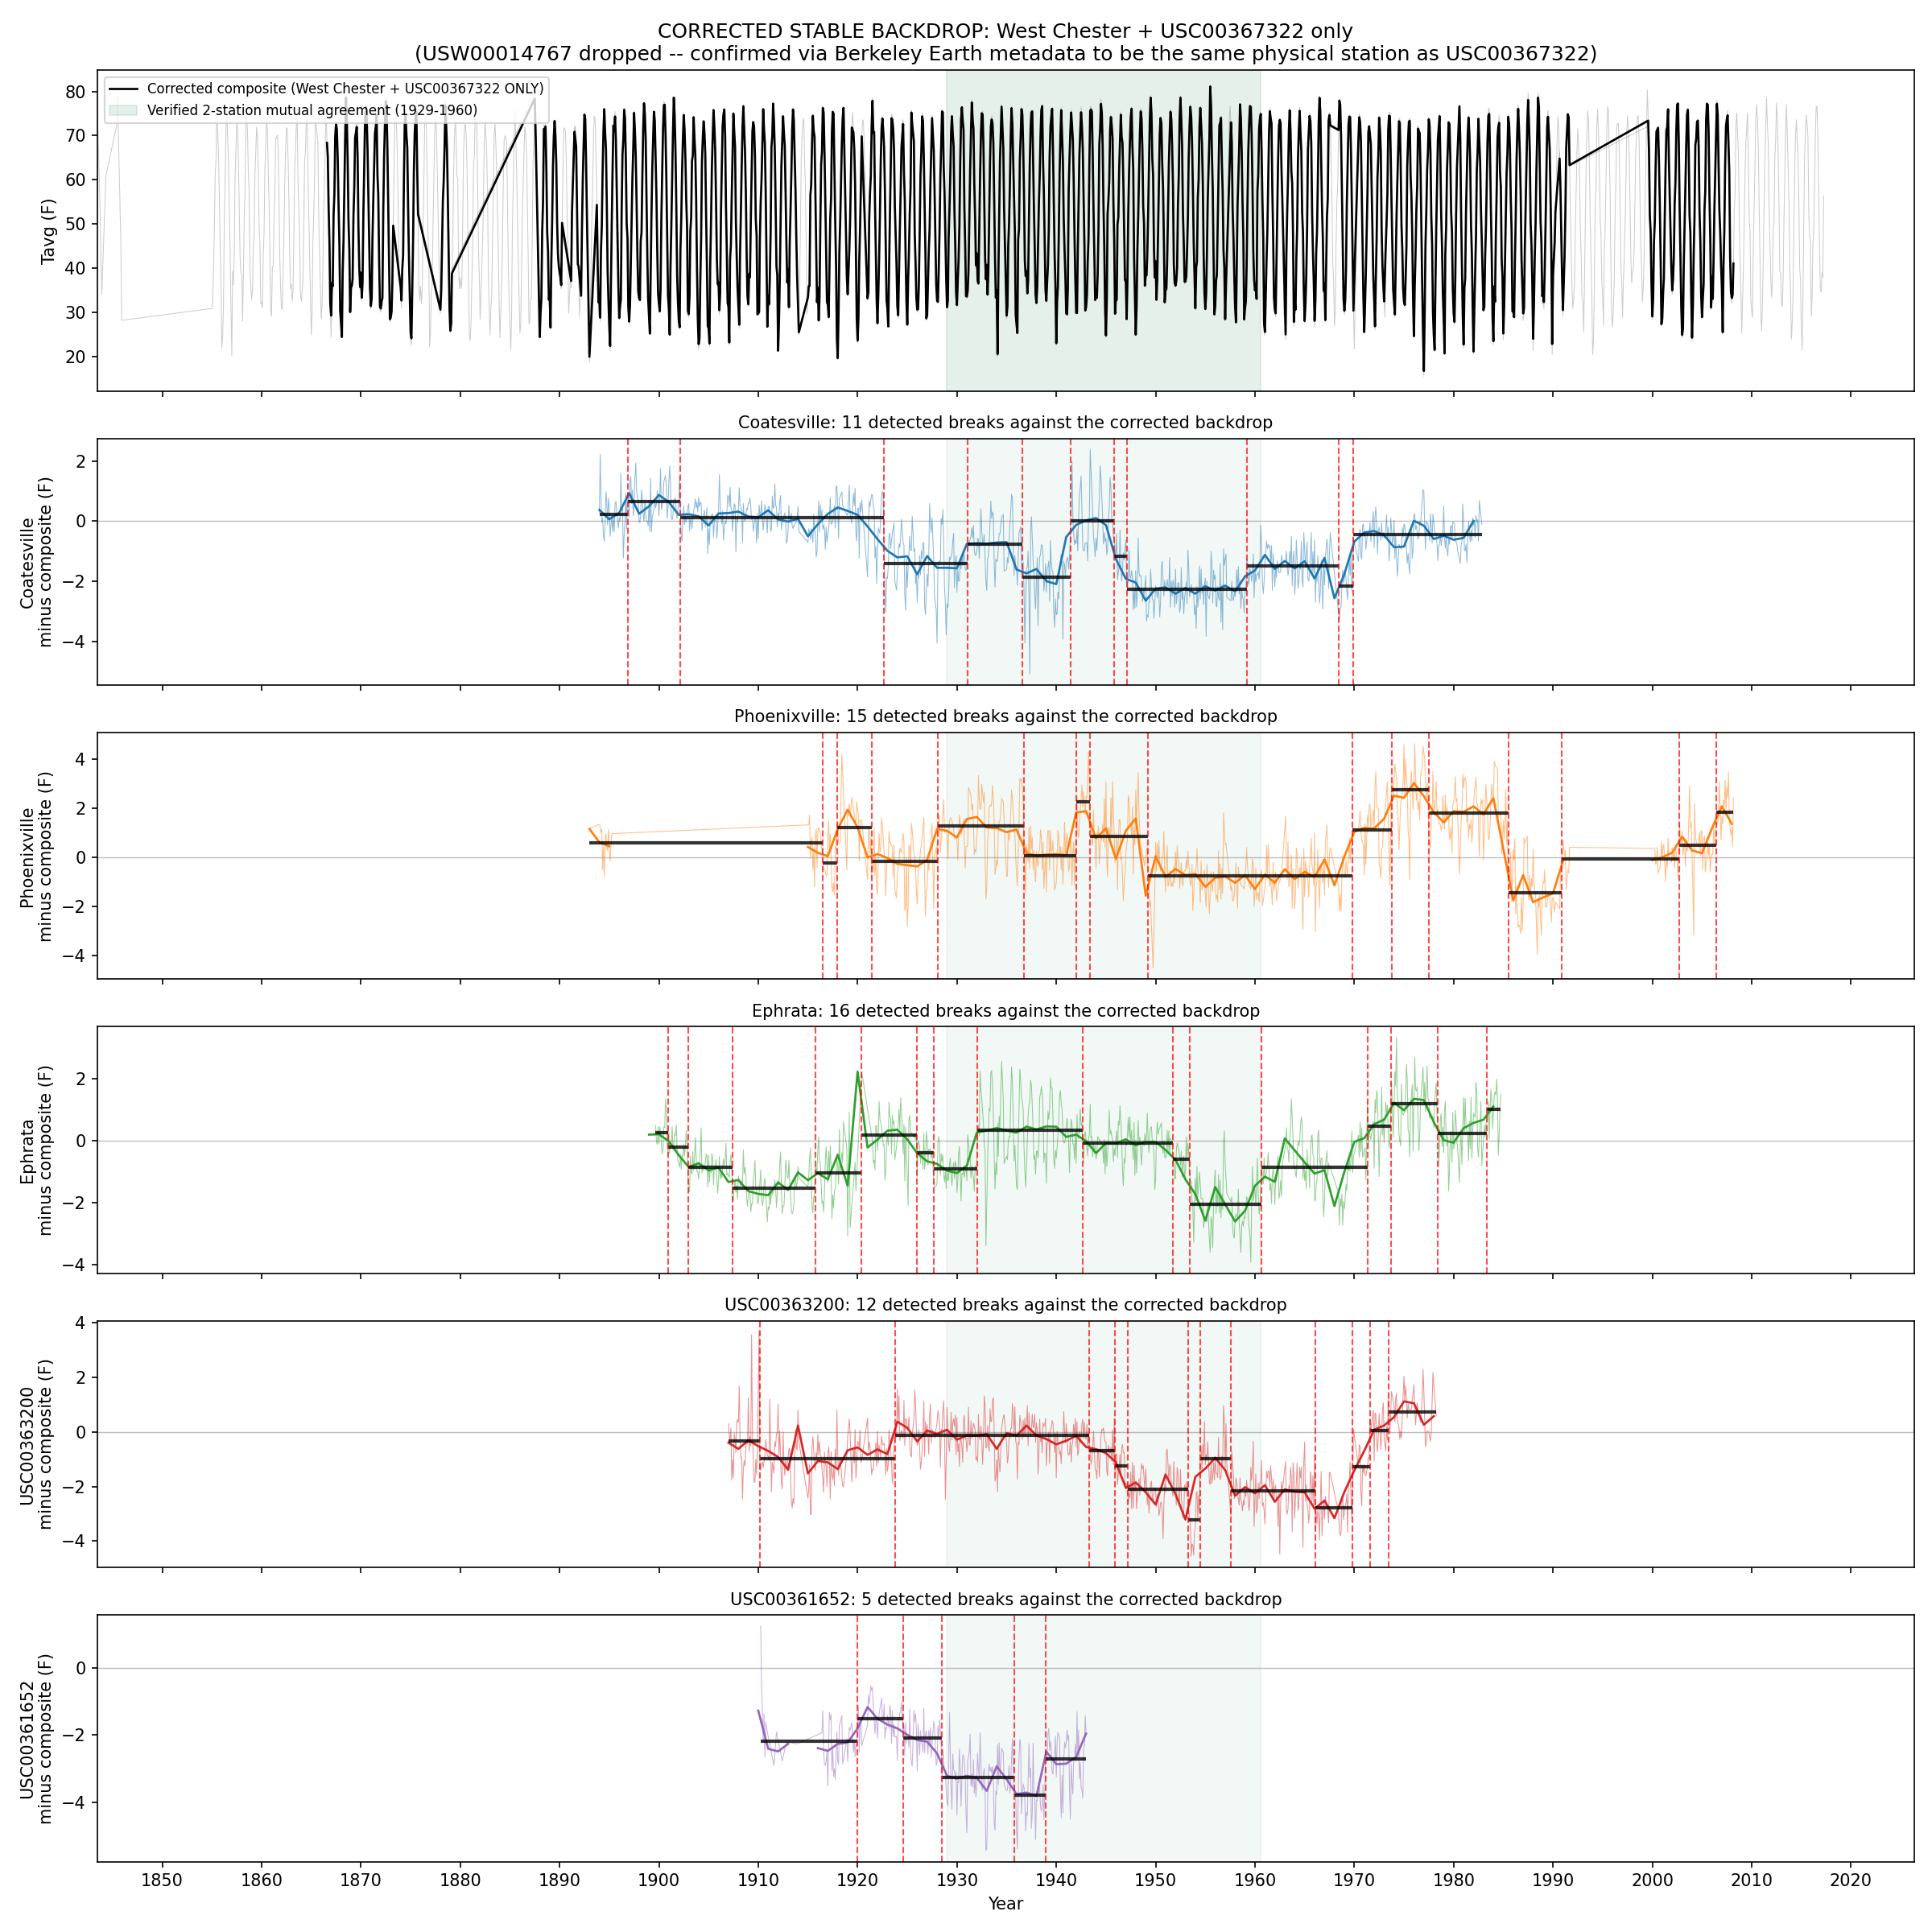
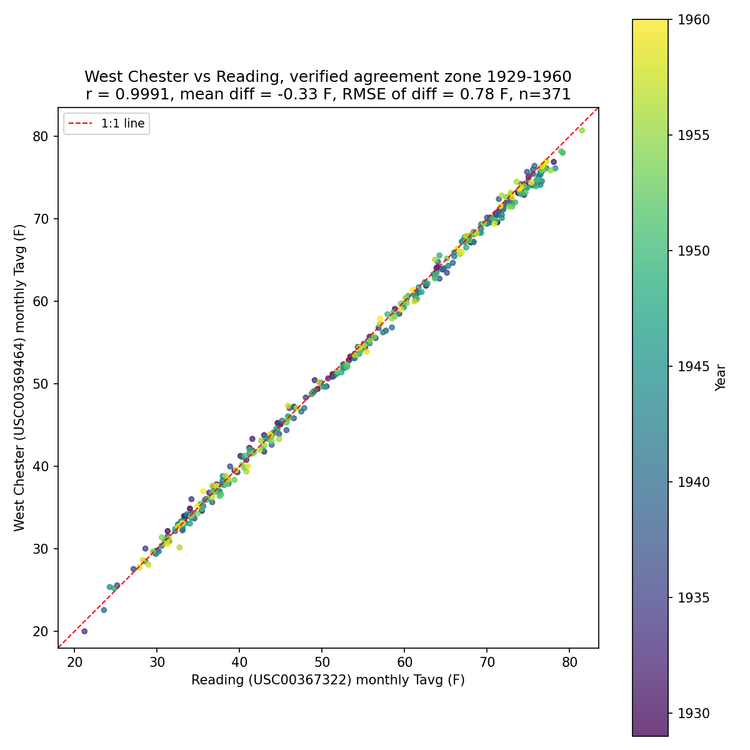
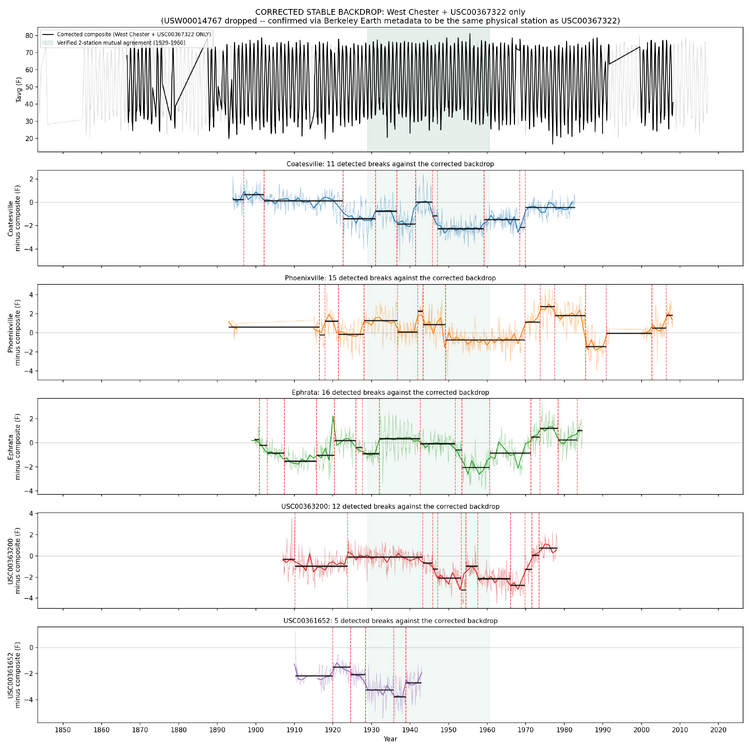
Chubbs, I did try to expand your manual breakpoint detection process by asking AI to look at surrounding stations and identify "islands" where multiple stations are moving together. I explored various settings, such as the minimum amount of synchronized temperatures before declaring an island, minimum stations to make an island, rules for stations leaving an island and new stations joining, and new islands forming. The geographical area grew too large, pulling in Allentown etc. It will work, but its not a clear demonstration of using semi-local stations to identify breaks. However, Reading and West Chester do synchronize from 1929 to 1960 and make what looks like a solid reference against which breaks can be detected. I have not looked at the individual breaks, but these breaks should be those that would be found by your approach. Edit: this does not rule out the case where Reading and West Chester have overlapping breaks.
-
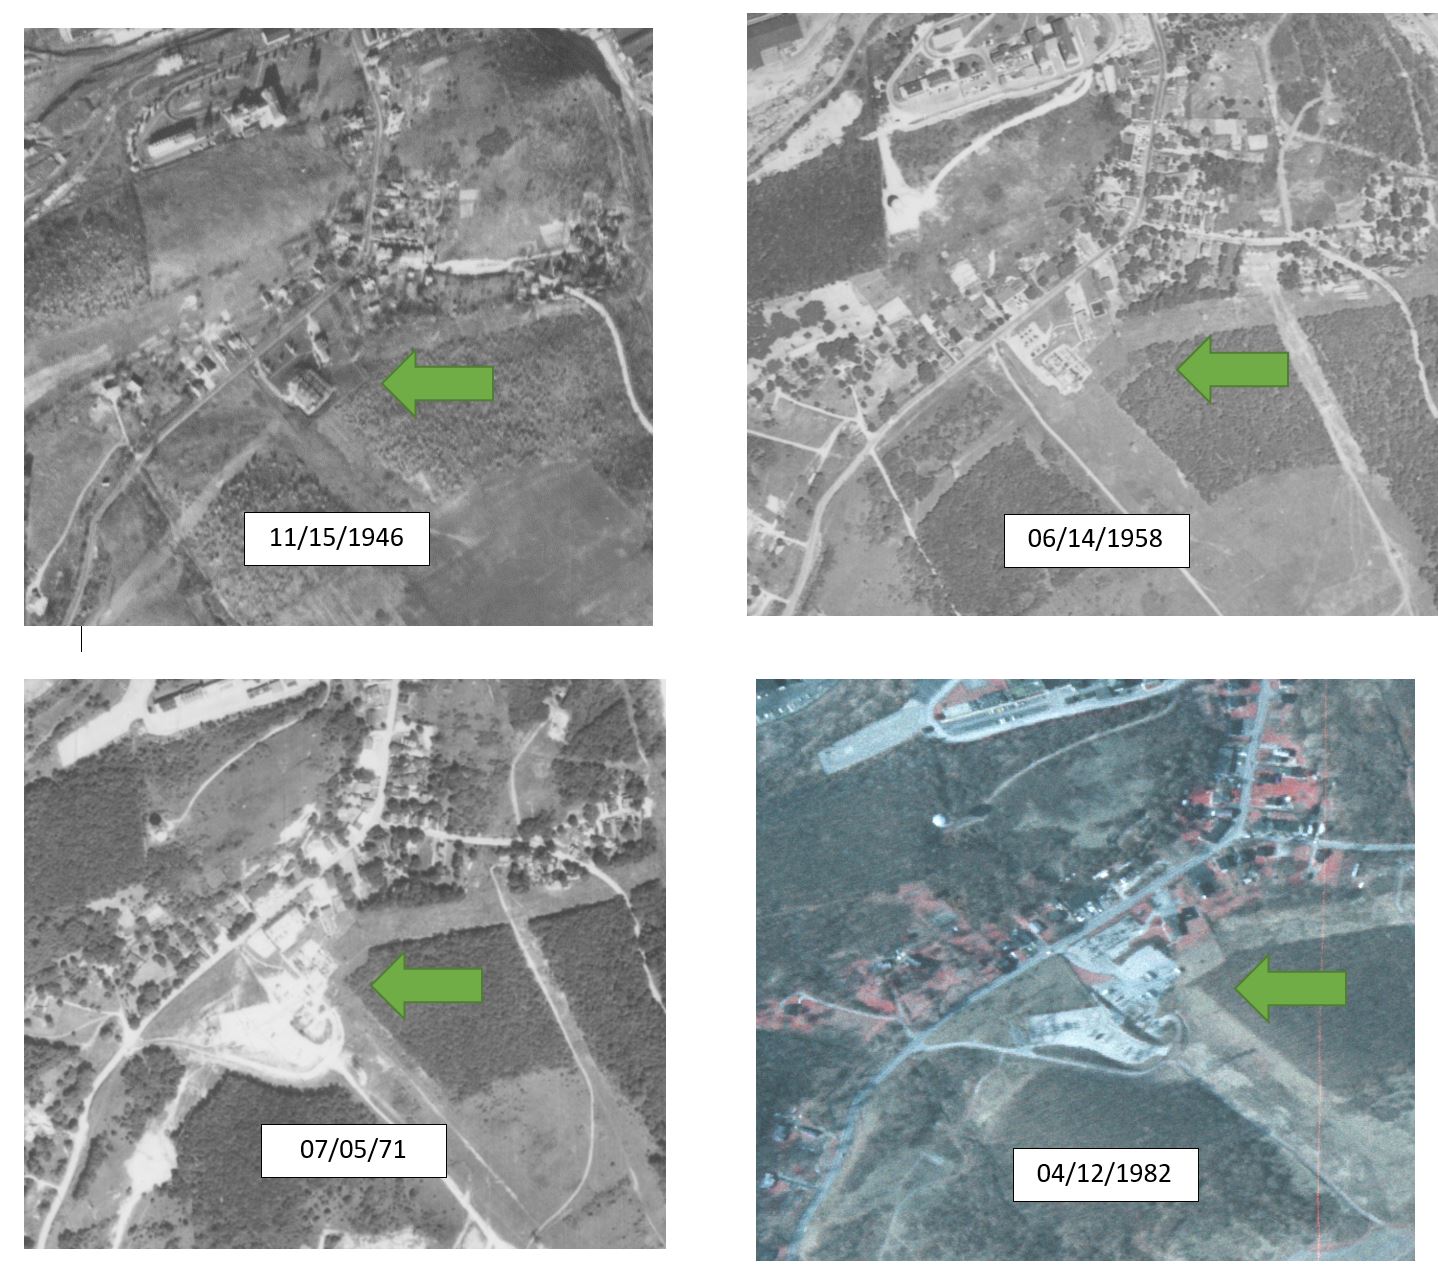
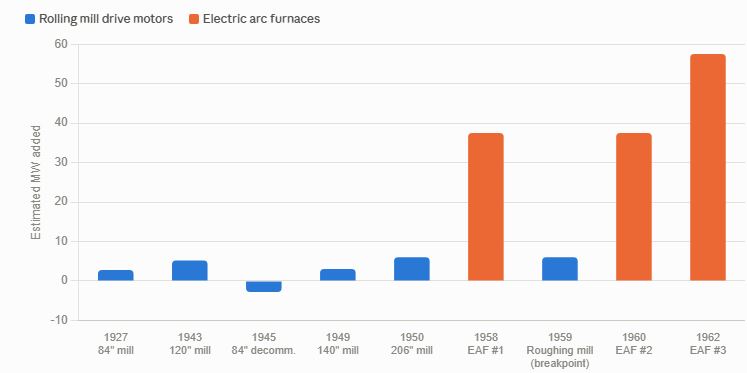
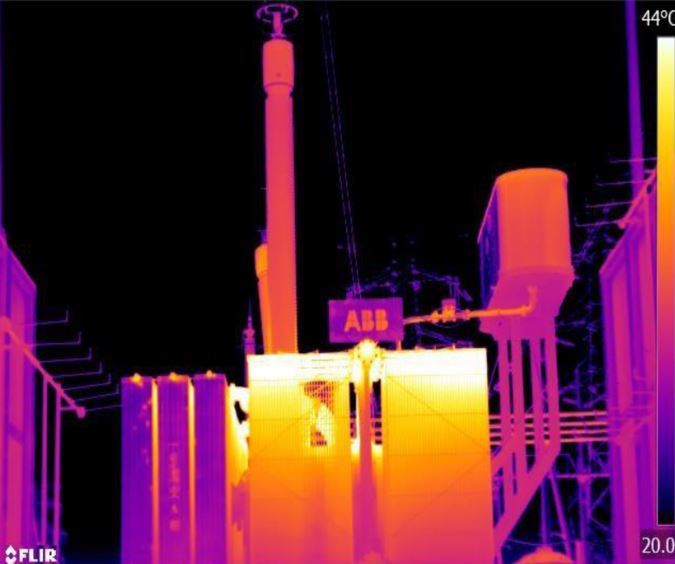
As an example of why breakpoint detection is absolutely essential, and where there are no alternatives besides something like a pictorial history of the station, Coatesville is a winner. From 1946 on to 1982, Coatesville station was at the Newlinville electric substation. The electric substation is constructed about 1927 to supply the steel works in town, and takes high voltage transmission line power and steps it down. BIG transformers are involved. The Newlinville electrical substation was frequently redesigned to meet the needs of the steel works. Transformer technology improves over time, with less waste heat. A cooling pool is installed at one point to take transformer heat during high loads, and is removed after 2005. So, we have a station with massive heat sources, that are moving as the station expands, and we need to detect changes in the station environment. This obviates all the musings about what caused a precise shift at time X and magnitude Y--this microsite is literally a thermal zoo. Automated breakpoint detection is the only way to salvage this data. Attached is a figure showing estimated power increases over time, developed from historical uses. These increases would have forced numerous changes over time at the substation. And consider, if a new transformer/switchgear is being installed, it would occur at a new pad on the site, while the old transformer/switchgear remains in operation. On change over, the newer transformer/heat source has moved abruptly, and the old transformer idled and eventually removed. Breakpoint. And the new heat source is very likely southwest from the earlier heat source, and very likely further away from the weather station. Attached also is a random thermal image of a substation.
-
Paul, you need to find a case where you can show PHA failed, and more generally, show that PHA is a bad approach. The burden is on you to show that the station was incorrectly adjusted, not on me to walk you through the variables a Newlinville. Here is a quick review of where we are at on your 2 year old thread: Q1 — Is it necessary to adjust raw data before use for climate trends/model inputs? Yes. Raw records carry known, non-climatic biases (station moves, instrument changes, time-of-observation changes, site changes) that don't cancel out and will systematically distort trends if left uncorrected. Q2 — Is it perfect? No. Breakpoint detection is demonstrably imperfect and even unstable run-to-run (shown in this thread's own evidence), and the method is explicitly statistical inference, not direct measurement. Q3 — Is it pretty good, and has it undergone rigorous review/testing for over a decade? Yes to both. Multiple independent blind benchmarks (Venema 2012, Williams 2012, Killick 2022) show it reduces error relative to known synthetic ground truth, and it's been continuously re-tested and refined for over 15 years, including by critics actively trying to find its weak points Q4 — Given all that, does a cherry-picked local anomaly (minor adjustments at Newlinville era) amount to a valid attack on the process? No. A single, non-representative case can't outweigh a decade-plus of adversarial, blind-tested evidence — however carefully that one case is analyzed.
-
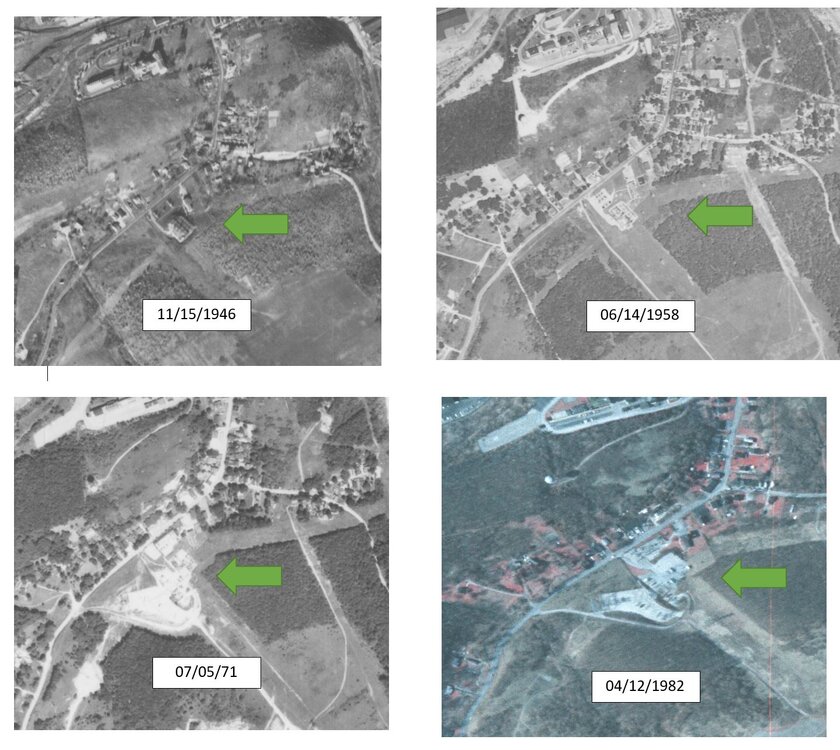
The Coatesville graphic I supplied says that in the period of 1952 to 1982 there was extensive construction going on at this station location. its an electrical substation with megawatts of power going through it. As components move, there will be step wise changes--up or down. The station itself could be moving also as office space changes. Here are the images showing that station and ongoing construction. Once again, we have 100% documented evidence of microsite impacts to a station record, and a) adjustments are valid and b) absolutely necessary. Both a and b are within the context of using weather station data to develop climate information from multiple stations.
-
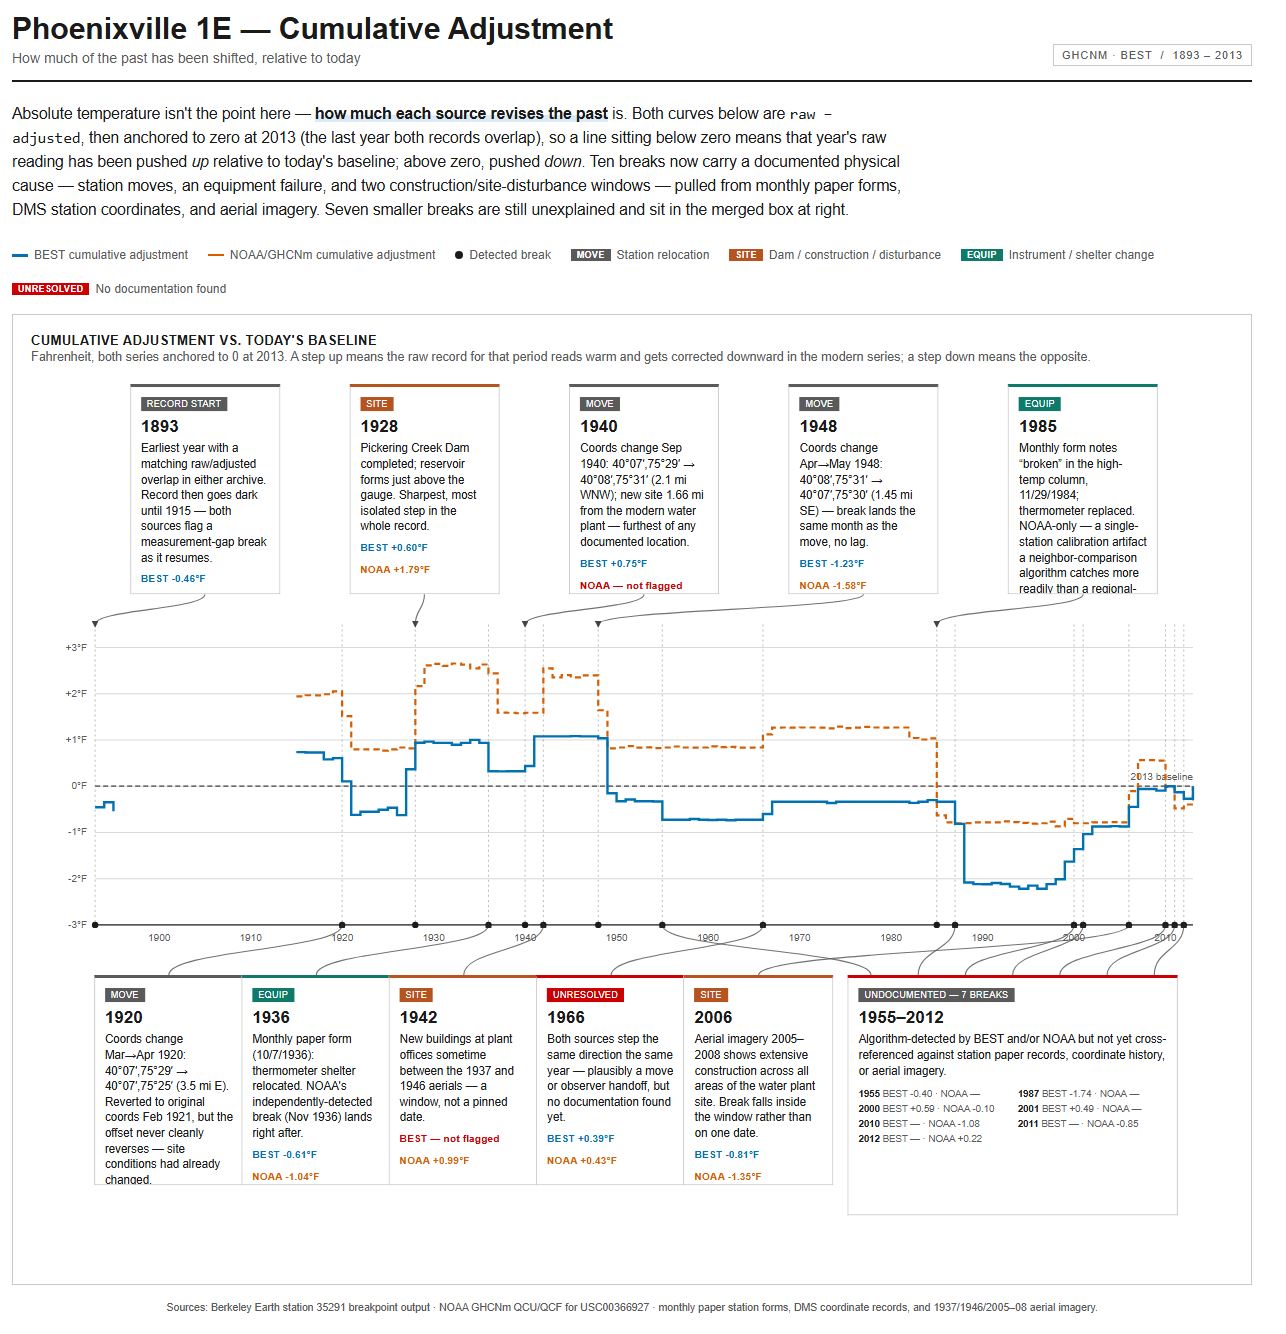
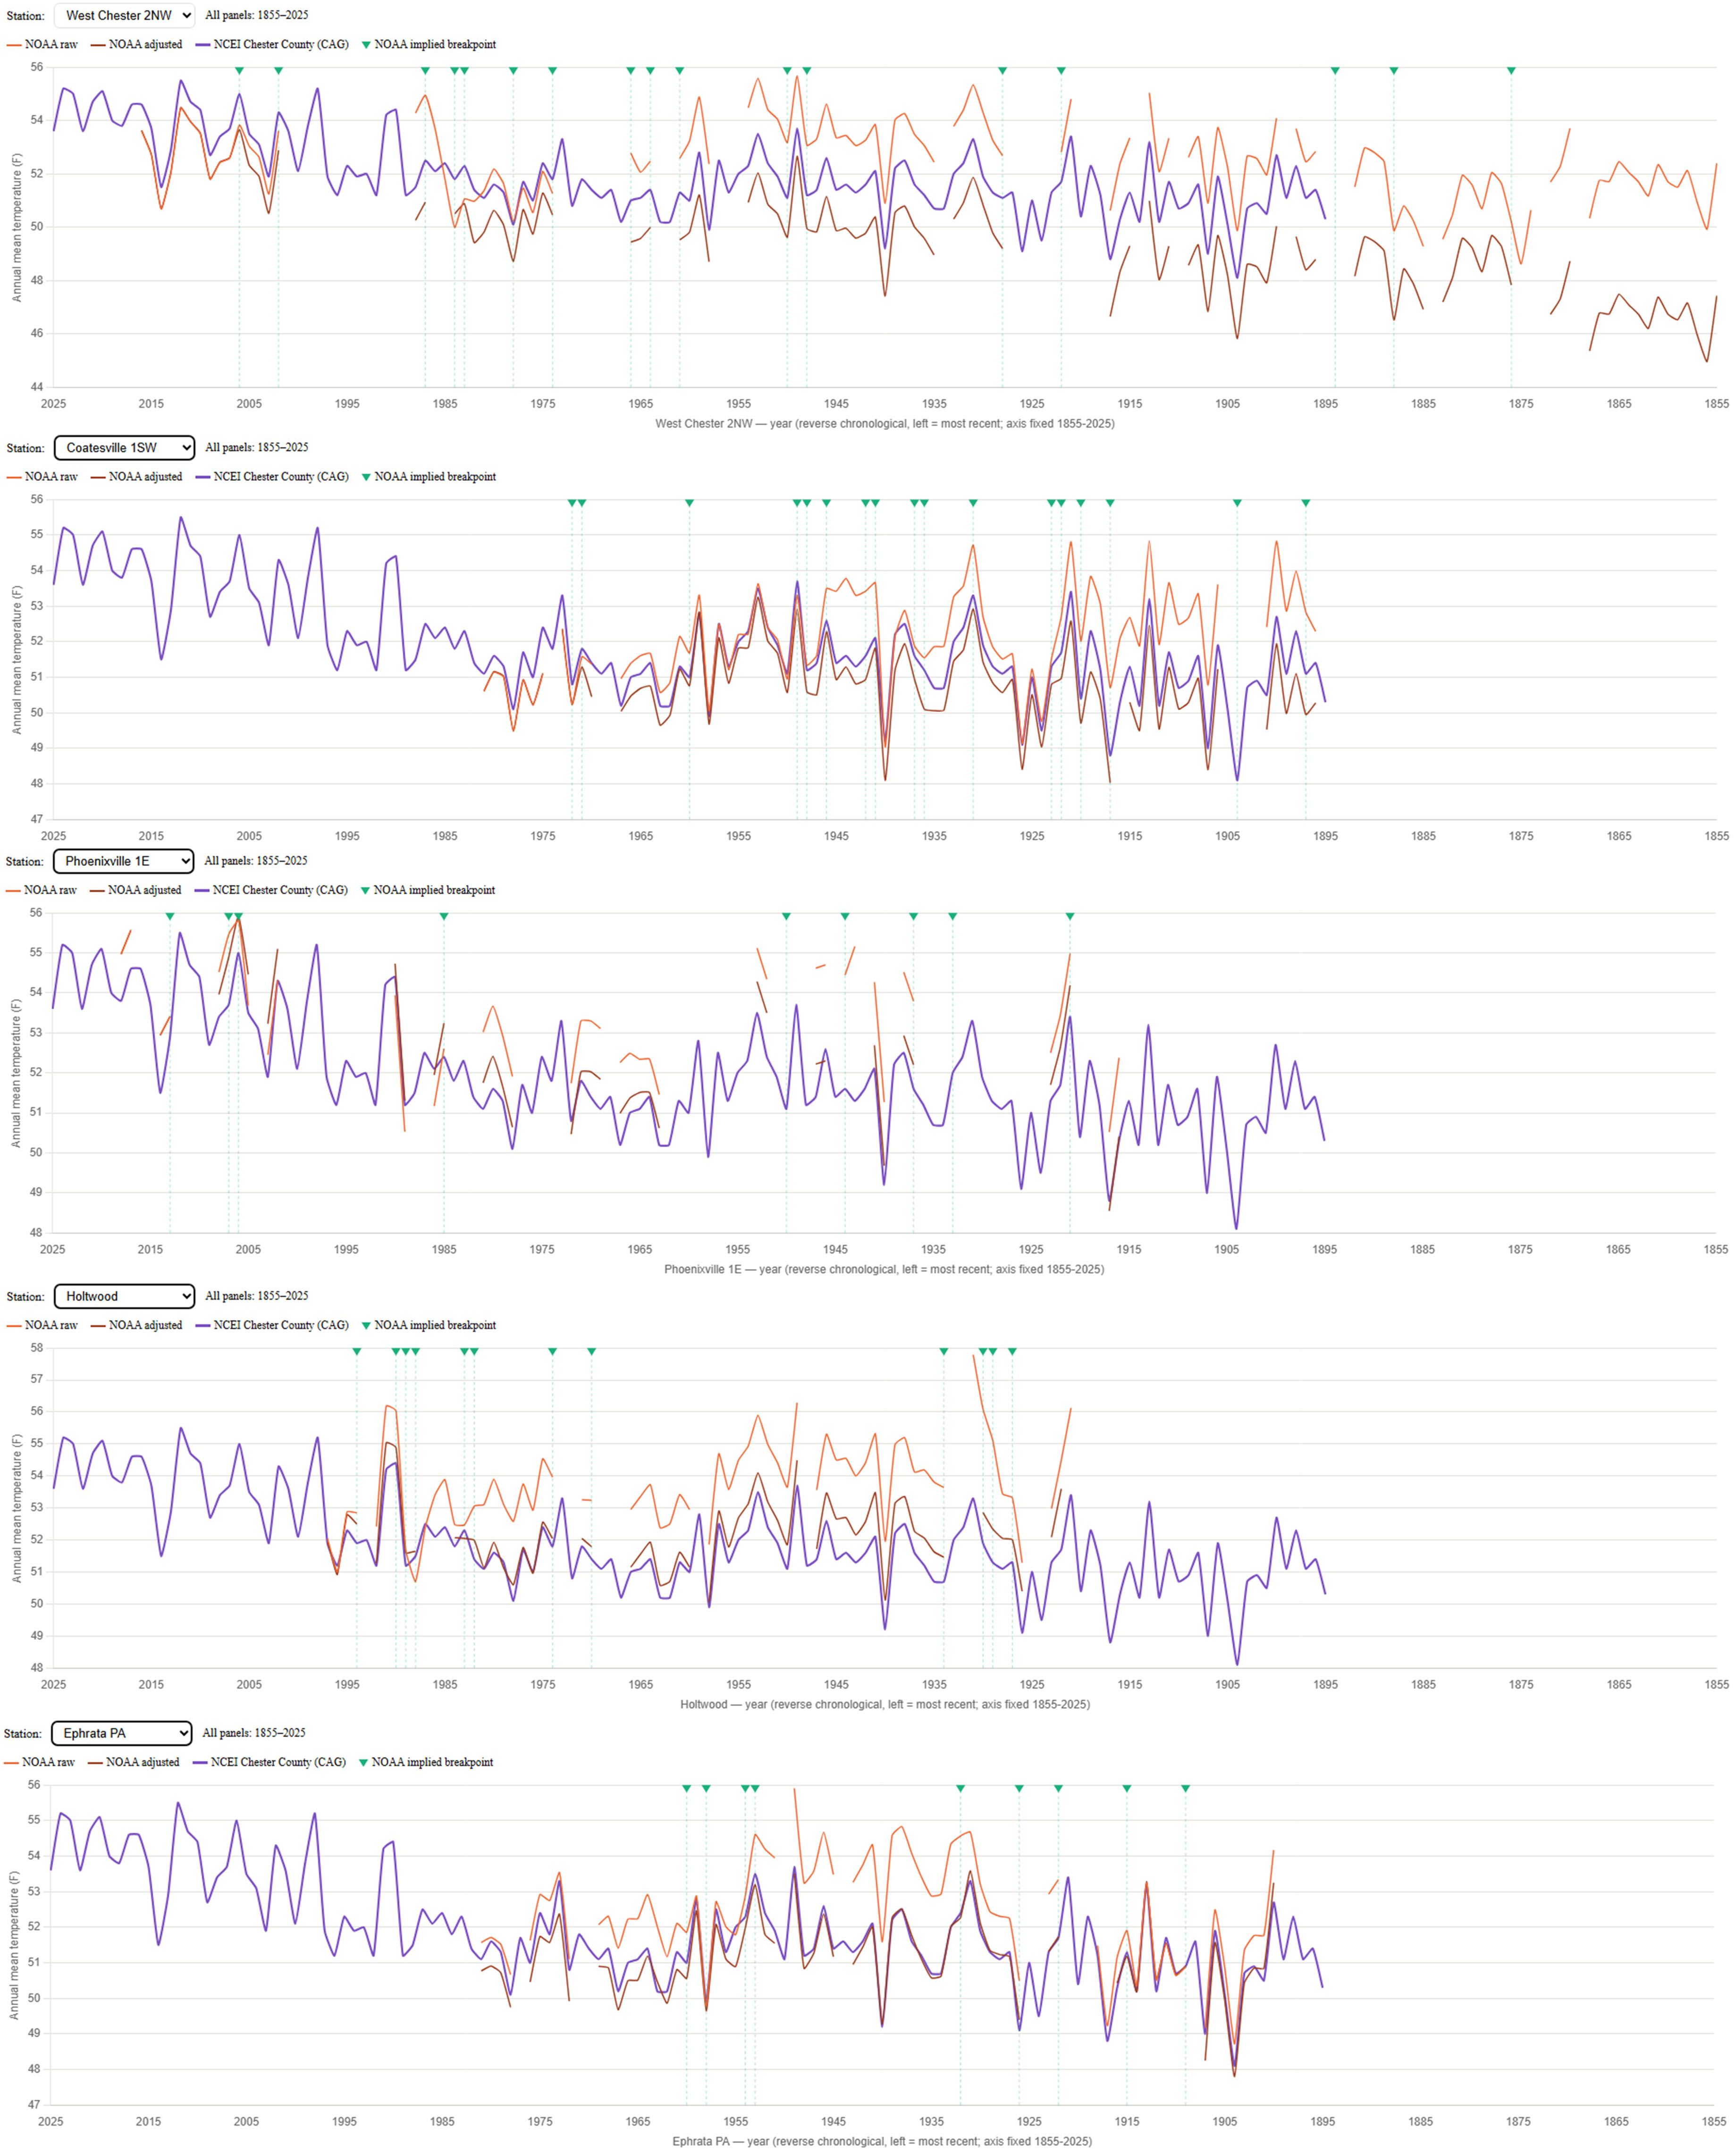
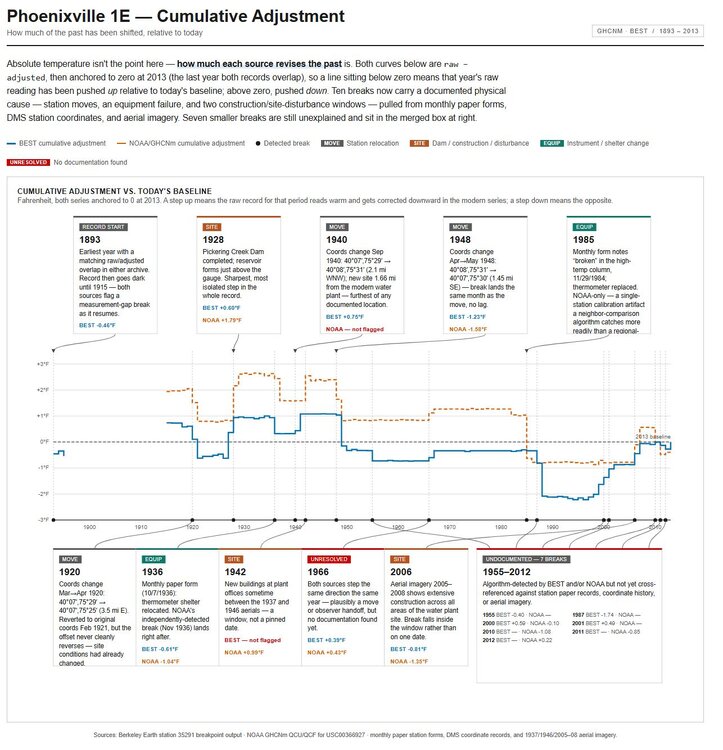
The main question of this thread is whether the adjustments to raw data are a) valid and b) essential. The deep dive on Coatesville upthread answered these two questions for Coatesville with two resounding YESs for that station. Here is the breakpoint analysis for Phoenixville 1E. It also demonstrates that the adjustments done to the raw data are a) valid and b) absolutely necessary. Note that all of the aerials from 1927 forward show changes at the site--roughly every ten years between aerials--so there is going to be microsite changes. One has to wonder, for all of the time some folks have put into explaining why the adjustments are arbitrary, ad hoc, suspect, etc etc, why they did not just take two hours and look at the easily available documentation on line.
-
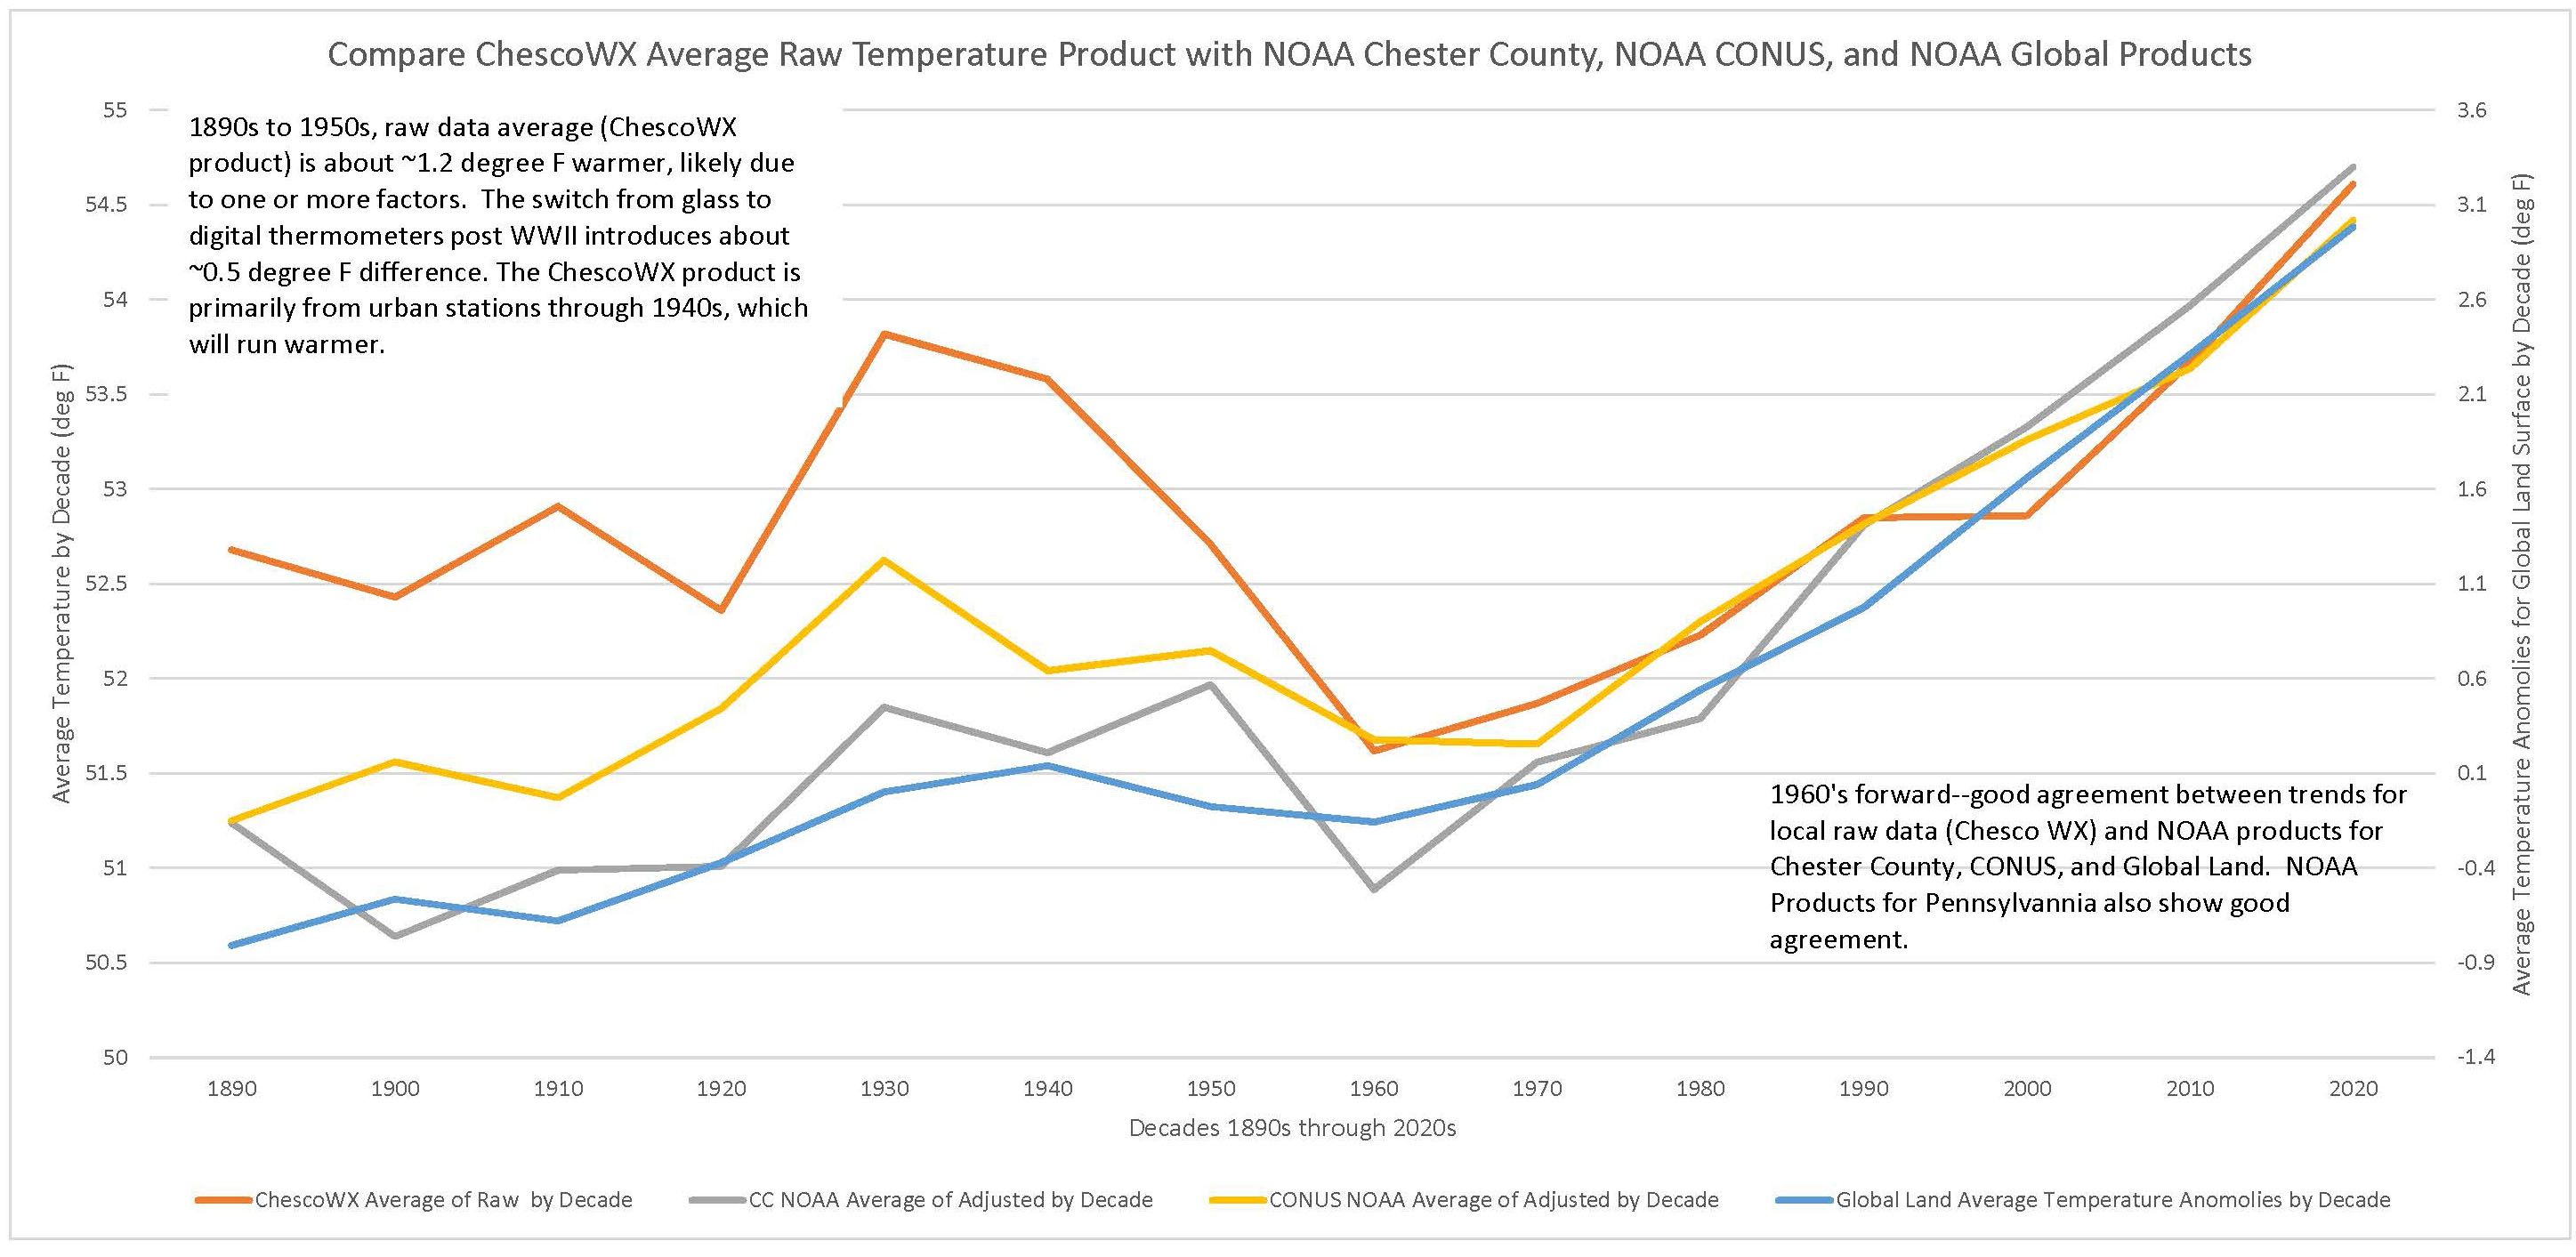
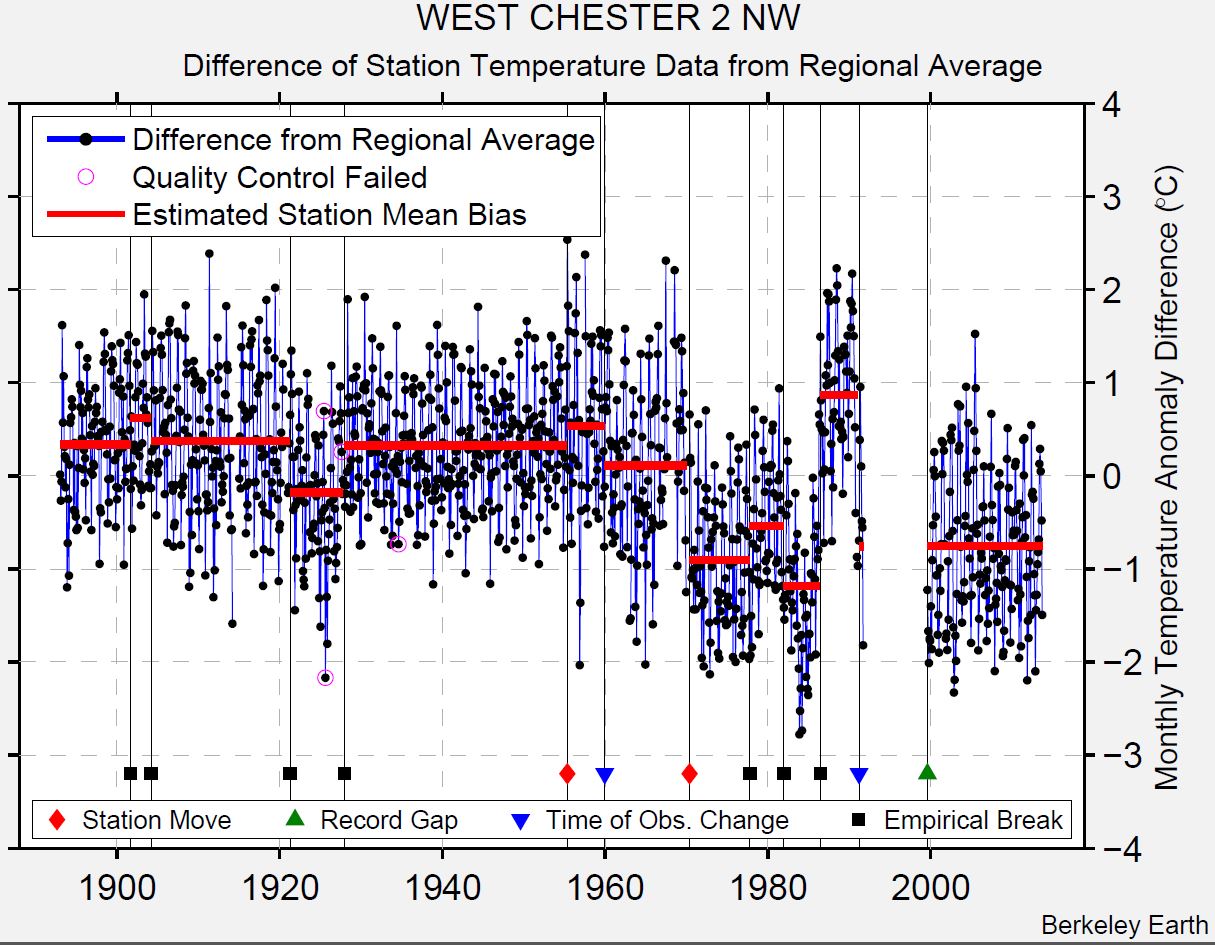
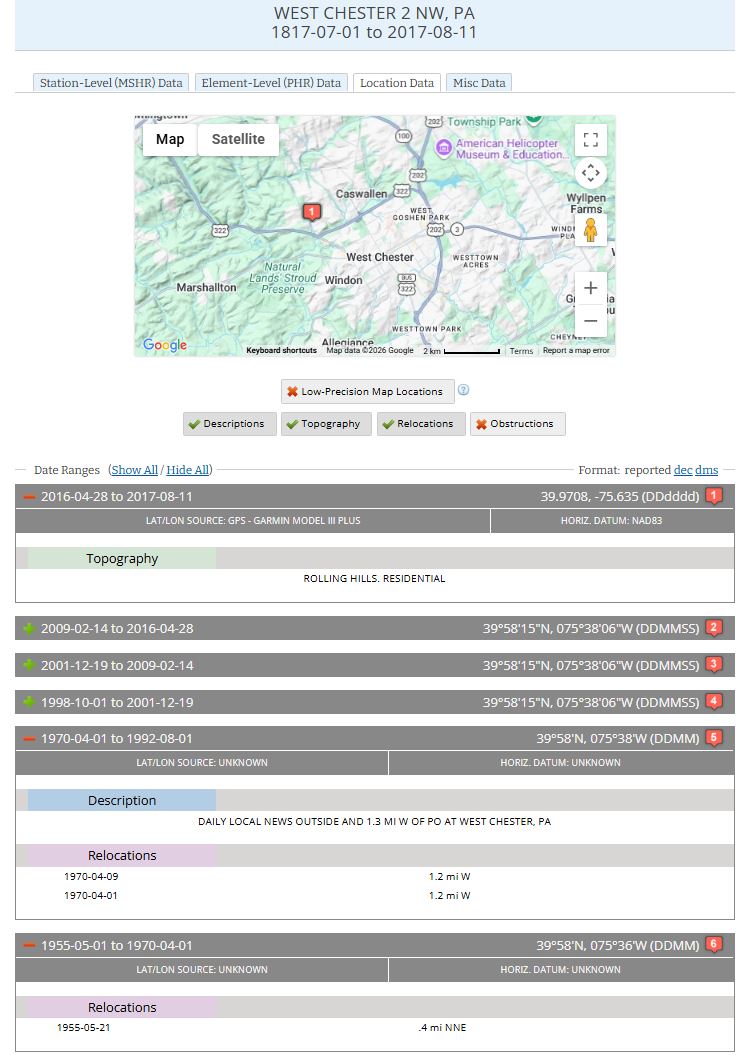
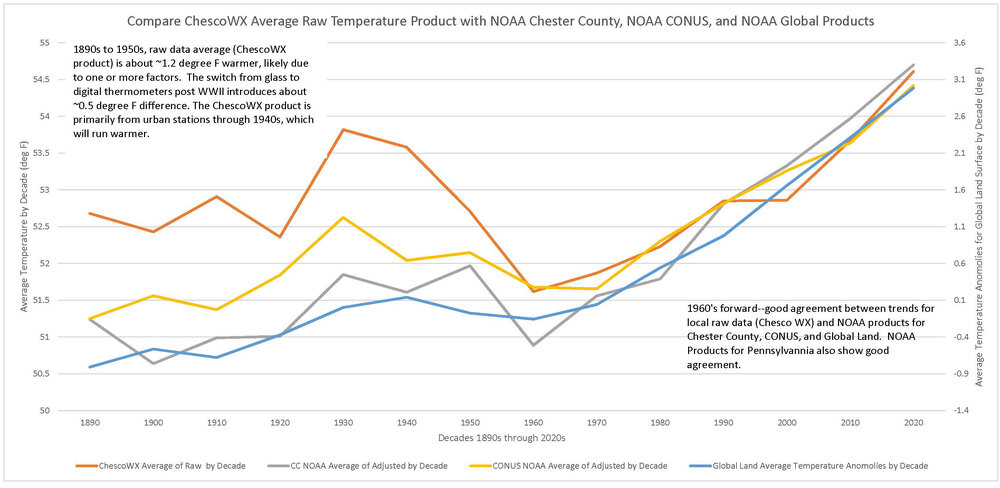
Paul, you have made many claims in the last few comments. These look like strawmen to me, and I have summarized them below. To me, it appears you are making these comments to show that the accepted process of dealing with raw noisy data is flawed, and therefore that published climate trends are based on a flawed process. "86% of breakpoints are undocumented" → implies the algorithm should mostly find documented breaks. It's designed to catch undocumented ones — a high rate is expected, not damning. "Chester County's raw data shows no significant county-wide trend, so warming is manufactured by adjustment" → implies mainstream science predicts a clean, significant trend in every small local raw sample. Nobody claims that — a handful of stations in one county is noisy by nature, which is the whole reason homogenization exists. "The correction is a smooth ramp, not a step, so no single event explains it" → implies a legitimate correction must be one discrete jump. Many small breaks stacked over decades naturally produce a ramp-shaped cumulative correction. "Some stations (Coatesville 2W, Hopewell) got zero adjustment, proving selectivity" → implies adjustments should be applied roughly evenly everywhere. A detector that only flags real breaks and leaves clean stations alone is working correctly, not cherry-picking. "Highs are warming while lows are cooling — that's a contradiction" → implies day/night trends must move together. Diurnal-range divergence is a documented, separately-studied climate phenomenon, not a paradox. Yet, the Chester County raw data is in good agreement with published climate trends, more so when the urban makeup of the pre-1940 station group is taken into account. I suggest looking into the West Chester 2 NW records to document the rest of the breakpoint.
-
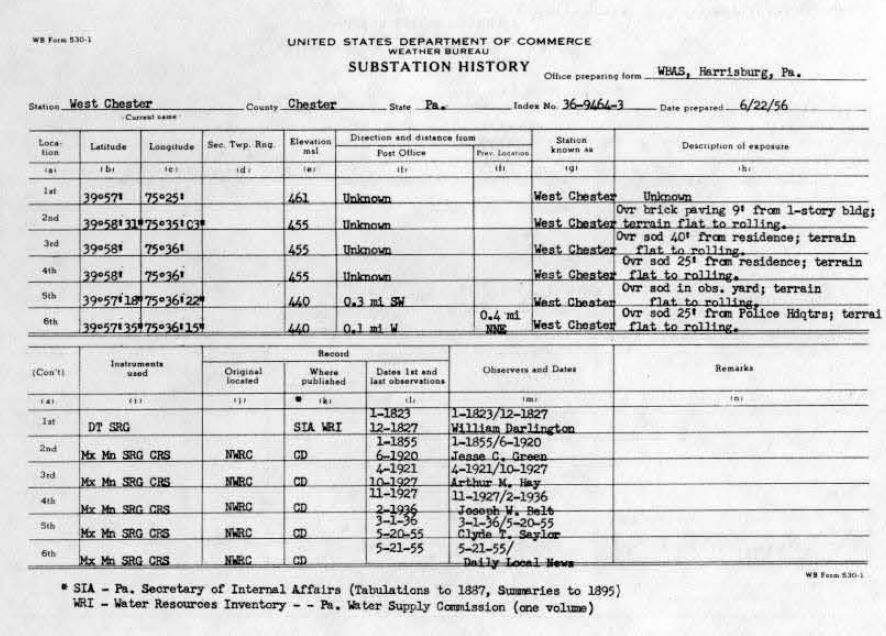
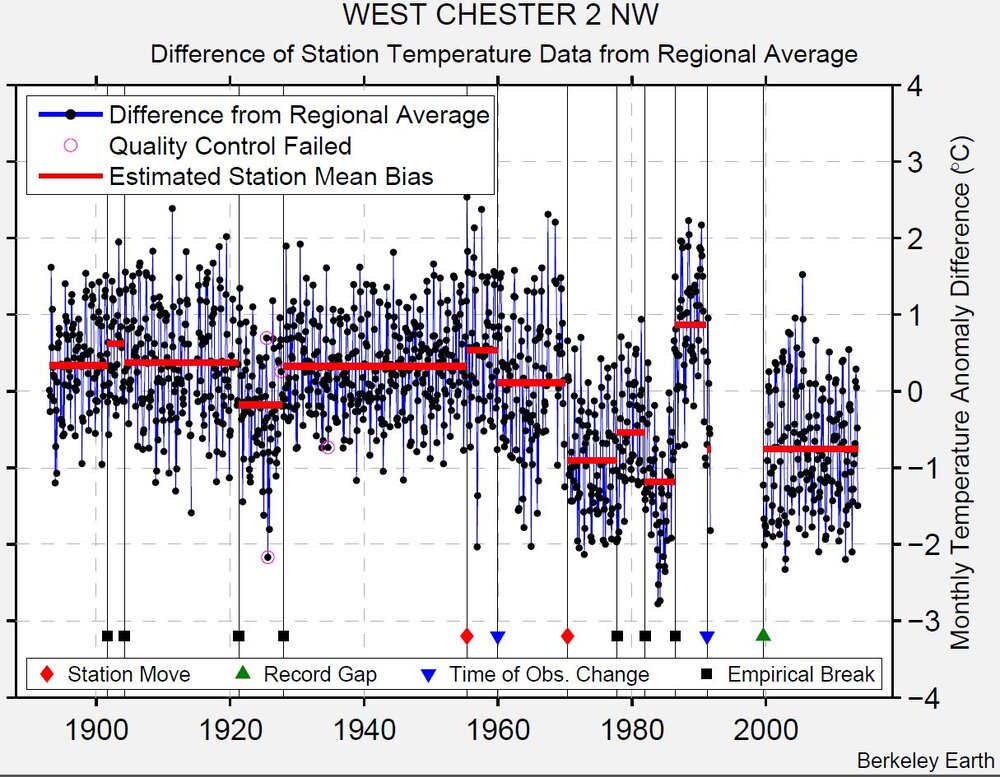
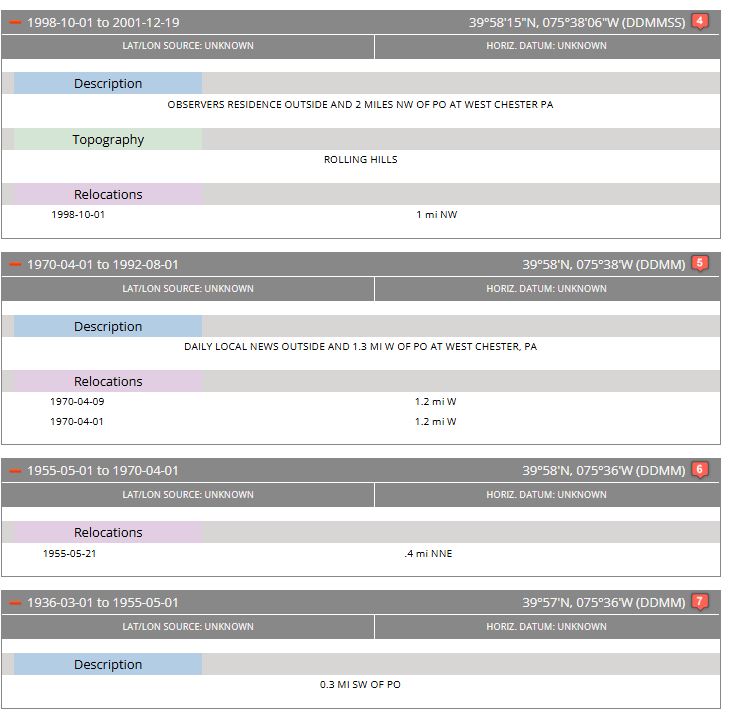
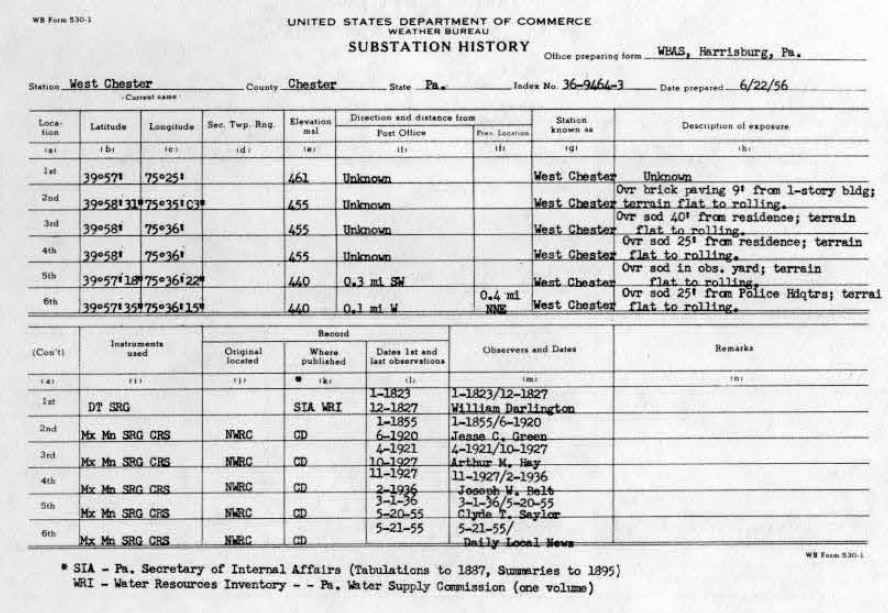
What smooth ramp do you refer to? I just glanced at the breakpoints at BEST for the stations in the table and none of them look like "smooth ramps". Coatesville's breakpoint are fully documented at this point. I have shown you that there is hard documented real world events driving the breakpoints for this station. If you think there is something off about the breakpoints for the other stations, and that the published work of scientists around the world is flawed, then it is on you to do the deep dive on the histories through all available sources and make your case. Don't just wave your hands saying "absolutely no metadata backing, that's an algorithm asserting station changes that are clearly not able to be documented"--without first scouring all source for that documentation. For West Chester, I just took a quick look at the breakpoints at BEST, the 530-1, and HOMR records. About half the breaks are clear just from the 530-1 and HOMR. There are breakpoints at ~1978, ~1982 and ~1988 that don't have explanations yet and may be in the paper forms, or other records. Its the Daily Local--there are going to be a lot of records about where they were located. Have AI write a tool to download all the paper forms from batch "AA92589" or just do it manually around those dates. Anyway, it is on you to prove there is no documentation for these moves, you cant just say there aren't any without looking at the available documentation first.
-
I asked Gemini these three questions, italicized for clarity. You could ask any AI the same set of questions, and get the same general answers. Q: For collecting good-quality long term climate temperature data, 100 years+, describe a hypothetical location in a temperate climate. Short answer. A: A ideal hypothetical location in a temperate climate for a 100-year climate station is an isolated, protected rural valley plateau. Q: If you took the station just described, and after 100 years of data, moved it into an urban area, what would happen? Short answer. Describe the reverse case as well, where the station begins in an urban area. A: Moving a Rural Station to an Urban Area: Moving a 100-year rural station into a city causes an artificial temperature spike. A: The Reverse: Moving an Urban Station to a Rural Area: Moving a station from a city out to a rural area causes an artificial temperature drop. Q: How would you correct for the station move? A: To correct for a station move, climate scientists use a statistical process called homogenization. Here is how the correction works: Create a Reference Record: Scientists select a group of nearby, undisturbed "neighboring" stations that experienced the same regional weather but did not move. Identify the Breakpoint: They calculate the average temperature difference between the target station and the neighbor group. A sudden, permanent shift in this difference confirms the exact date of the move. Calculate the Offset: Scientists compare the data from a window of years immediately before the move to a window of years after the move against the stable neighbors to determine the exact bias (e.g., the city move made it 1.2°C warmer). Adjust the Historical Data: They apply that 1.2°C offset to the entire block of data prior to the move, lifting (or lowering) the old record so it seamlessly aligns with the new location's environment.
-
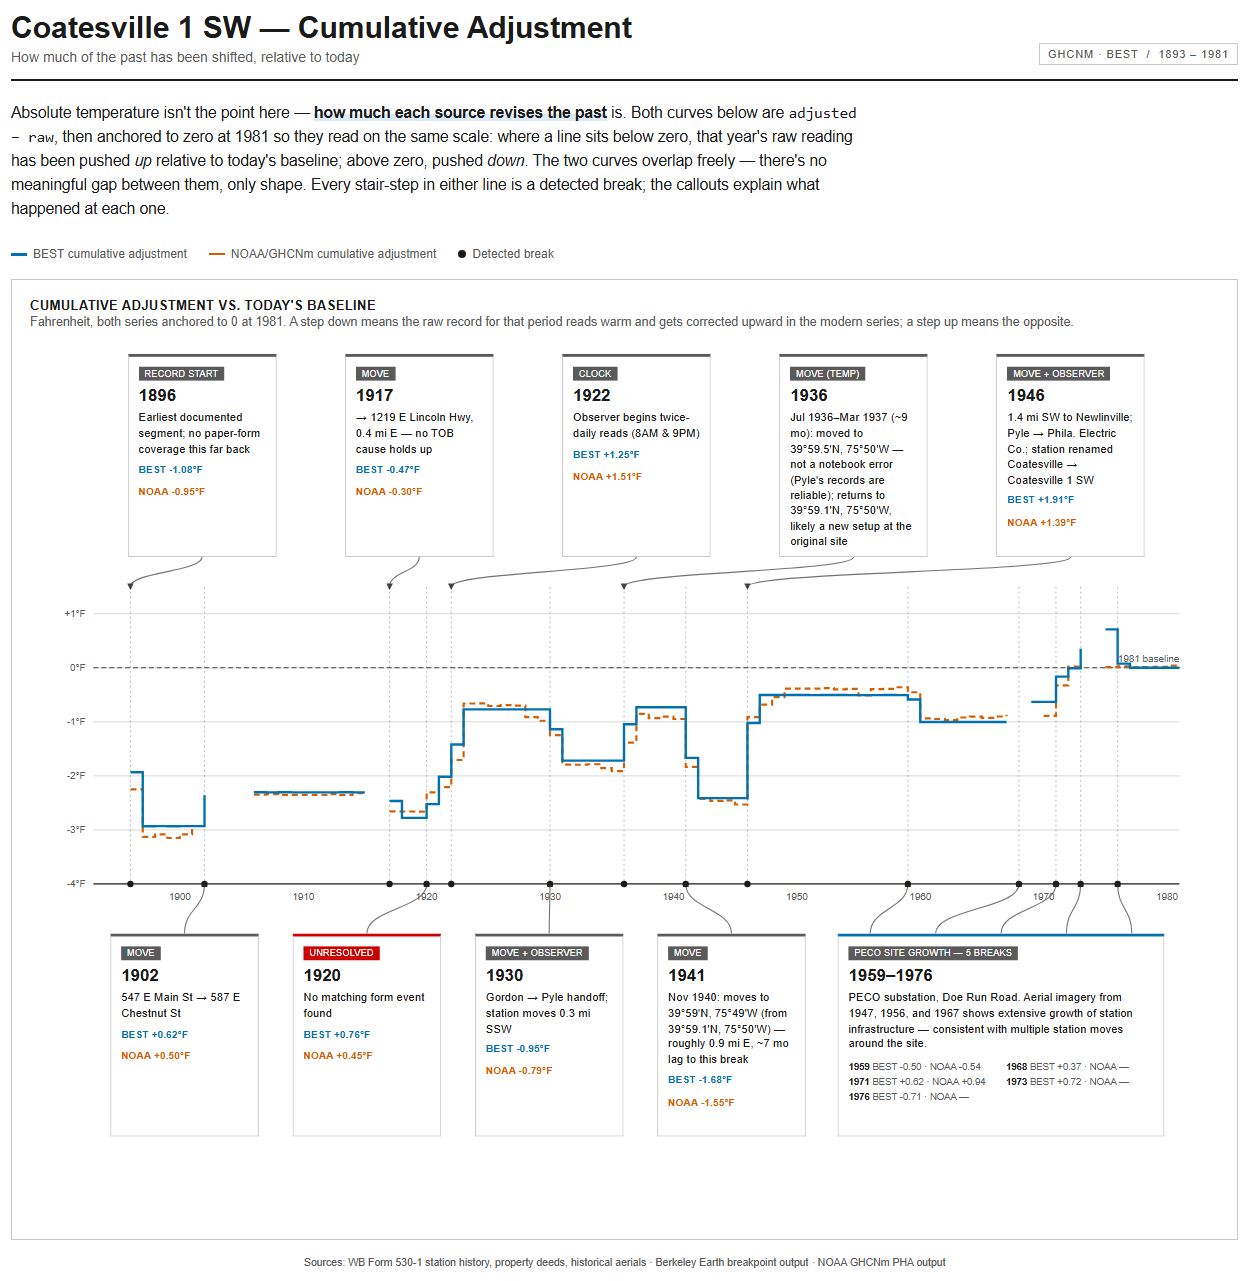
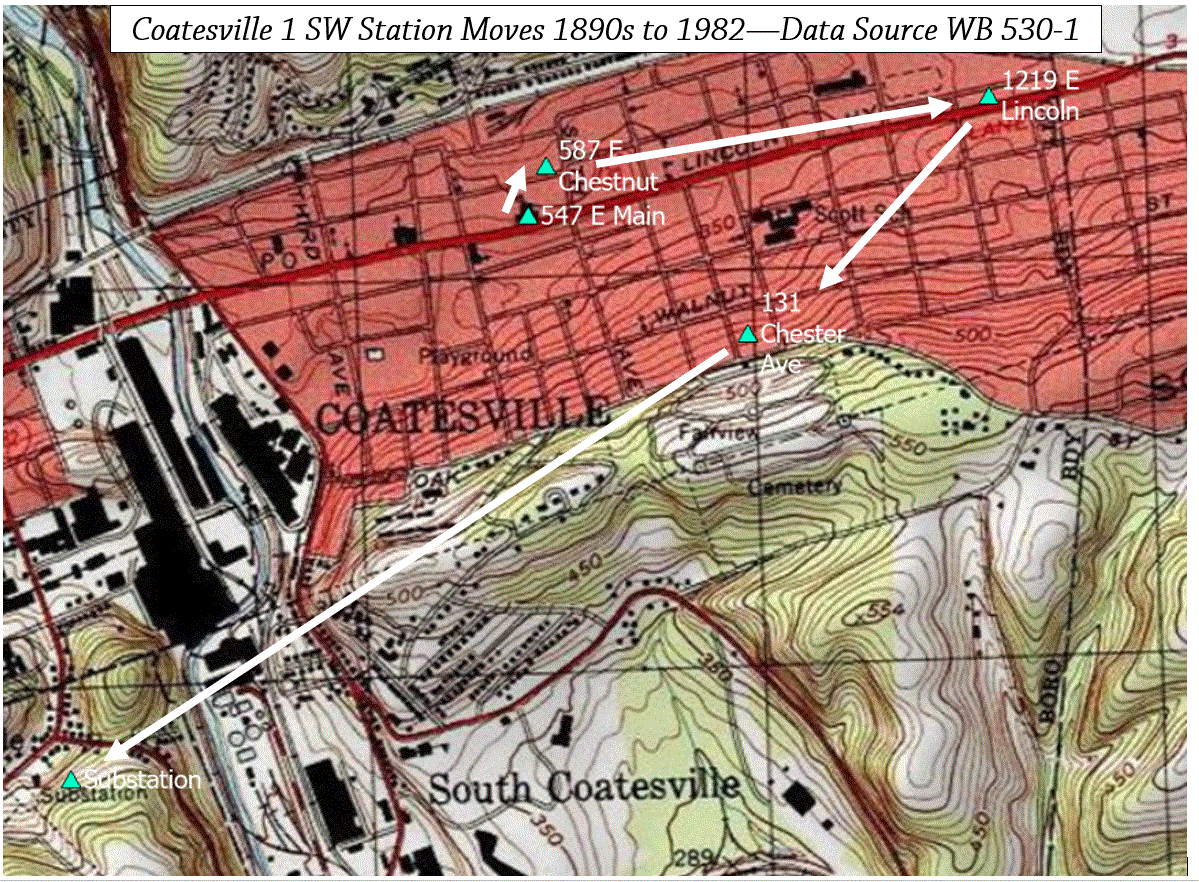
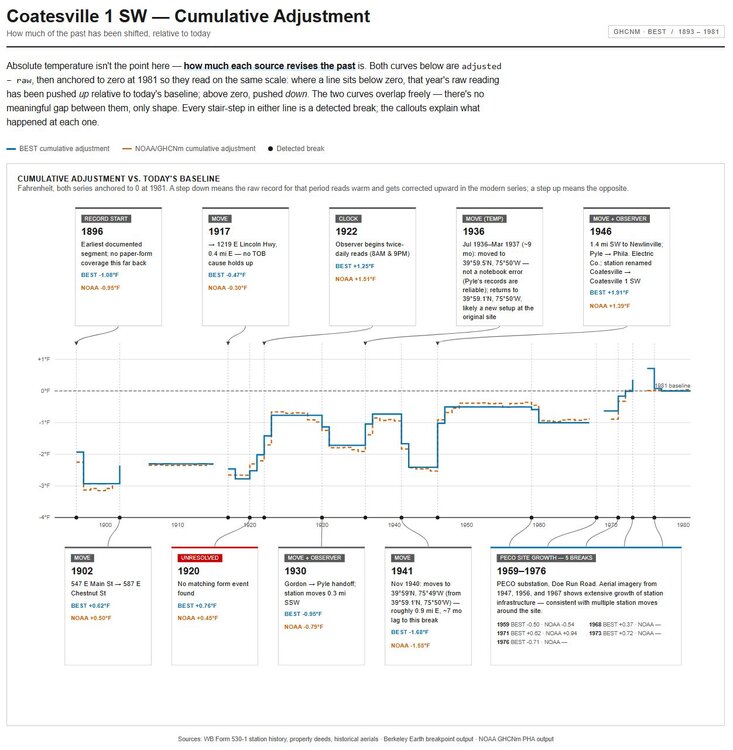
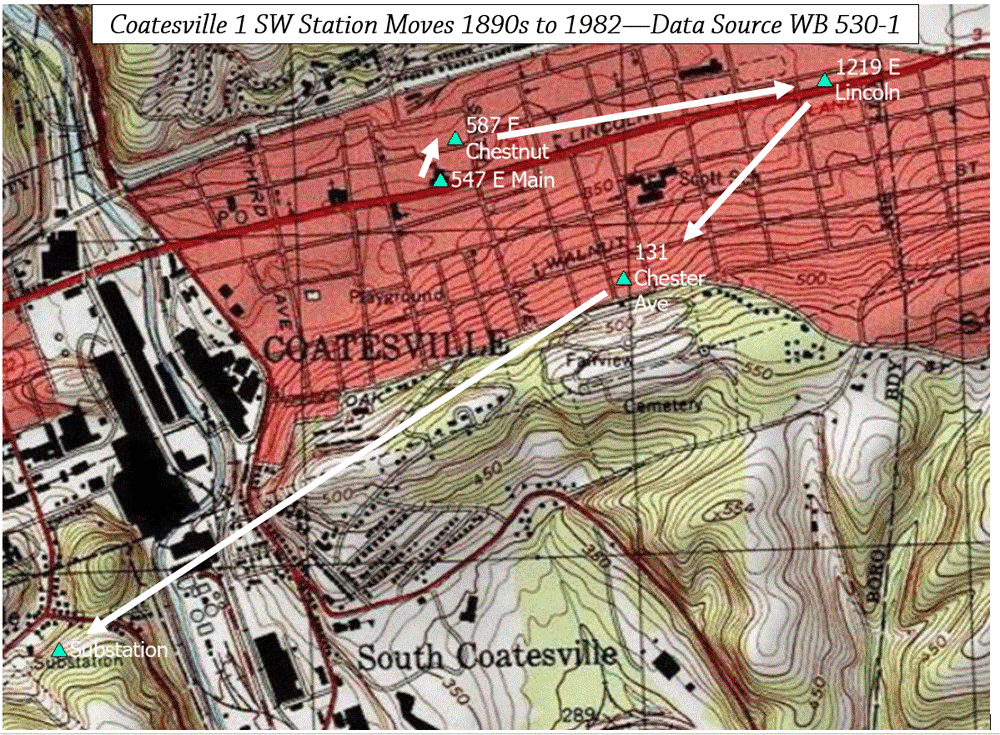
Paul, I don't know if you saw this, but the detected breaks for Coatesville line up very well with documented results. I made a figure, attached. HOMR has errors, you must refer to the 530-1, and even that has an error in Gordon's address which was resolved by looking at property records. You will also need to read through every monthly report to catch changes in coords or observation times--I did. Somewhere in ~1928 Gordon notes that he was ill and used chart recorder for a while--I ignored that. If you don't supply all of this information to Claude, you will not get a useful result. Don't expect the breakpoints to coincide exactly. It may take a month or more for the break to be visible to the math. If you look at the map--its 100% clear and obvious that 1 SW moved from a hot location to progressively cooler ones. It also clear you have not provided this information to the AI.
-
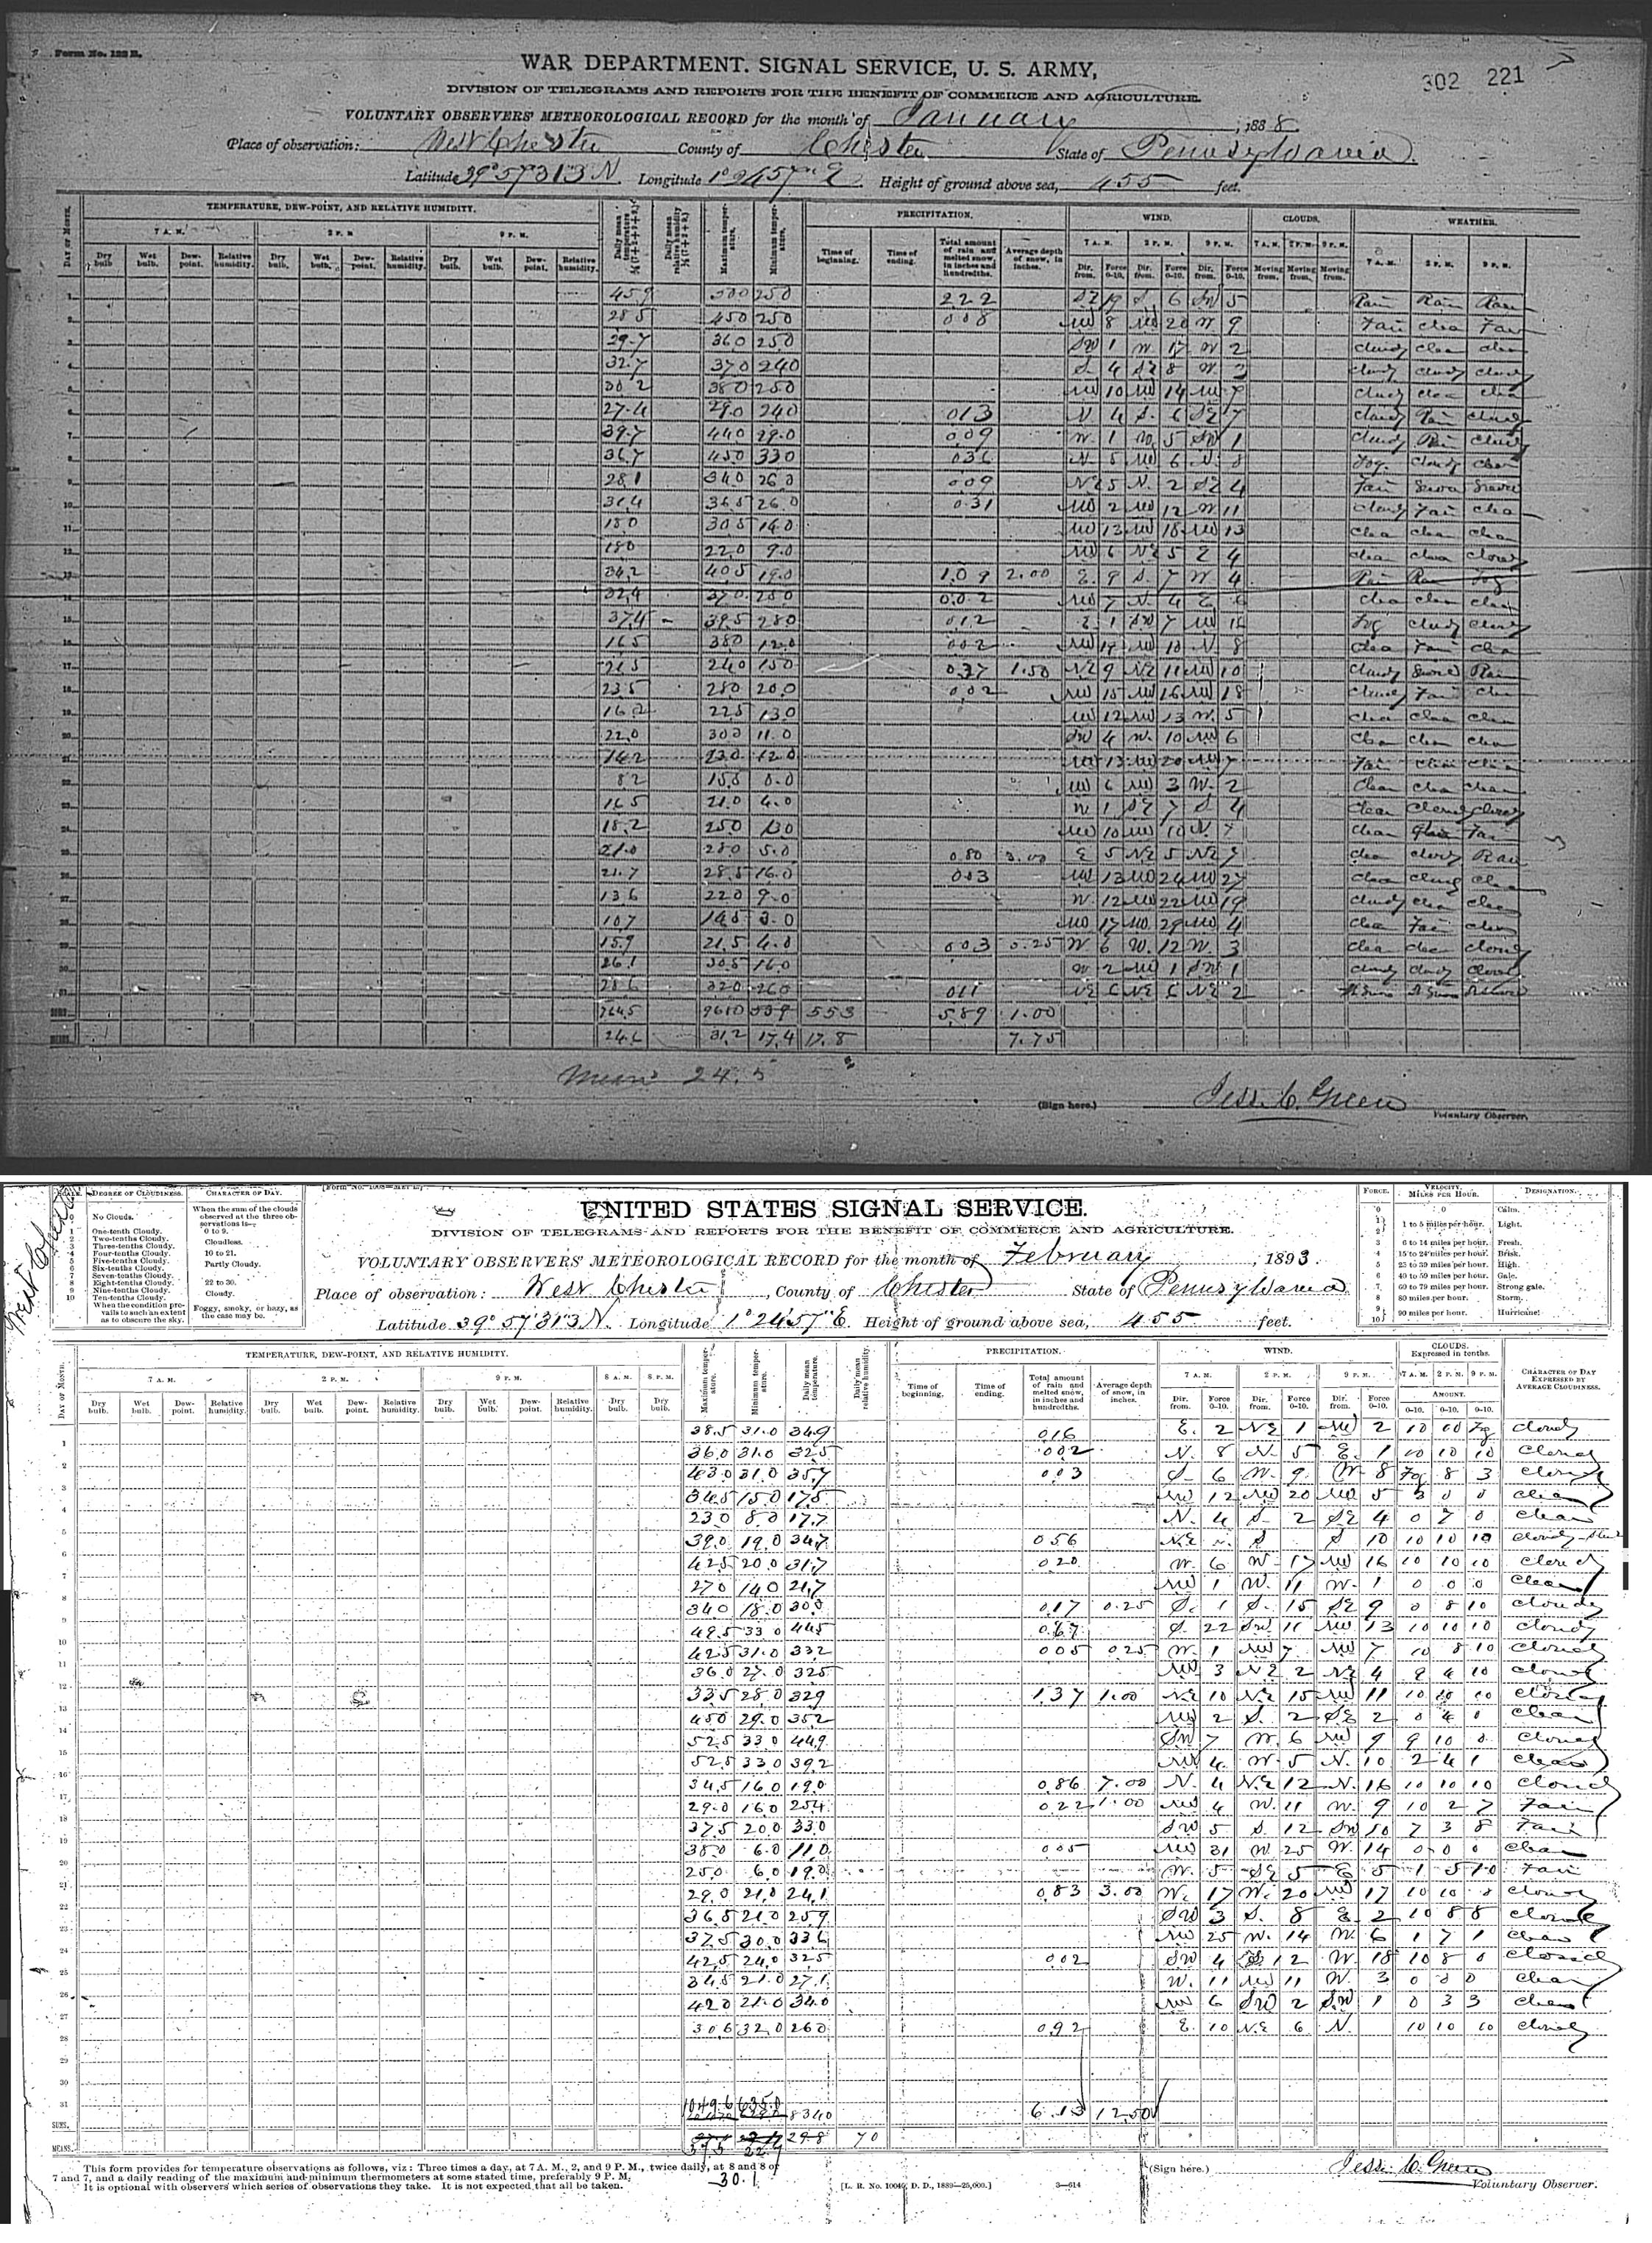
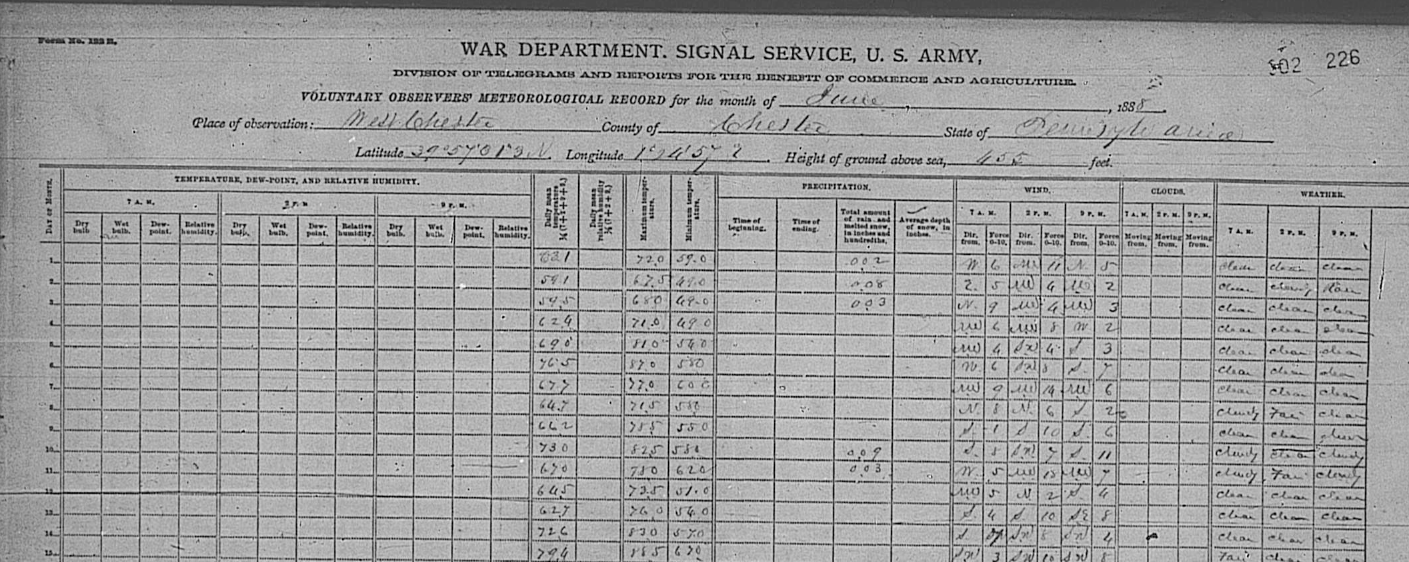
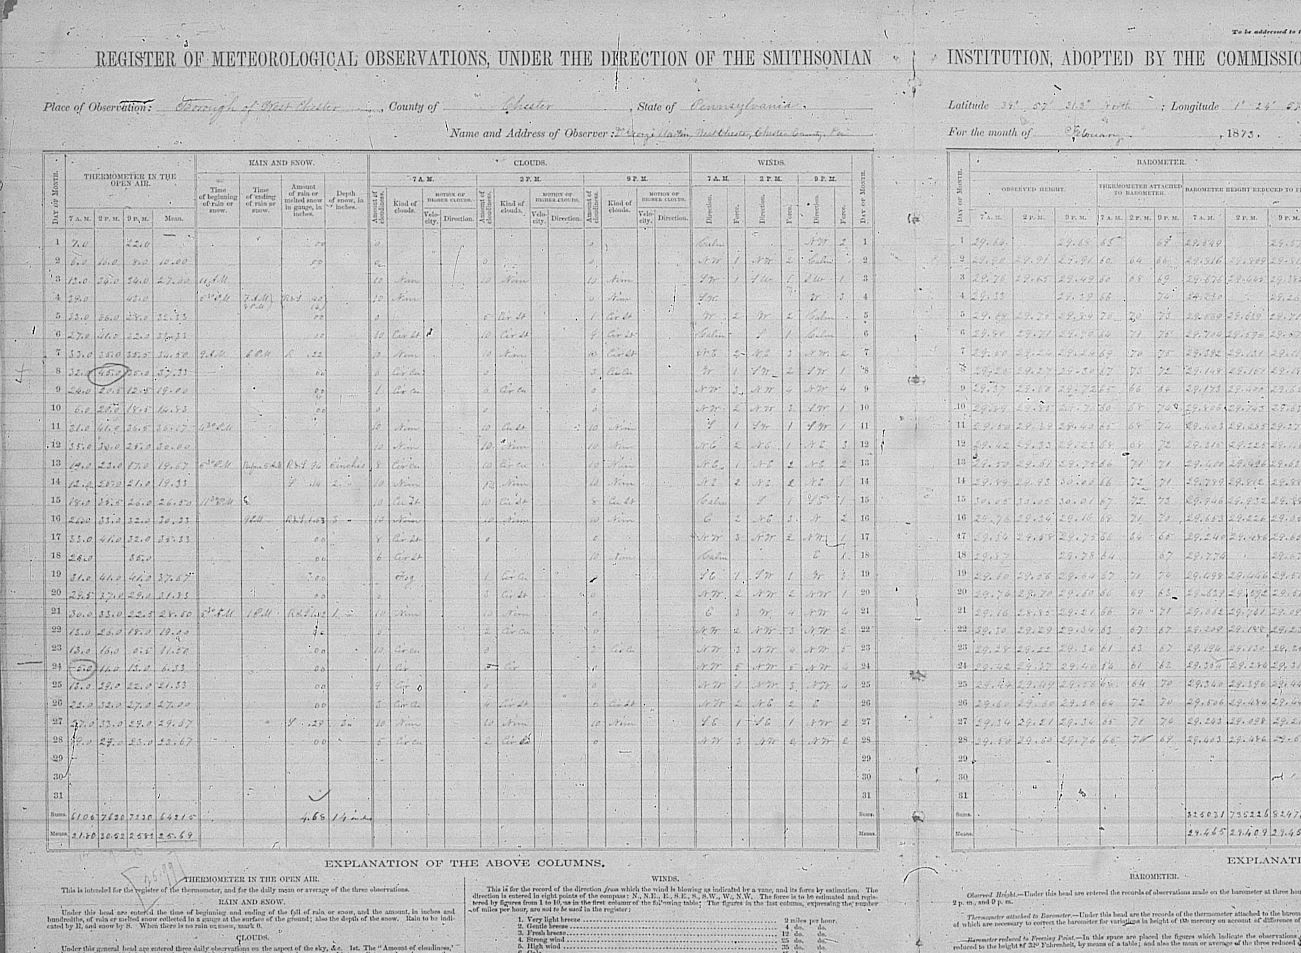
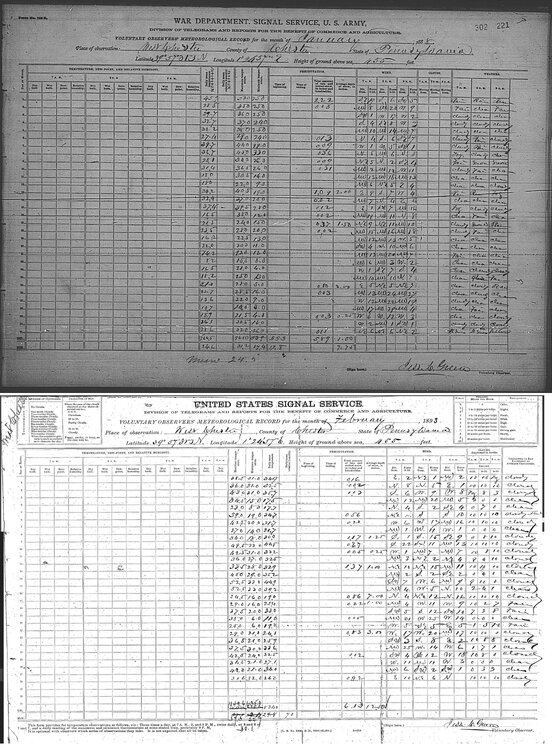
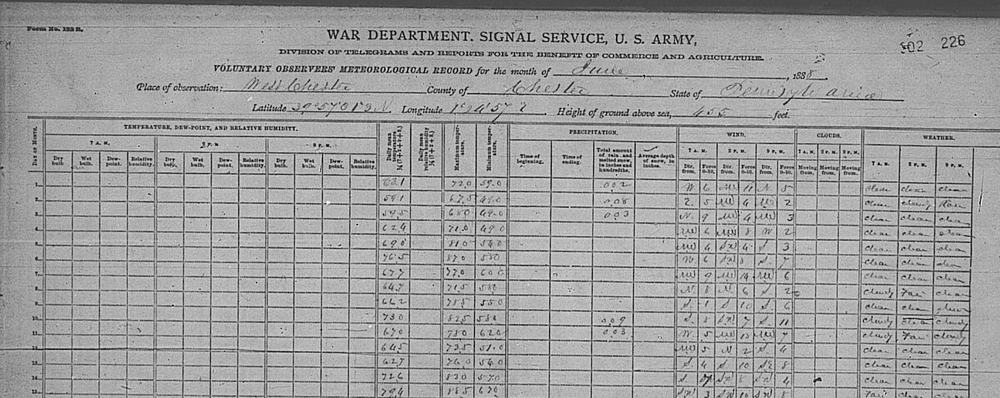
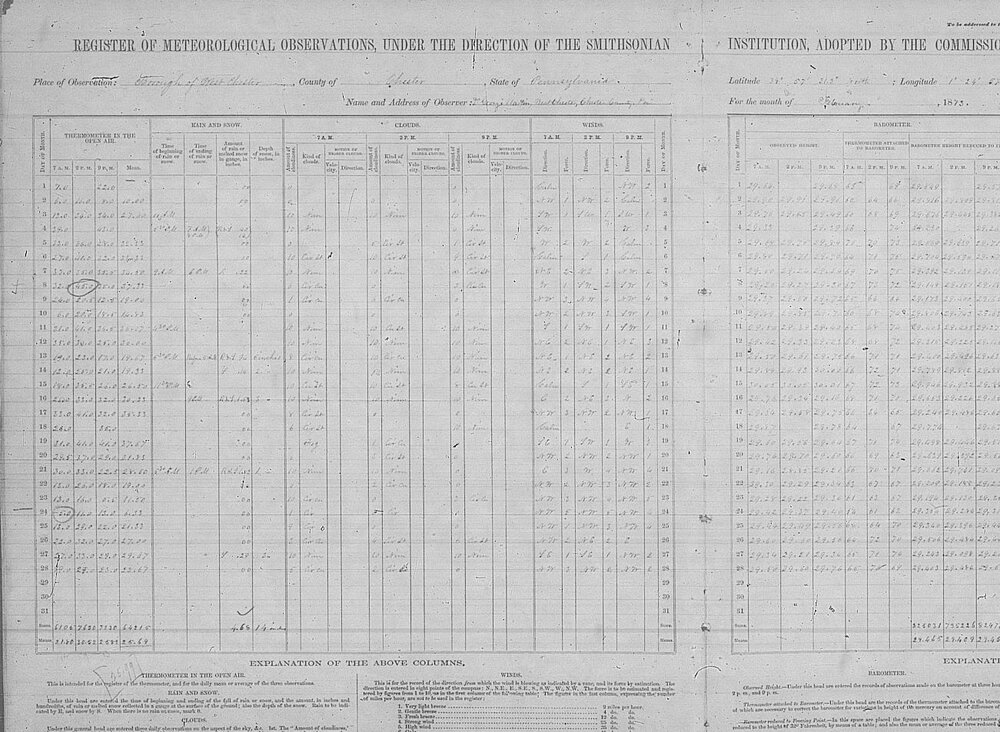
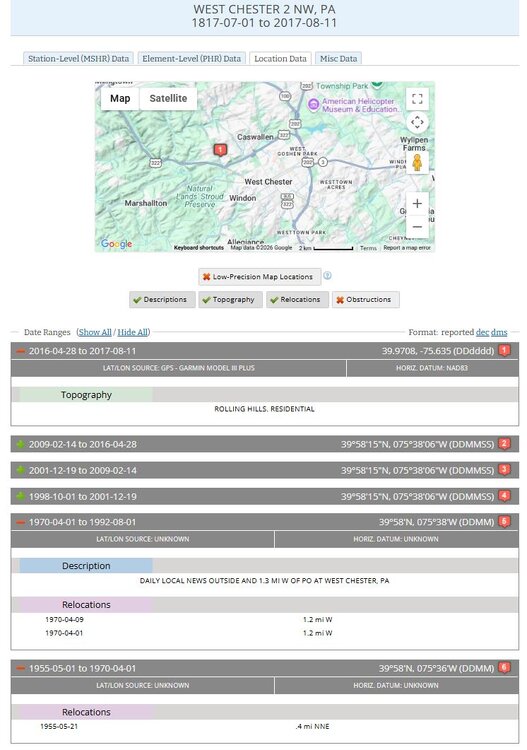
Paul, the pre-1893 paper records for West Chester 2NW, COOP ID 369464, were transcribed in a recently-finished project by Purdue. https://mrcc.purdue.edu/FORTS https://mrcc.purdue.edu/gismaps/cdmp This is daily data from the same station and same line of observers as appear at the NCEI site in 1893 and forward. Images attached of forms from 1888 and 1893. You may find pre 1893 data here https://mrcc.purdue.edu/FORTS/download and the paper forms for pre 1893 here https://www.ncei.noaa.gov/access/search/publications/forts-publication/ . Post 1892 data are at the usual locations. Images of a 1888 paper form from the FORTS site and an 1893 paper form from NCEI for COOP ID 369464 below. Same observer, same form, same raw data stream for West Chester 2NW that you have been using, just further back in TIME.
-
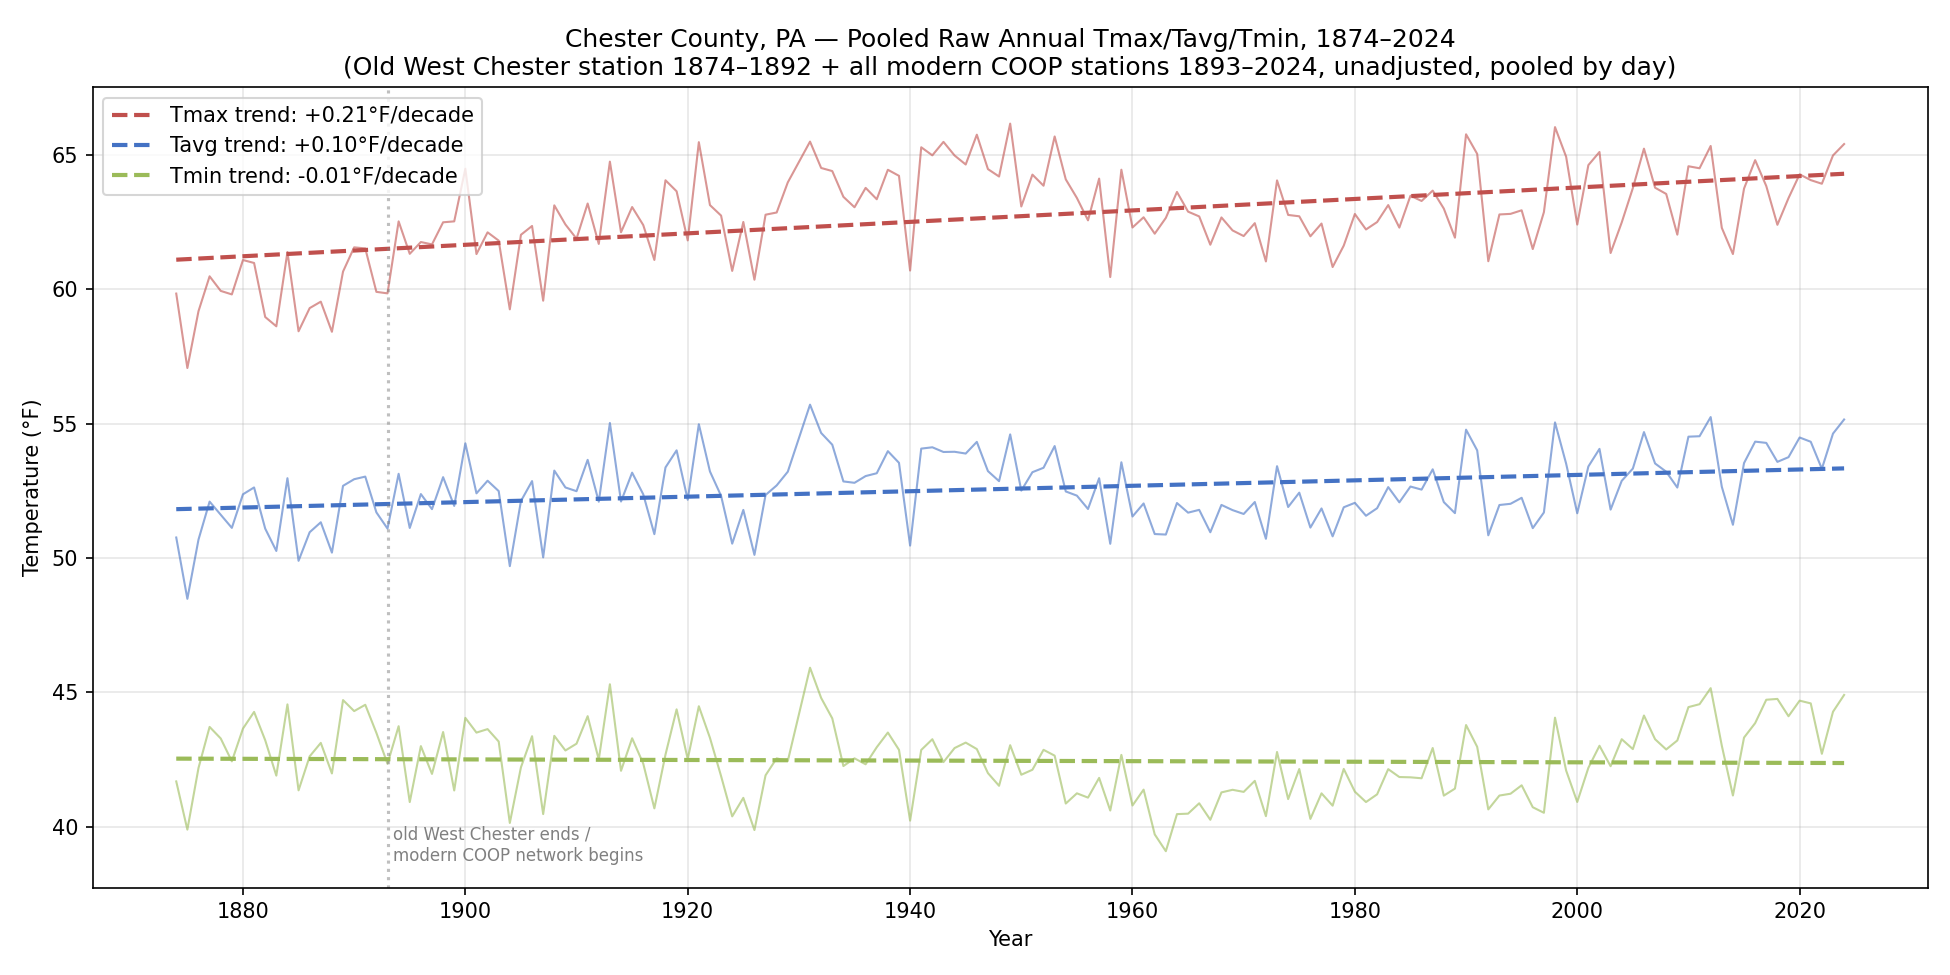
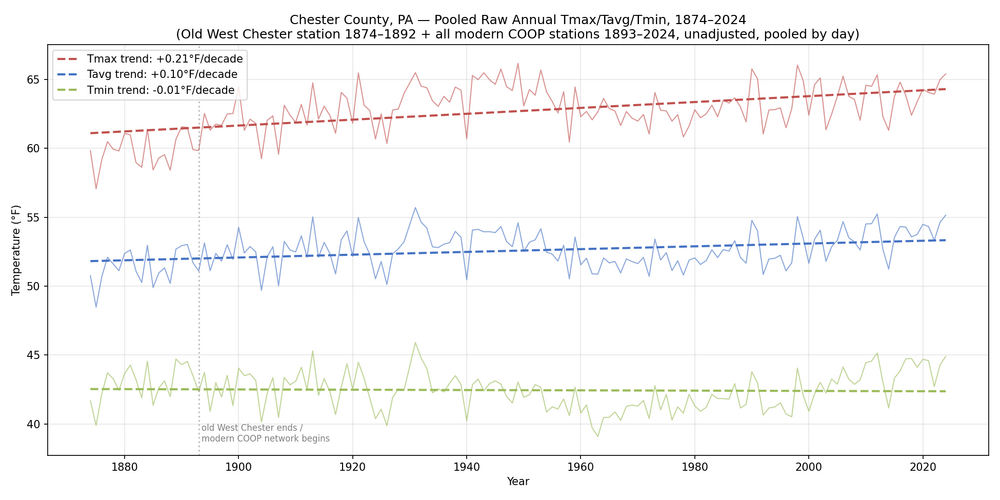
If we add this 1874 to 1893 raw data onto a time series consisting of raw Chester County COOP data, pooled by day for days having both a Tmin and Tmax raw data reading, we see some positive slopes. Not that we should be working with raw data to develop climate trends. Paul, observer records are here, so you can verify the raw data source https://www.ncei.noaa.gov/access/search/publications/forts-publication/?p=1
-
Paul, it's raw data. Here is the written record for June 1888, matches the csv 100% .
-
Yes, there is earlier data, but its not Tmin and Tmax, its 7 AM, 1 PM, and 9 PM. csv attached. PA_West_Chester.metadata.csv PA_West_Chester.data.csv
-
Interestingly, there is pre-1894 data available. From 1873 forward there is daily temperature. I am somewhat awed by the level of scientific competency shown in these (and other) old records. Observer is hard to read, but not Jesse Green. Almost certainly there are usable archives at West Chester that would provide more information, including photos. Tracking this stuff down and building a story line would be a perfect cross-disciplinary project for a college intern. Would you mind if I had Claude run your method above on Chester County and nearby stations? The output would be a complete human-readable timeline for how reference stations are used to arrive at adjusted records for these stations--something the OP has requested numerous times. As I understand it the actual NCEI process involves matrix math, too complex for easy communication if you ask me; a manual method using your approach will be easy for anyone to understand.
-
If I understand what you are showing, the two pairs find a shift of -1.67 and -1.44 respectively for West Chester 2NW's April 1970's move. Averaging 12 station to station pairs before the move, and 16 after. It would be straightforward to identify the non-move segments of local stations, and use those to test the others iteratively, building up a timeline for all stations. Assuming all of the station moves are at HOMR or on the 530-1s, that would still leave the TOB changes. Coatesville 1 SW switched from 8 PM to 8 AM & 8 PM at the end of October 1921, effectively eliminating the double counting of daily highs, shifting the time series down by 1.4 deg F.
-
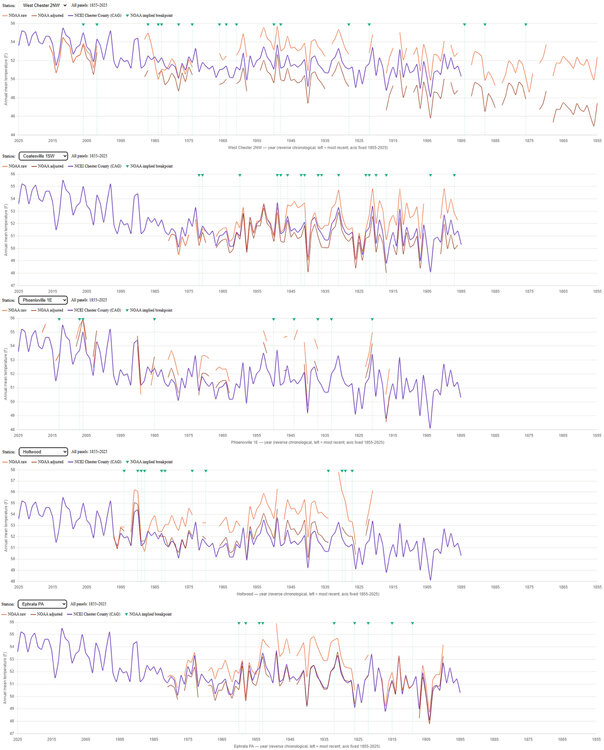
Paul, using other stations as references will only work if those stations are reference grade themselves. If there are station moves or other major changes, they are no longer "references". The stations you have chosen as "references" show 14 detected breaks in the 1941 to 1975 windows alone. I was working on this graph anyway, see below. The fact that known good references are so scarce is a major motivation for developing homogenization processes or alternatives like BEST's scalpel. These methods presume the raw data is replete with breaks and work to overcome this challenge. Your approach does not. The September 1921 TOB for Coatesville shows up clearly on the kinds of comparisons seen above.
-
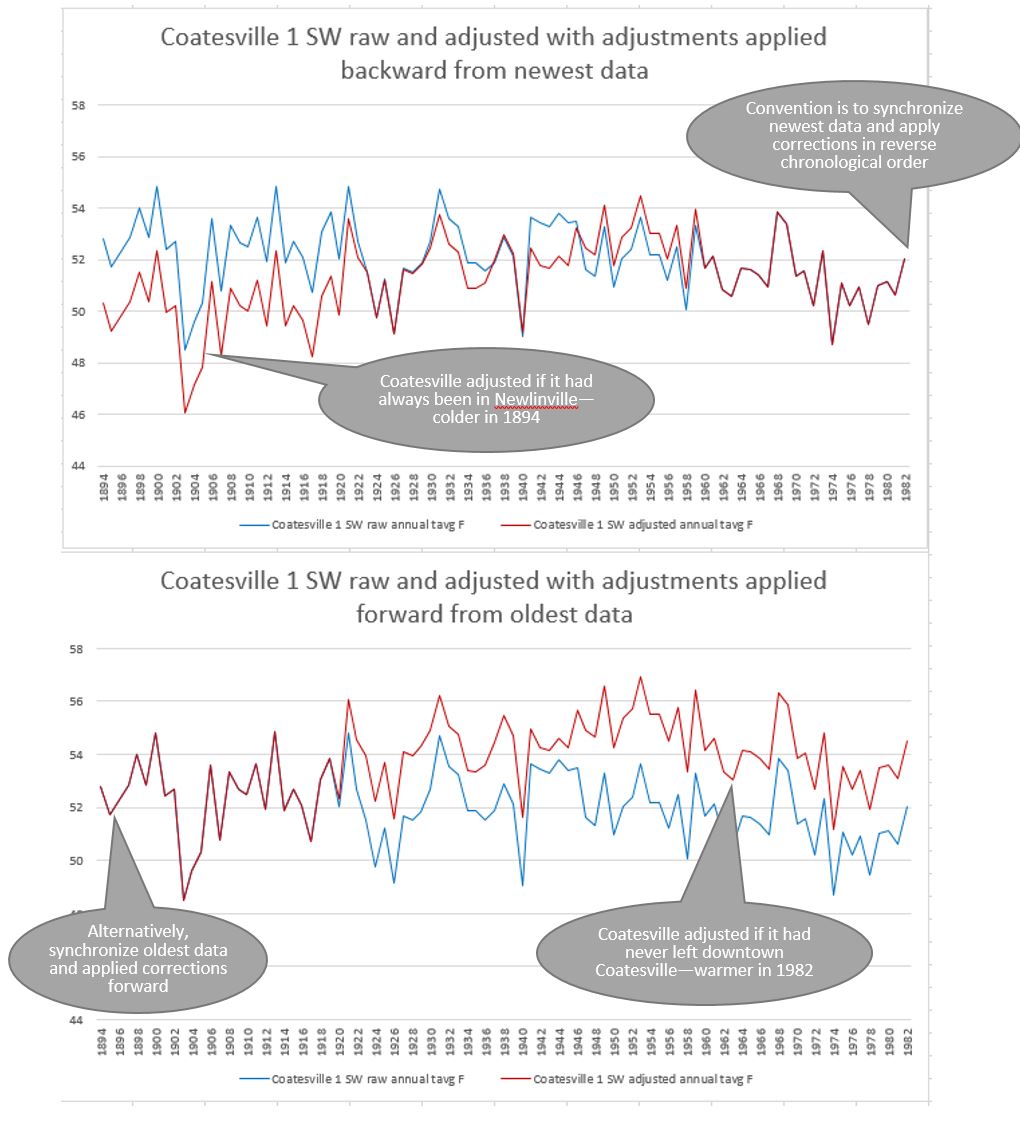
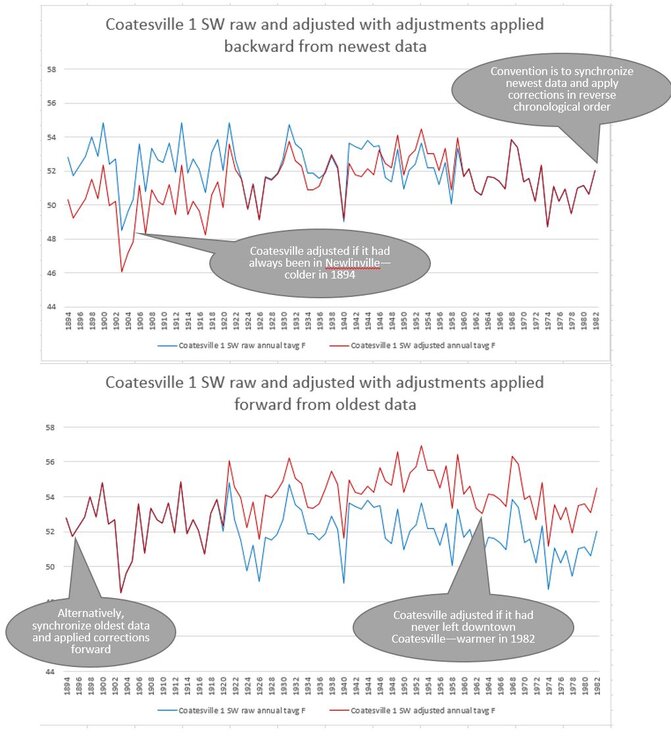
Here is a graphic I hope illustrates that the goal of homogenization is not to create a new absolute temperature series for a given location, but to extract change over time information. With Coatesville 1 SW, because it moved to progressively cooler locations (break points finds these shifts), it is necessary to correct for those moves. Convention is to apply the corrections from most recent raw data backwards, but it is just as valid to apply them from oldest forward. Convention results in a repaired series that was always in its final location, and applying corrections from oldest forward results in a station that never left its first location.
-
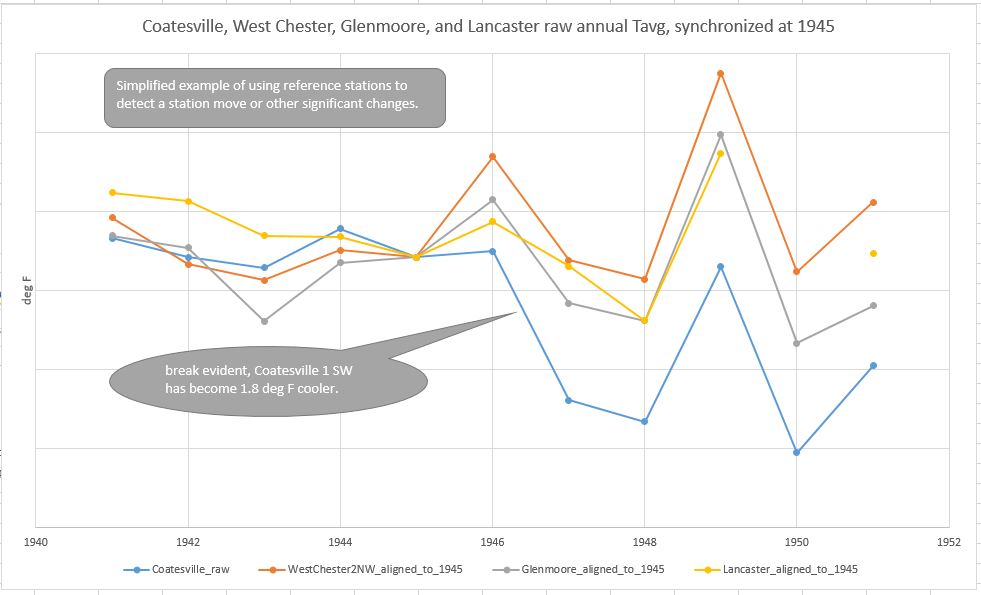
Chesco, you are quite welcome. Seems like an important step towards understanding the data adjustments done by NCEI and BEST, and the topic of this forum.. The next step is to look at how break points are identified using reference stations. Chubbs has a graph above showing the 1946 break resulting from 1 SW's move to Newlinville, and here is similar graph also using raw data. What I have done is synchronize the temperature series at 1945, and removed the absolute temperature values on the Y-axis--because the absolute values don't matter if we are looking for climate trends. This shows just the 1946 break, and shows the RESULT/IMPACT the station move made on Tavg. Now, imagine repeating this process with a large set of reference stations across the whole history of 1 SW to create a time line of breaks and the deg F size of the shift at each break. That is what is done. With the new information from the breaks, we can adjust the station data by reversing the IMPACT of the moves. With the repaired data set, we can then identify baselines and departures from those baselines--anomalies. Absolute values don't matter, the change over time does. Also, by convention the adjustments are made with the end of the raw data series aligned to the same temperature as the end of the adjusted data series. This may lead to confusion when the raw and the adjusted data are viewed in the same graph, because it looks like one series has been "chilled" or "warmed" with respect to the other. The reality is that the raw data for Coatesville is actually several distinct stations, and the adjusted data has been upgraded to be a lot closer to what the raw data would have looked like if the station never moved. Trying to assign absolute temperatures to either time series is not useful when the information we want is change over time. With that in mind, would you clarify what you mean by "there were no unusual temperature changes at Coatesville 1SW that were not statistically aligned with the nearby stations within 30 miles of that point" & "This supports the fact that there was no need for any adjustments to the raw data at all!"?
-
The 1946 station move looks like a train switching from one track to another. Nice. Here is a view of surface temperatures from NASA's ECOSTRESS instrument on the space station. Coatesville 1 SW generally moves progressively from hotter to colder microclimates.