

griteater
-
Posts
9,581 -
Joined
Content Type
Profiles
Blogs
Forums
American Weather
Media Demo
Store
Gallery
Posts posted by griteater
-
-
23 hours ago, 40/70 Benchmark said:
I missed his outlook...
Don't get me wrong, I love his stuff, but I wouldn't give anyone credit for "nailing" January 11 days in.
I believe he is referring to the ONI prediction contest from early September: https://www.americanwx.com/bb/topic/59534-what-strength-will-the-el-niño-peak-at-in-2023-2024/?do=findComment&comment=6992657
For Oct/Nov/Dec/Jan, I had: 1.8/2.0/2.0/1.9, Max tri-monthly in NDJ of 1.97
Actual for those months is: 1.72/2.02/2.07/?
In reality, my thoughts on the peak have waffled here and there. After the flat-lining in September, I didn't think it would get quite as warm as it has
-
 2
2
-
-
9 hours ago, raindancewx said:
So here is a look at the winter so far. This is 42 days in (6 of 13 weeks). It's not really cold anywhere, but as I posted recently, I thought parts of the SE and SW might be a tiny bit below average.

Now look, I was way too cold nationally for December. Like, horrifically so. If you go back to my posts, I recognized this pretty early in December.
But I want you all to look at what Ray had after I show what I had. Look at how specifically wrong I was, and then look at where he was wrong. This is why I say he copies me. It's literally the same fucking errors with a different blend. Whether I do a good job or not, the same spatial patterns in the errors show up every year in his stuff. Seriously, it's almost impossible to be this similarly wrong to what I had in a given month without at least internalizing the ideas. If you had just picked 1997 / 2015 as an analog, it'd be way closer than what I had as an example. This is my blend minus 2023, and then I just went to Ray's site to look at his stuff, and did his blend minus 2023. I still haven't read his forecast I just searched for the word "December" and went down to the actual five words of forecast material. My favorite part is as late as Nov 30 he has a post that says "December appears on track" before missing by ~8 degrees for the entire country.
Me - Oct 10

Ray - Nov 11 - https://easternmassweather.blogspot.com/2023/11/winter-23-24-will-be-lesson-in.html

It's the same fucking thing....every year. Again, it's nearly impossible to come up with errors as specific and large as what I had without internalizing and copying the idea. The joke is by mid-month it's actually pretty easy to see how things are going to go. If you look at January, its also fairly similar to what I have, but it looks like there are at least meaningful actual differences.
Your attacks on others are just pathetic, and you should be suspended for this kind of crap, and you've been doing it for years...not to mention the language you use that no one in this thread uses but you. On top of all that, you are accusing someone of something that isn't true. I'd like to see you do that to his face. I hope you are smart enough to realize that if you are making a seasonal forecast based off Strong El Nino and the PDO that there is a pretty small list of years to consider, so of course there are going to be similar ideas in forecasts. You need to be worrying about your own self and your own forecasts and quit attacking others.
-
14
-
 1
1
-
-
1 hour ago, psuhoffman said:
Since I know how some react to any non rainbow and unicorns analytical statement I make let me be clear I am very optimistic we will be fine. This is just speculative.
The old gefs looks didn’t bother me too much. Yea I didn’t love anything looking that way but I was 90% sure it was out to lunch.
This though…is slightly and I mean only slightly troubling.

Look at the pac pattern the last week of Jan. 1 should produce a trough at 2! But it’s not. That’s been consistent on the euro for a while. We get the pacific we want but…
I think that’s wrong too. And yea I know by Feb 7 it starts showing a trough. But it keeps pushing that back. Not the pacific but the downstream effects. Not much blue anywhere on that map though outside the Nino n pac low.
Yeah I've been speculating in my head (dangerous) that this upcoming blocking period mid-late Jan may be the best part of the winter. I have concerns that when the MJO swings back around by early Feb that it will combine with +AAM and overcharge the Pac jet again and you get that sort of east-based nino look like the weeklies are showing there. That's a long ways off, but been pondering that. I think this -NAO episode mid-Jan is going to be a good one though.
-
5
-
-
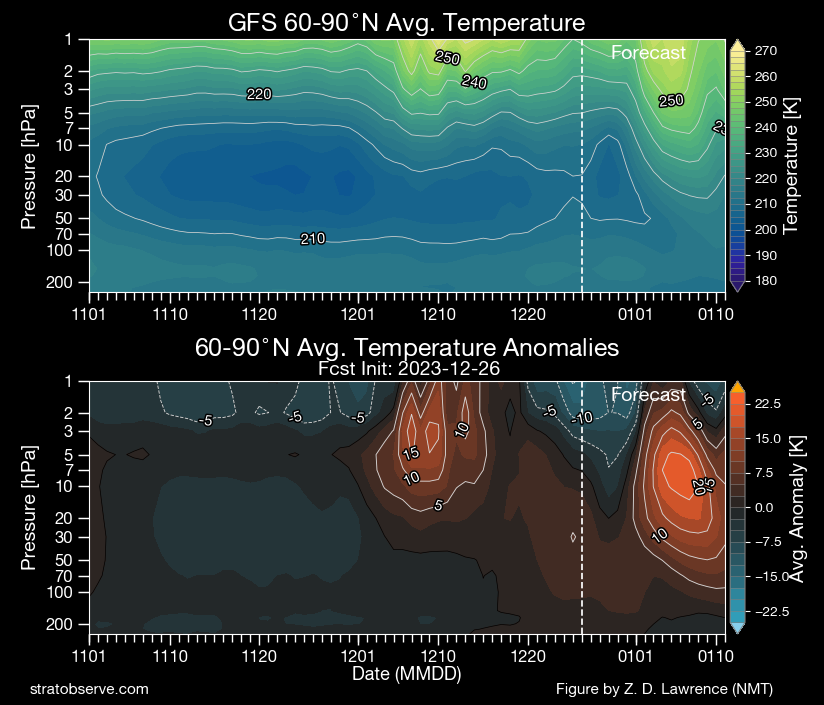
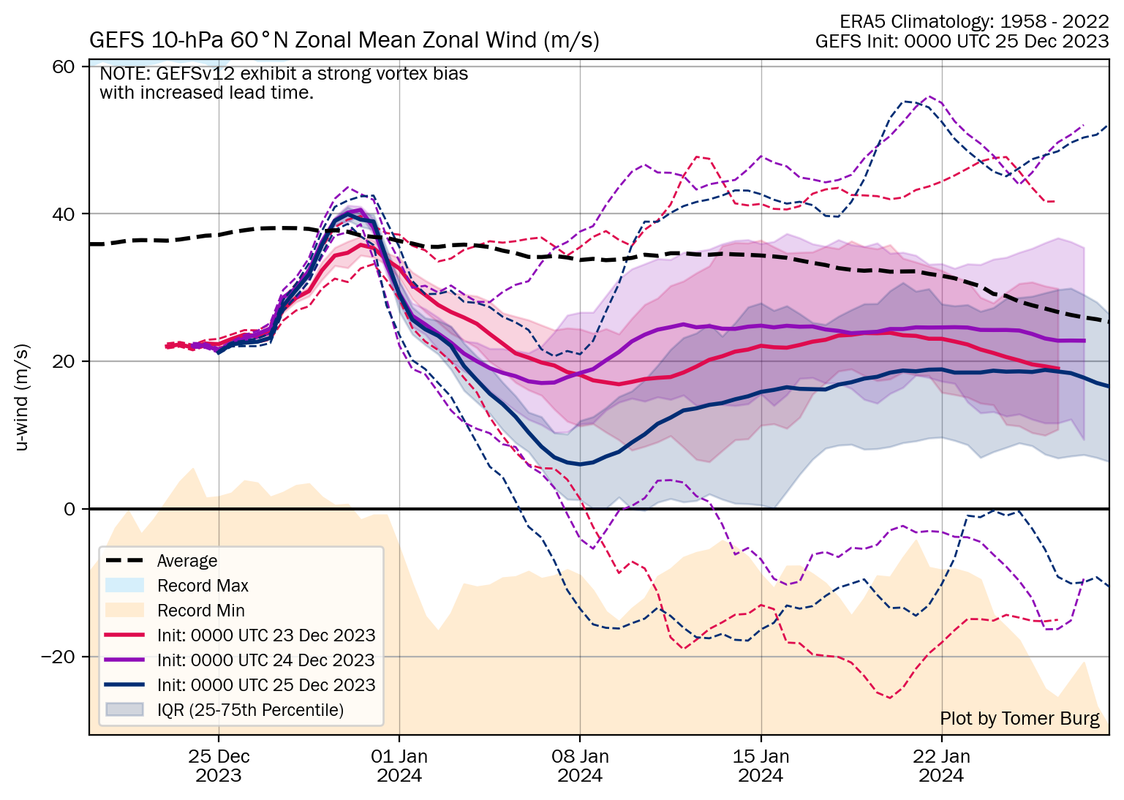
41 minutes ago, Typhoon Tip said:
There is a large abrupt and intense thermal presentation coming from the GFS cluster. In fact, by day 9 there’s already positive anomalies near the ceiling of the chart from the 2 HPA level all the way down in altitude clear to the 70.
Too early to tell if that is going to be a downward propagation.
A visual of that from last night's 00z GFS
-
2
-
-
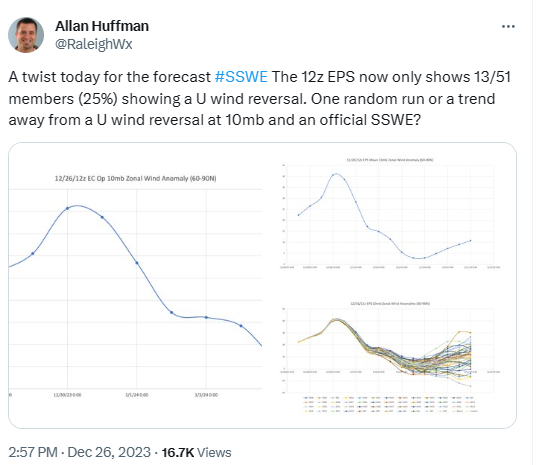
1 hour ago, GaWx said:
I wonder where he gets these graphs from. Something doesn’t seem right.
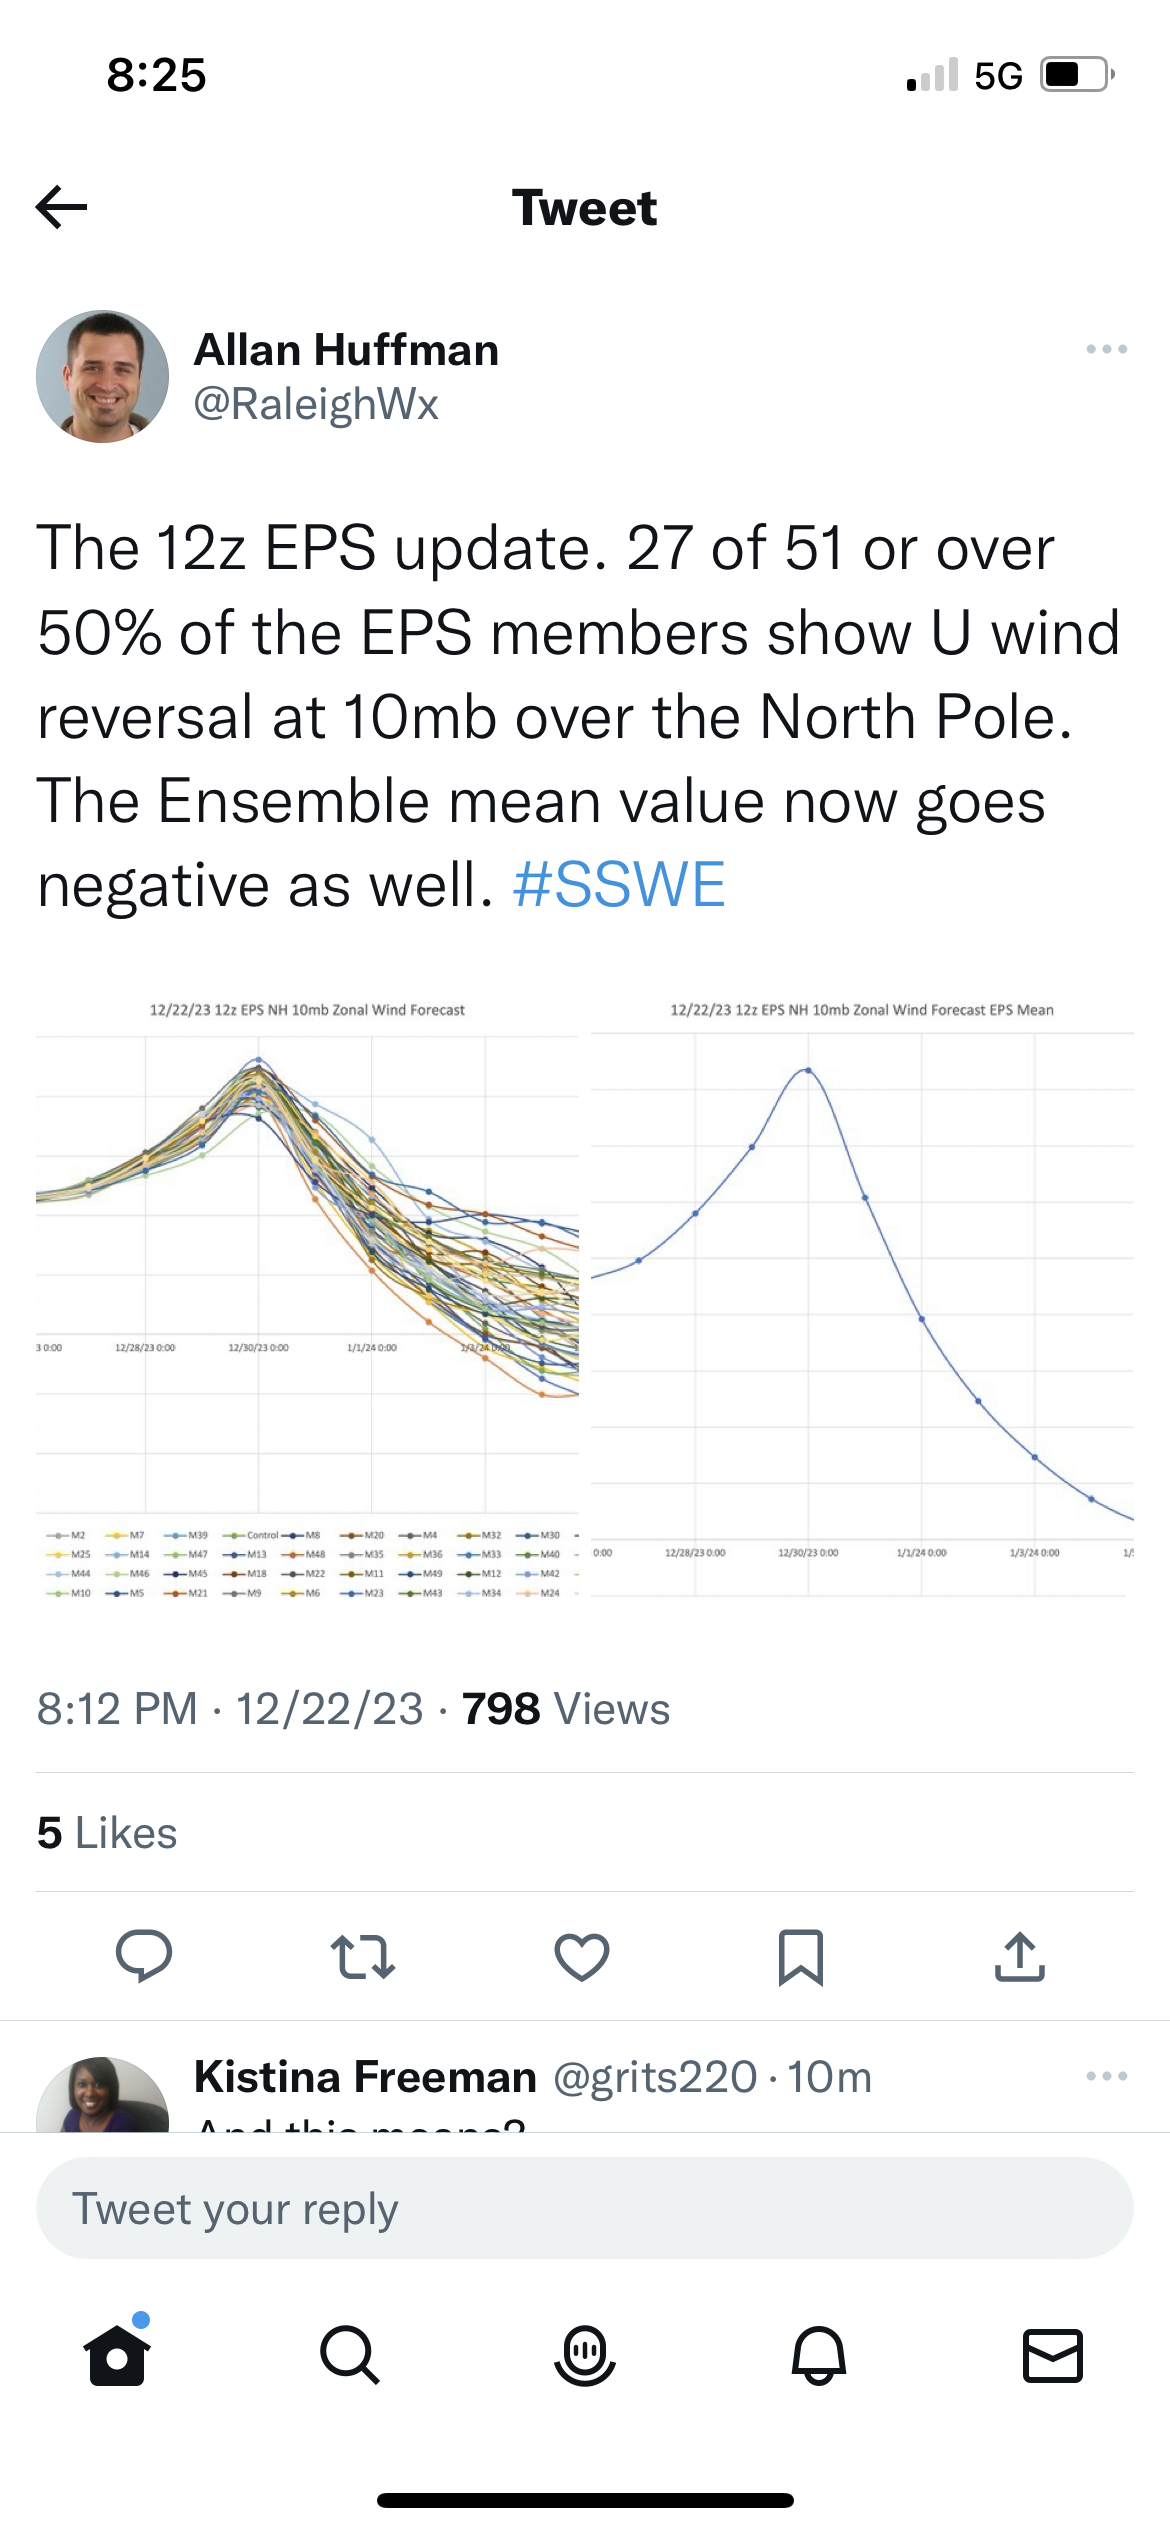
My guess is that they are from StormVista. He went on to say that he added the "60-90N" and "zonal wind anomaly" text in the title but stated that it should be "60N" and "zonal wind" instead. We'll have to see what it shows in the morning, but it looks like the regular Euro Ens (with 51 members) at 12z backed off some this run with the number of members with a SSW.
-
1
-
1
-
-
9 minutes ago, stadiumwave said:
Can't say for sure because I don't have GEFS members, but just looking at the mean I'm guessing it had some members back off as well. Maybe you have access?
I think we can only get GEFS zonal wind data from the 00z runs
-
1
-
-
4 minutes ago, stadiumwave said:
Can you post? I only have access to Mon & Thurs updates.
I think brooklyn was referring to the zonal wind chart that he ended up posting, which is based off today's Euro Weeklies (which is initialized from Dec 26 00z data)
-
7 minutes ago, brooklynwx99 said:
the 00z was the most aggressive yet, so that’s surprising
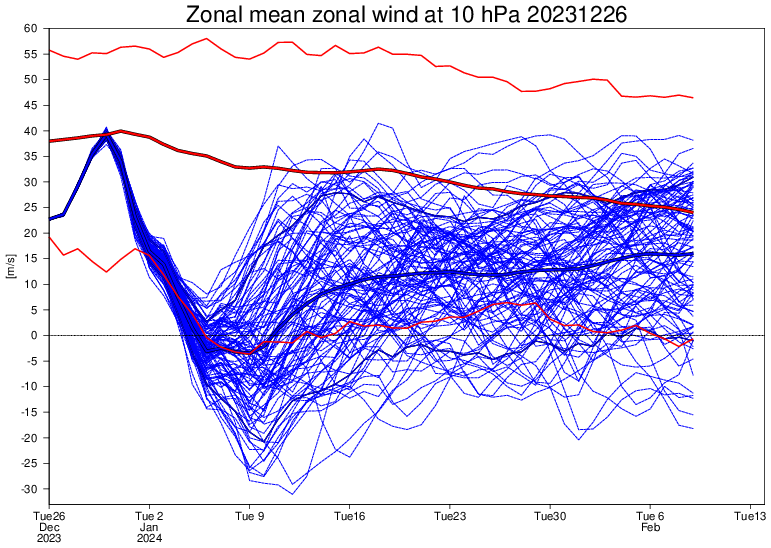
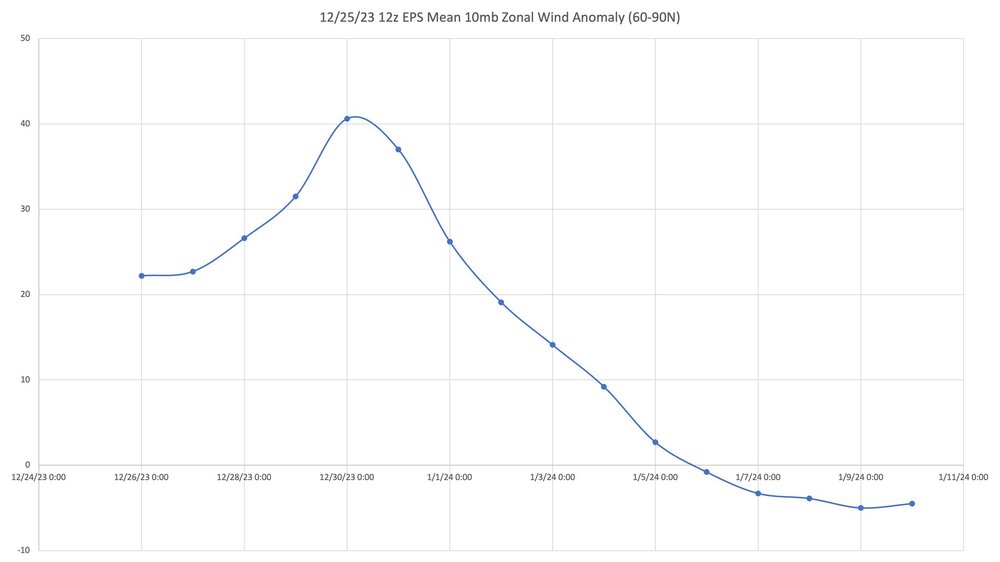
Yeah that was surprising. It looks like today's 12z GFS bottomed out at +5 on Jan 8
-
25 minutes ago, brooklynwx99 said:
@GaWx is going to like the new Weeklies. wow
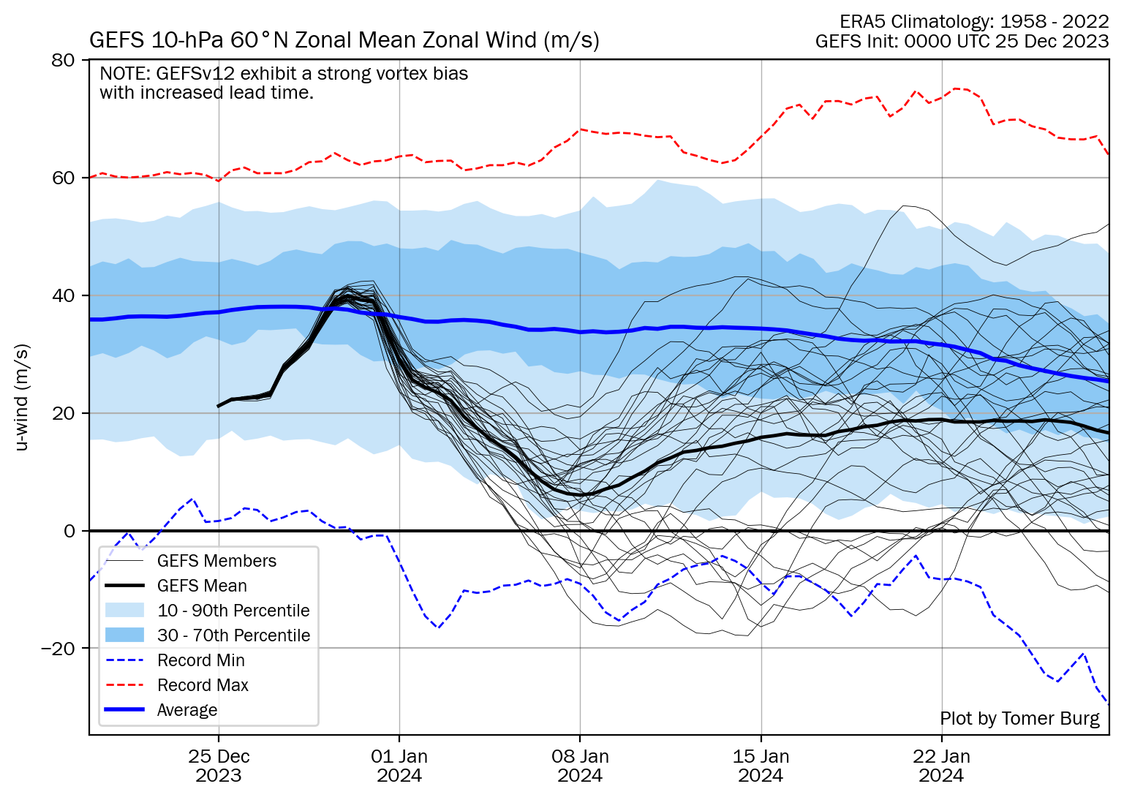
Hopefully just a blip, but the 12z EPS had less SSW members this run.
-
1
-
-
Notable drop on tonight's GEFS Ext 00z run (10mb zonal winds)
-
4
-
1
-
-
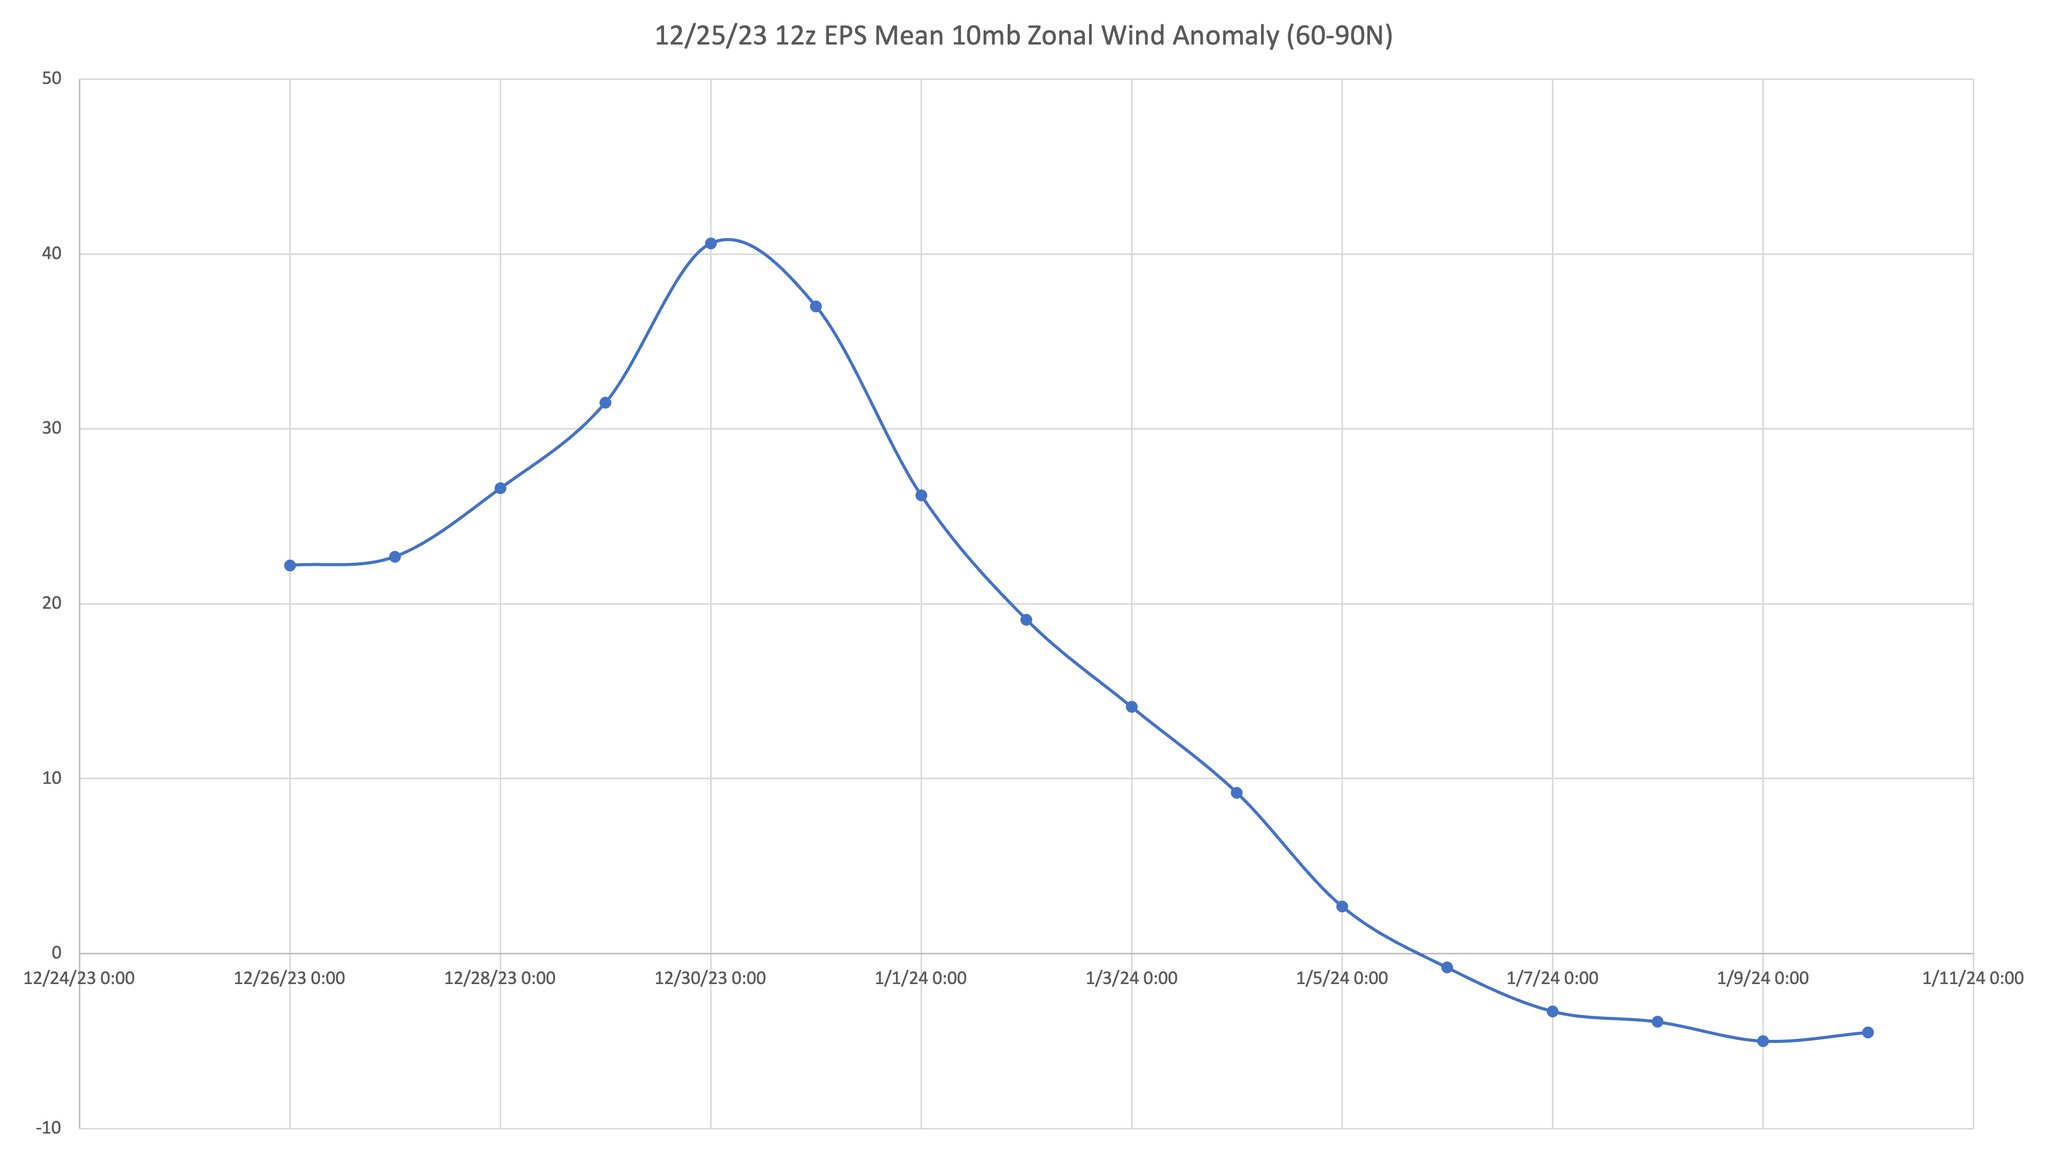
12z EPS Mean from Allan Huffman
-
10
-
-
48 minutes ago, 40/70 Benchmark said:
This is a great list because you can see the strong dichotomy with respect to the polar domain...the years that made a good come back looked alot like this year. The average is pretty useless IMO....its like taking the ensemble mean when half of the members phase an event and half don't.
Or like using the SREF model
-
2
-
 4
4
-
-
Bias corrected version of yesterday's Euro Weeklies. 77% chance of SSW per yesterday's run. From Jan Dutton with World Climate Service (@jfd118)


-
4
-
2
-
-
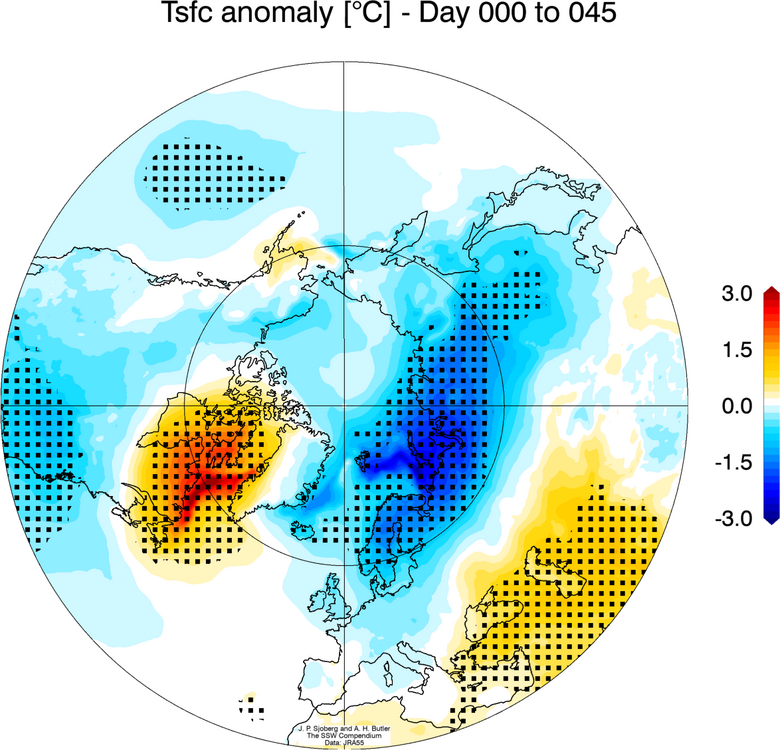
2 hours ago, GaWx said:
I found this but have no details about it. What do they mean by “following”? The 1-3 week period immediately following is sometimes mild in the E US. Is that period included. If so, the average cold anomaly would be colder than this once past 1-3 weeks. And is this just for majors? Are these C or F? But this suggests that the coldest over land in the entire hemisphere between 30 and 40N by far is over the E US vs the warm anomalies over much of Eurasia/W US. The coldest is over the MidAtlantic/SE/lower MW. That’s why I don’t think about where the coldest will end up. So, get the major and the cold should come, especially during El Niño:

This is 0 to 45 days after (on average of course). You can make your own composites with the selections at the bottom of this page: https://csl.noaa.gov/groups/csl8/sswcompendium/
-
5
-
1
-
-
57 minutes ago, Maestrobjwa said:
What would this imply? (Forgive me...this layman is lost on the SSW discussion, lol)
Winds typically blow as westerlies (west to east) in the stratosphere in the polar cap (60N to the North Pole). An SSW is defined by a reversal of the winds from westerly to easterly at 60N, high in the stratosphere at 10mb. The 0 line on the charts is the flip from westerly (above 0) to easterly (below 0) winds. Ultimately what we are looking for is for those easterlies that occur as part of the SSW to downwell from the high stratosphere to the lower stratosphere / top of the troposphere, and getting an SSW that properly downwells is one way to achieve it (though not the only way). It is much easier to get effective high latitude blocking (-AO/-NAO) when the lower stratosphere westerlies are running weaker than normal. When those westerlies are running stronger than normal in the lower stratosphere, the stratospheric polar vortex is wound up tight which is a hostile environment for the upper tropospheric flow in the polar cap to slow down and become favorable for blocking patterns. Luckily this winter we already have a favorable setup where there is some ongoing downwelling of weaker than normal westerlies in the stratosphere; a downwelling SSW would accentuate this condition further
Recommended video and reading:Short video on SSWs: https://m.youtube.com/watch?v=1MiUlTthSNA&feature=youtu.be
Blog post from Simon Lee that discusses the importance of the lower stratosphere with respect to tropospheric blocking: https://simonleewx.com/2023/11/23/the-importance-of-the-polar-vortex-at-100-hpa/
-
5
-
1
-
-
-
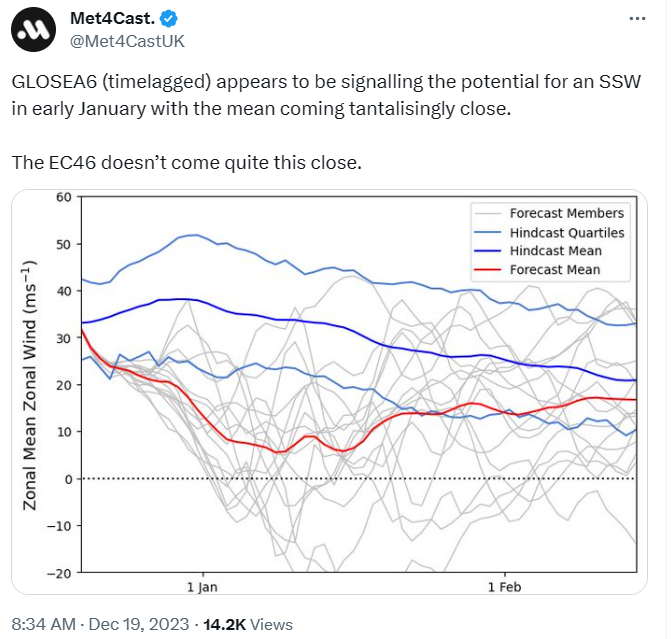
Piggybacking on the low zonal wind forecast today from the Euro Wk, this is from the UK Met Office GLOSEA 6 model run yesterday...
-
4
-
2
-
-
3 minutes ago, schoeppeya said:
Y'all have confidence this is going to make its way down to the troposphere?
No, but getting the full blown SSW is step one and better chance for it leading to a more wintry outcome in the E U.S. post SSW compared to when they occur during La Niña
-
7
-
-
Just now, GaWx said:
Wow, this run has by far the weakest SPV/strongest concentration of members with major SSWs of any run for Jan 2-13 with a dip to a mere +3 on Jan 7th!!

We said it was put up or shut up time. It put up today!
-
9
-
-
Holy moly at today’s Euro zonal wind forecast. Paging GaWx
-
7
-
-
1 hour ago, Terpeast said:
No expert on GLAAM... but a lot of this is driven by the pac jet, no?
So +GLAAM going towards neutral means that we'll see a bit of a retraction in the pac jet?
1 hour ago, GaWx said:I’m no expert either. I just know that +GLAAM partially correlates to El Niño/+PNA and -GLAAM partially correlates to La Niña/-PNA/SE ridge. So, as someone in the SE US who prefers the best shot at BN temps and who thus doesn’t like a -PNA/SE ridge, I prefer +GLAAM to -GLAAM in general. El Niño climo ftw. But maybe a moderate +GLAAM vs very strong is generally best for all I know.
What you said makes sense. A bit less El Niño influence? But the GLAAM drop appears temporary. And this is just the unreliable CFS. So, who knows if the dip will even occur? Who knows if the dip occurs but isn’t so temporary? CFS ensemble not trustworthy, especially over 2 weeks out!We are going thru a period of significant positive E Asian Mtn Torq from roughly Dec 17-27, so yeah, that adds a lot of momentum into the Pac Jet (rising GLAAM), especially when combined with a strong El Nino (too much for E U.S. cold). Ensembles have that calming down as we close in on the new year and go into early Jan. Correct that we kind of want the middle ground or light +GLAAM for E U.S. cold.
-
8
-
1
-
-
5 minutes ago, Typhoon Tip said:
Mm sudden stress for warming events take place as late as March 1
Yeah I just meant for this weakening episode in early Jan where the zonal winds are bottoming out. If not then, it would probably have to be bit down the road, but just speculating
-
14 minutes ago, GaWx said:
Although the 0Z 12/16 extended GEFS isn’t quite as active as yesterday’s run overall (7 members/23% vs 8 members/26%), it actually is more active earlier as it has a respectable 5 members (16%) with a major SSW just within the 5 days 12/30-1/3. Yesterday’s had only 3 during 12/30-1/3. The day before had only two for then I believe. Even the big 12/11 run had no more than about the same for then.
So, look out for the possibility of one within a few days of New Year’s, which as has been mentioned is a climo favored period for QBO east.

We're approaching put up or shut up time. Over this next week should be the time when the zonal wind forecasts collapse lower if we are going to get an official SSW here in early Jan
-
5
-
-
1 hour ago, mitchnick said:
What pattern period are you referring to when you say "...this pattern so far does look extremely similar to 1994?" Attached are 500mb for 12/1/23-12/10/23 & 12/94. They're nothing alike. I know I've seen it mentioned on this Board in other forums as well. Why do you/others (if you know) say it? Or are you referring to a model prog. If so, which one?


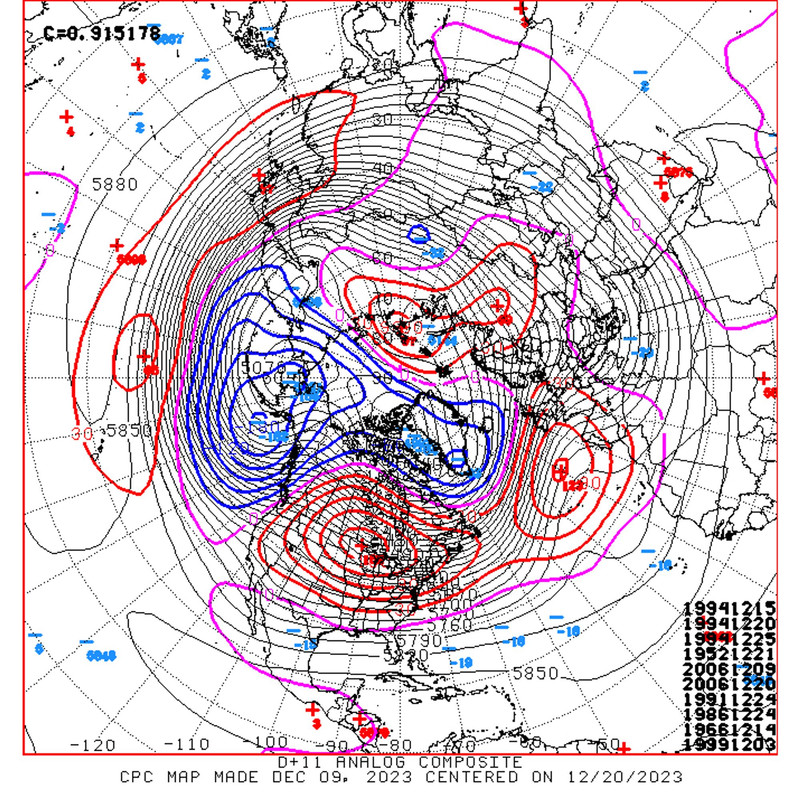
Mid-late Dec 1994 has been showing up on the CPC analog dates recently

-
3
-


El Nino 2023-2024
in Weather Forecasting and Discussion
Posted
Amy Butler had some thoughts on the SSW evolution - https://x.com/DrAHButler/status/1745473686600142978?s=20