salbers
-
Posts
644 -
Joined
-
Last visited
Content Type
Profiles
Blogs
Forums
American Weather
Media Demo
Store
Gallery
Everything posted by salbers
-
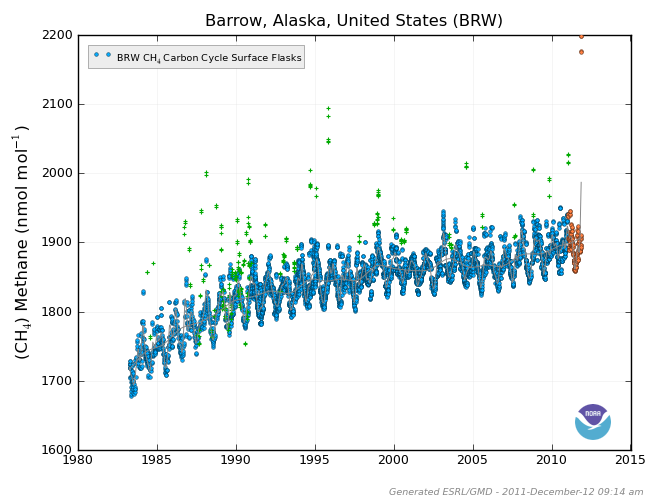
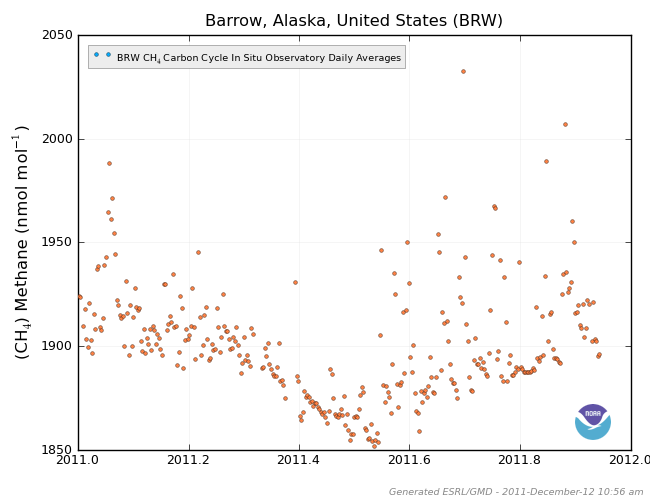
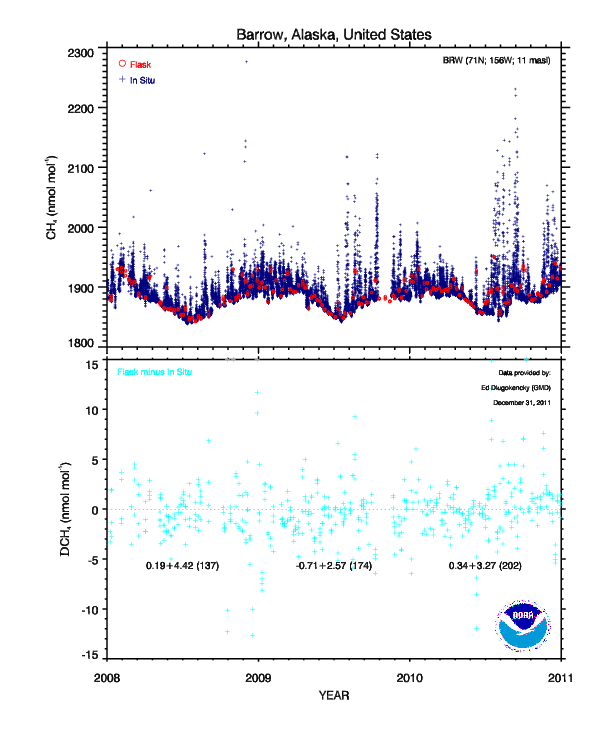
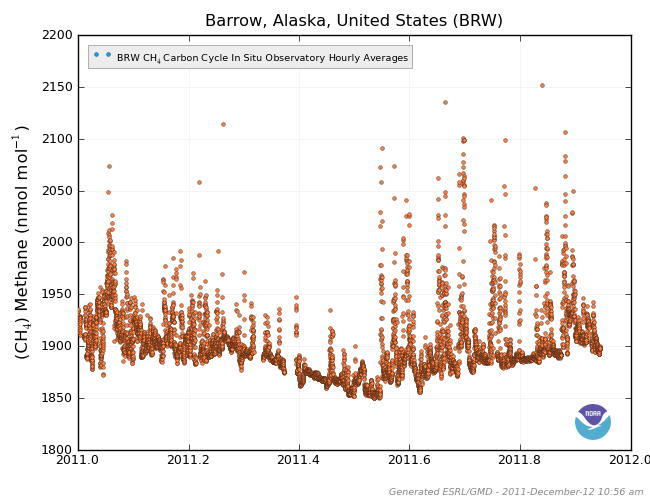
Here's an interesting comparison up till the beginning of 2011 showing both flask and in-situ measurements. We see spikes in the past, and these spikes are better sampled by the more frequent in-situ measurements (if we can plot all the points). http://www.esrl.noaa...am=ccgg&type=fi And thus below is 2011 hourly in-situ averages of Methane at Barrow so we can get a good view of the spike events over the year (up until Dec 12). ESRL/GMD is also working on a "Methane Tracker" that will strive to model the sources and sinks of methane over time based on the observations.
-
Thanks for the tips. Does the "some" option then mean that only somewhat random points are shown? Maybe that could explain the Barrow extreme points not showing up. I tried the text file download though it isn't working for me yet.
-
Why are the older graphs showing up presently on the ESRL website then? Since I work at ESRL, I should try walking down the hall to find out... Or the webmaster can probably be contacted...
-
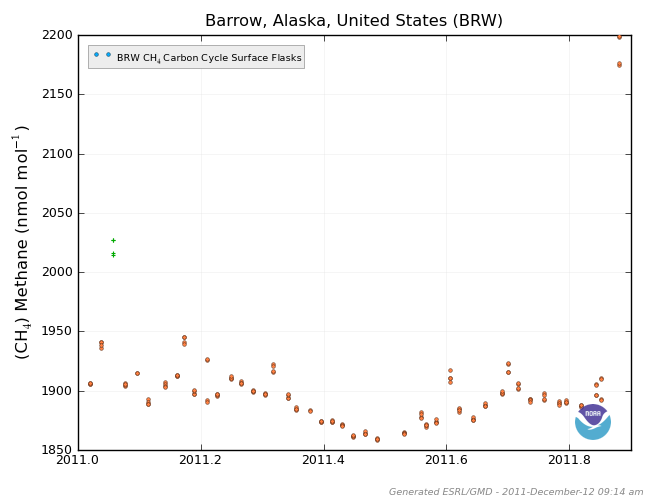
Yes, the orange measurements aren't yet quality controlled. Curiously I only get the older plots from Dec 12-17 rather than the new one from Dec 28 (today) that you posted.
-
You can get different results depending on whether you select the less frequent surface flasks, or the more frequent daily in-situ measurements. I forget how often they do the surface flasks - maybe weekly? Otherwise, your plots seem to match OK given only a change in the start date.
-
Vergent and I have the same link. For this link one still has to select the appropriate options. My larger point is that maybe the Barrow readings aren't that unusual, and that local methane releases have been occasionally occurring over the years in that area?
-
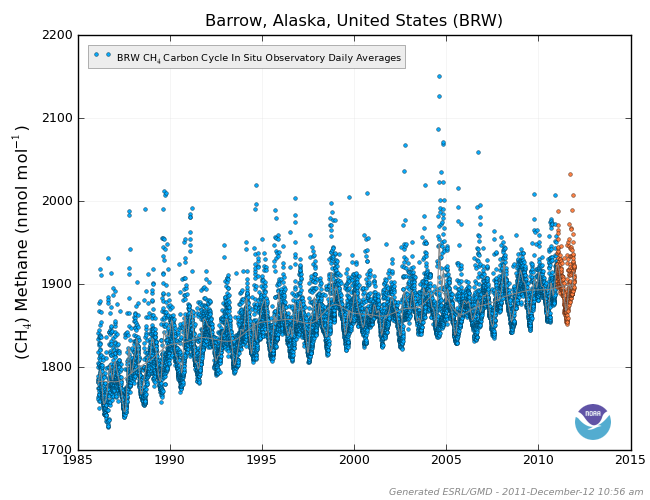
Seems like the daily in-situ measurements at Barrow show variability and spike events over the years? http://www.esrl.noaa...am=ccgg&type=ts
-
Marietta Wx - curiously when I look at the ESRL site I only see the Barrow CH4 plot updated on Dec 12 and it is missing the data point at 2100ppb. Do you have a link that yields the more updated plot? It's good practice to post a link along with an image when possible. Thanks. http://www.esrl.noaa...am=ccgg&type=ts In-situ daily averages show more scatter and that this scatter is a more common occurrence: