

Danny8
-
Posts
47 -
Joined
-
Last visited
Content Type
Profiles
Blogs
Forums
American Weather
Media Demo
Store
Gallery
Posts posted by Danny8
-
-
On 6/2/2025 at 1:16 PM, sbnwx85 said:

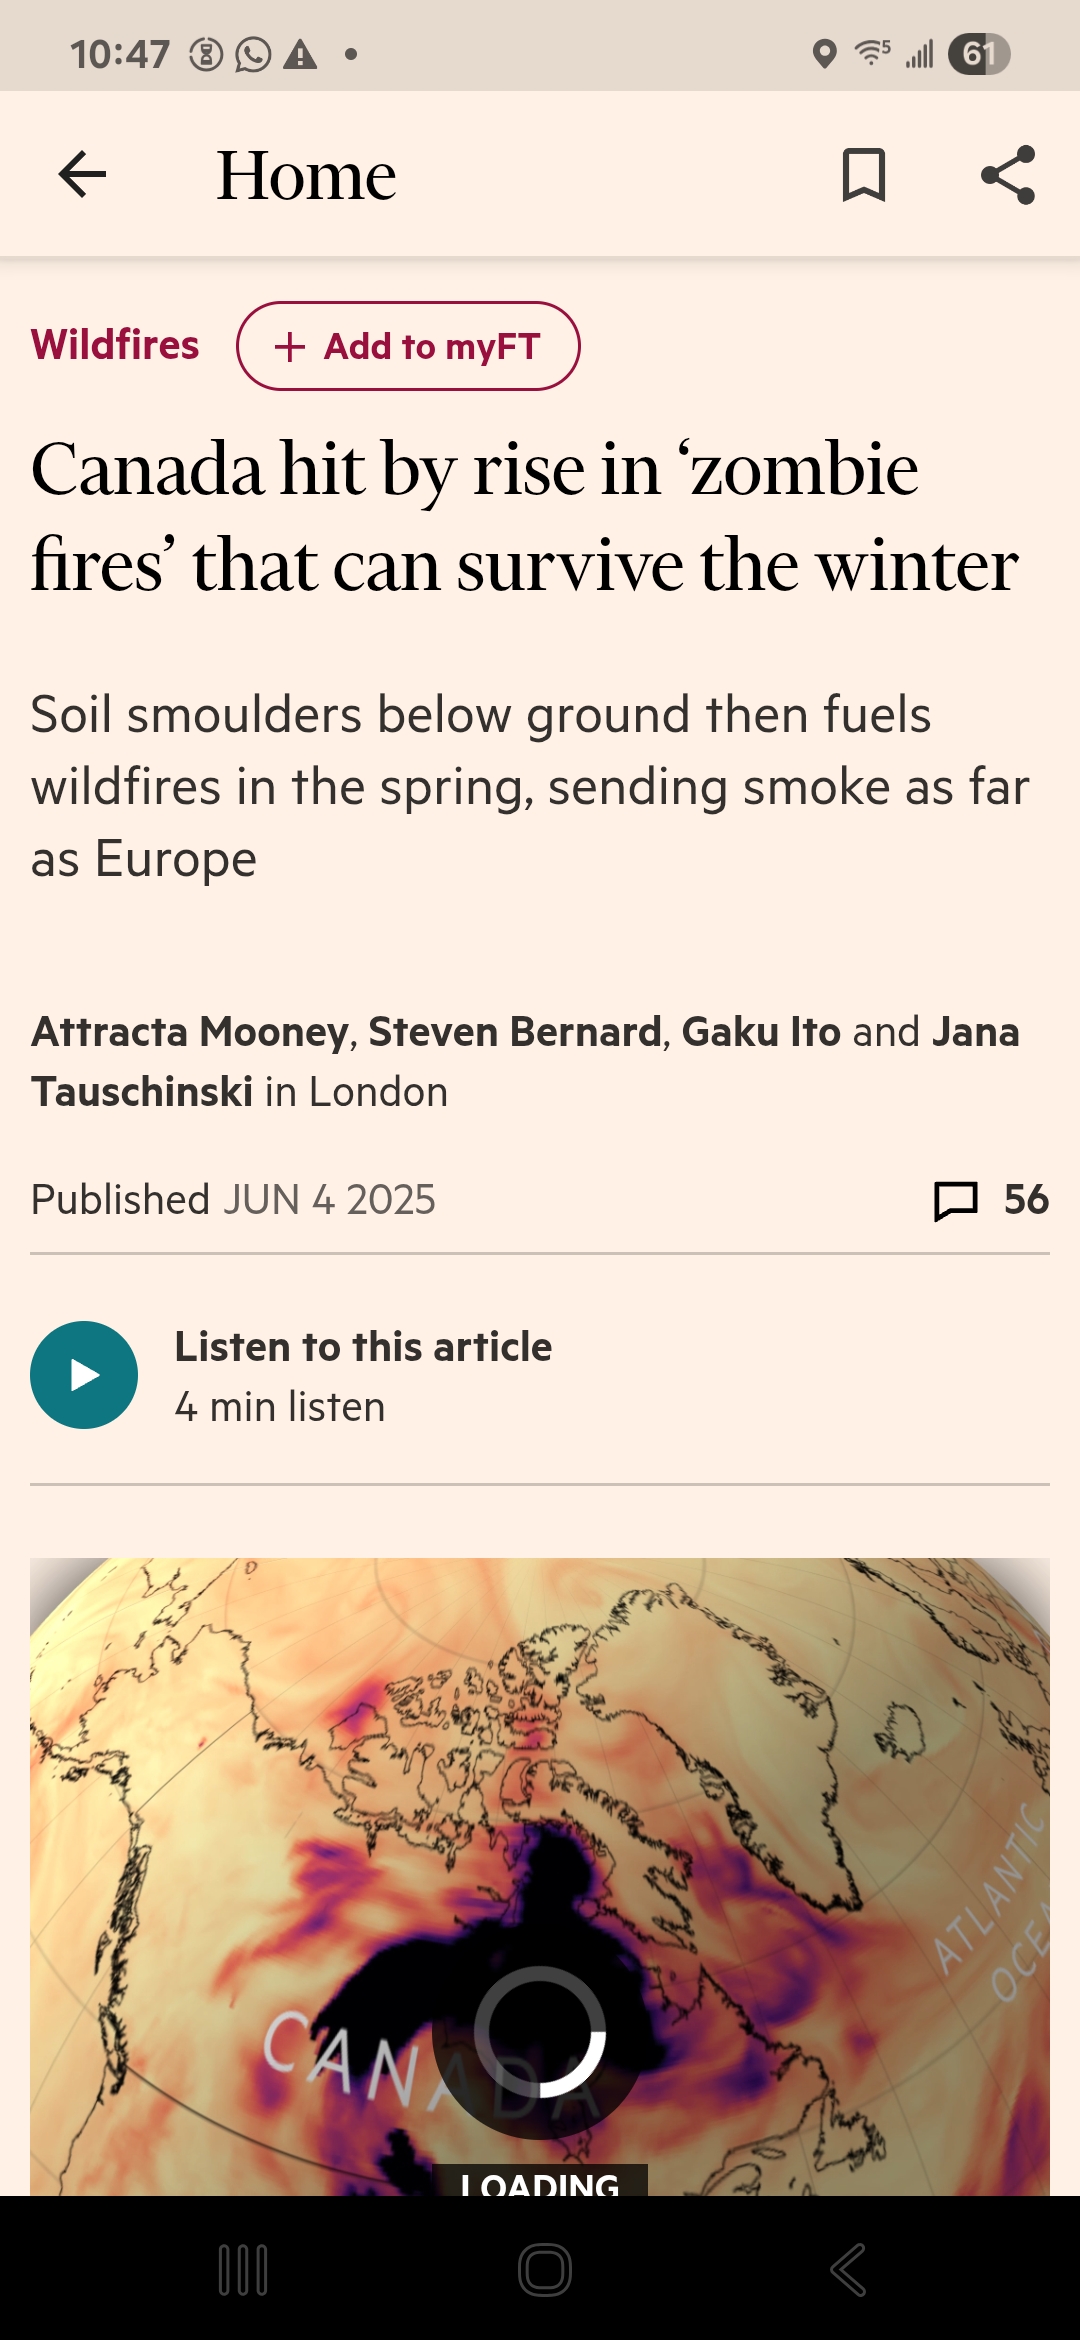
Actually… it apparently was Zombies!
https://www.ft.com/content/f87c4c4f-41de-4951-9bdf-286da55aac0f
-
 1
1
-
-
Unfortunately doesn’t detail specific locations but gives that idea

-
1
-
-
14 hours ago, mimillman said:
Random questions since I don’t know where the data is myself to calculate this:
1) What is Chicago’s average high and average low temperature by month on the 10y average compared to the 30y average?
2) What is Chicago’s by month snowfall average on the 10y vs the 30y?
Go to the NWS Chicago site (https://www.weather.gov/lot/). Click on "Climate and Past Weather", and you can search those things in the NowData tab. Select the "Monthly summarized data" product.
Monthly Mean Max Temperature for CHICAGO OHARE INTL AP, IL
Click column heading to sort ascending, click again to sort descending.YearJanFebMarAprMayJunJulAugSepOctNovDecAnnualMean 31.6 35.9 47.2 59.0 70.3 80.4 84.3 82.6 76.0 63.0 48.7 36.8 59.6 1995 30.3 33.9 49.2 54.6 68.7 83.7 88.0 87.7 73.5 63.0 40.9 33.6 58.9 1996 31.3 33.9 40.2 55.4 64.4 78.0 80.1 82.1 73.3 62.2 39.8 33.5 56.2 1997 27.8 35.1 46.2 55.5 63.9 79.3 83.1 78.2 74.2 63.8 42.5 36.1 57.1 1998 35.3 45.0 45.6 58.7 75.4 79.5 84.1 82.5 78.3 64.3 52.4 42.7 62.0 1999 29.9 42.1 44.4 58.4 72.4 80.4 88.3 79.3 75.7 63.7 55.6 37.7 60.7 2000 32.1 42.2 54.6 57.6 72.1 76.8 79.8 81.8 74.6 66.1 43.8 24.4 58.8 2001 30.8 34.0 42.7 64.2 70.2 77.5 85.0 81.7 71.0 60.3 57.4 40.2 59.6 2002 38.5 40.2 43.6 58.9 65.2 81.1 86.6 82.8 78.9 57.5 44.8 36.9 59.6 2003 28.3 32.3 46.5 58.7 66.0 76.7 82.9 82.8 73.7 62.4 49.5 38.6 58.2 2004 27.4 35.8 49.3 61.4 70.9 77.3 80.5 77.0 78.4 63.0 50.3 35.8 58.9 2005 31.2 38.9 43.9 63.4 67.8 85.2 86.4 84.0 80.1 64.3 51.4 29.4 60.5 2006 42.0 36.3 46.7 64.1 69.7 78.8 85.7 83.0 71.1 57.5 50.2 40.5 60.5 2007 33.8 24.4 51.3 56.5 75.5 81.6 83.5 83.2 79.2 68.1 47.0 34.1 59.9 2008 32.0 29.7 42.5 59.8 66.2 80.9 83.8 81.8 75.2 61.6 46.3 31.5 57.6 2009 23.9 36.9 48.7 57.0 70.6 77.0 78.4 79.1 74.3 55.2 53.1 32.3 57.2 2010 27.4 32.3 50.4 65.5 71.2 80.2 87.1 85.7 74.2 66.8 50.8 29.0 60.0 2011 26.7 32.7 43.8 56.1 67.8 79.4 88.5 82.5 69.9 65.2 52.4 41.8 58.9 2012 38.5 40.2 63.3 59.8 76.5 85.5 91.5 84.0 74.5 60.5 49.0 42.5 63.8 2013 35.3 33.1 39.6 56.3 71.2 78.2 81.8 82.7 77.1 62.4 45.3 31.1 57.8 2014 24.6 25.7 40.9 59.2 71.0 81.0 79.8 82.1 73.7 60.6 41.4 36.9 56.4 2015 29.0 23.4 44.4 60.0 70.0 76.9 81.9 80.9 78.1 63.2 53.7 44.5 58.8 2016 31.7 37.2 51.5 57.4 70.1 81.9 84.4 84.3 77.7 65.8 55.3 31.1 60.7 2017 34.6 47.7 47.1 63.8 67.7 83.3 83.8 80.7 79.7 65.5 46.9 34.2 61.3 2018 31.9 38.0 44.7 50.0 76.4 80.4 85.1 84.8 77.5 60.7 39.7 39.7 59.1 2019 27.5 34.0 42.7 59.1 67.5 77.3 86.1 81.5 76.9 58.7 41.6 41.3 57.9 2020 35.8 37.3 50.9 58.0 69.1 84.0 88.3 86.4 74.6 60.9 55.7 39.3 61.7 2021 33.9 27.4 53.3 61.3 69.7 83.8 82.3 86.2 79.8 66.6 48.2 45.8 61.5 2022 28.6 35.3 49.1 55.1 72.2 82.6 83.5 83.0 76.0 63.9 51.7 35.7 59.7 2023 37.5 42.2 46.0 62.2 73.8 81.4 84.6 83.0 77.7 64.7 51.0 44.2 62.4 2024 30.7 49.2 52.9 61.6 75.2 83.6 83.8 83.8 80.3 70.1 52.3 38.4 63.5 Monthly Mean Min Temperature for CHICAGO OHARE INTL AP, IL
Click column heading to sort ascending, click again to sort descending.YearJanFebMarAprMayJunJulAugSepOctNovDecAnnualMean 18.0 20.5 30.1 39.3 49.9 60.1 65.4 64.5 56.6 44.9 33.2 23.4 42.2 1995 17.7 19.0 31.2 37.4 48.8 60.9 67.2 70.3 51.5 44.4 24.6 19.0 41.0 1996 15.4 18.2 21.3 34.9 45.6 57.9 59.6 62.4 53.6 41.6 26.9 21.9 38.3 1997 10.8 22.8 29.5 34.9 43.6 57.3 63.3 60.8 54.1 42.5 30.2 26.8 39.7 1998 23.8 32.4 32.3 40.8 54.1 59.0 64.8 64.4 57.1 46.6 37.2 26.6 44.9 1999 15.3 25.9 26.8 40.8 50.9 60.3 68.4 61.3 51.1 42.0 34.5 22.0 41.6 2000 18.5 25.9 33.7 36.8 51.9 57.7 62.3 63.0 54.8 46.0 30.2 7.6 40.7 2001 18.3 18.2 25.6 40.7 49.8 57.3 64.1 64.7 52.8 43.9 39.0 26.5 41.7 2002 25.3 24.1 25.5 40.9 45.2 60.8 67.5 63.5 55.8 42.0 30.4 23.4 42.0 2003 14.3 14.9 26.9 37.9 46.5 54.2 61.8 64.4 53.0 41.2 34.2 24.6 39.5 2004 13.2 18.9 33.0 39.3 49.1 56.9 61.9 58.0 54.6 44.8 37.1 21.9 40.7 2005 17.8 26.0 26.2 39.7 46.4 63.1 64.7 64.5 58.7 46.0 32.6 17.3 41.9 2006 29.6 20.0 29.9 42.1 49.5 57.8 67.3 65.6 53.7 40.4 35.5 27.1 43.2 2007 21.9 11.5 33.6 37.0 52.0 61.1 63.9 66.4 57.0 49.9 31.7 21.6 42.3 2008 14.9 16.4 27.2 39.1 44.8 60.7 64.2 63.6 57.1 43.7 32.2 14.2 39.8 2009 7.8 19.6 30.5 37.5 49.1 58.1 60.4 61.8 56.4 42.5 37.6 20.6 40.2 2010 16.5 21.1 33.0 43.6 52.2 62.2 68.2 67.7 56.1 45.2 32.2 16.0 42.8 2011 14.5 19.6 28.8 39.3 48.0 59.5 69.5 64.4 54.4 44.6 37.4 28.6 42.4 2012 21.9 25.6 43.6 41.6 54.6 62.4 70.6 62.6 53.7 42.4 32.0 29.7 45.1 2013 17.9 19.1 25.6 37.5 50.7 58.9 64.5 63.3 57.3 43.8 29.6 15.6 40.3 2014 6.7 8.9 22.4 37.9 49.7 60.9 60.9 65.3 54.2 43.4 25.8 27.1 38.6 2015 15.5 5.7 26.3 38.8 50.7 57.8 62.7 62.6 59.8 46.2 35.5 33.5 41.3 2016 17.6 23.5 35.1 38.1 49.4 61.2 66.5 67.4 61.4 47.9 38.3 18.9 43.8 2017 23.0 28.4 31.8 43.7 48.0 61.6 65.5 62.2 59.1 49.7 32.5 20.1 43.8 2018 17.4 19.6 29.1 32.4 55.9 62.6 67.4 67.7 60.4 44.7 29.4 26.7 42.8 2019 14.5 17.8 25.9 40.3 48.5 58.2 68.2 64.3 61.9 43.1 27.9 26.6 41.4 2020 24.4 23.1 34.7 38.7 50.7 63.9 70.2 67.2 57.9 42.1 39.0 26.4 44.9 2021 24.4 13.0 35.2 42.5 50.8 64.8 66.5 68.1 60.7 52.7 32.5 30.2 45.1 2022 12.6 19.5 32.4 38.9 55.2 61.9 67.0 65.7 58.8 44.2 35.1 22.5 42.8 2023 27.1 25.5 31.6 41.3 51.0 60.2 66.7 65.5 61.2 49.4 34.7 33.8 45.7 2024 21.8 29.7 35.1 43.8 54.5 64.3 66.2 65.9 60.9 49.3 40.0 25.7 46.4 Monthly Total Snowfall for CHICAGO OHARE INTL AP, IL
Click column heading to sort ascending, click again to sort descending.YearJulAugSepOctNovDecJanFebMarAprMayJunSeasonMean T T T 0.2 1.9 7.4 12.5 10.0 4.6 1.2 T T 38.5 1994-1995 0.0 0.0 0.0 0.0 T 7.0 13.1 0.4 3.5 0.1 0.0 0.0 24.1 1995-1996 T 0.0 0.0 T 3.9 9.9 5.9 M M M T 0.0 M 1996-1997 M 0.0 0.0 0.0 M T M M M 1.7 0.0 T M 1997-1998 0.0 0.0 0.0 0.0 M 7.1 M 0.0 M M 0.0 T M 1998-1999 0.0 0.0 0.0 0.0 0.2 1.0 29.6 1.9 18.2 0.0 0.0 0.0 50.9 1999-2000 0.0 0.0 0.0 0.0 0.0 3.5 13.6 11.6 T 1.6 0.0 T 30.3 2000-2001 0.0 0.0 0.0 T 0.1 30.9 1.5 2.2 4.2 0.3 T T 39.2 2001-2002 T 0.0 0.0 T 0.0 1.6 15.5 1.8 11.2 1.0 0.0 T 31.1 2002-2003 0.0 0.0 0.0 0.0 4.7 8.0 4.3 1.5 7.1 3.0 0.0 0.0 28.6 2003-2004 T T 0.0 0.0 T 1.5 14.6 6.5 2.2 0.0 0.0 0.0 24.8 2004-2005 0.0 0.0 0.0 0.0 5.1 0.6 27.8 2.7 3.2 T T 0.0 39.4 2005-2006 0.0 0.0 0.0 T 1.9 10.4 5.5 2.5 5.7 T 0.0 T 26.0 2006-2007 0.0 0.0 T 0.3 0.4 5.8 3.5 20.3 2.3 3.0 0.0 0.0 35.6 2007-2008 0.0 0.0 0.0 0.0 0.3 17.6 12.7 21.8 7.9 T 0.0 0.0 60.3 2008-2009 0.0 T 0.0 T 0.6 21.9 21.5 4.5 2.1 2.1 0.0 0.0 52.7 2009-2010 0.0 0.0 0.0 T T 20.8 9.1 22.5 1.8 T 0.0 0.0 54.2 2010-2011 0.0 0.0 0.0 0.0 T 16.2 10.6 29.0 1.0 0.6 T T 57.4 2011-2012 0.0 0.0 0.0 0.0 T 1.7 12.2 5.6 0.3 0.0 T 0.0 19.8 2012-2013 0.0 0.0 0.0 0.0 T 0.9 2.6 16.1 10.4 0.1 0.0 T 30.1 2013-2014 0.0 0.0 0.0 T 0.9 14.2 33.7 19.5 12.3 1.4 0.0 0.0 82.0 2014-2015 0.0 0.0 0.0 0.1 2.8 T 13.9 26.8 7.1 T 0.0 T 50.7 2015-2016 0.0 T 0.0 0.0 11.2 4.5 6.3 5.5 2.6 1.1 0.0 0.0 31.2 2016-2017 0.0 0.0 0.0 0.0 T 17.7 0.6 T 7.8 0.0 0.0 T 26.1 2017-2018 T 0.0 0.0 T 0.1 5.3 4.6 20.3 2.6 3.2 0.0 0.0 36.1 2018-2019 0.0 0.0 0.0 T 12.7 1.4 18.2 9.0 0.3 7.9 T 0.0 49.5 2019-2020 0.0 0.0 0.0 4.6 3.7 2.0 7.8 8.8 3.2 4.7 0.0 0.0 34.8 2020-2021 T 0.0 0.0 T 0.7 2.8 21.9 21.6 1.8 T 0.0 0.0 48.8 2021-2022 0.0 0.0 0.0 0.0 T 1.9 13.9 12.8 3.8 0.4 0.0 T 32.8 2022-2023 T 0.0 0.0 T 1.1 3.2 9.9 3.7 1.8 0.5 0.0 0.0 20.2 2023-2024 0.0 0.0 0.0 0.9 1.8 1.2 16.1 1.2 1.0 T 0.0 T 22.2 -
 1
1
-
-
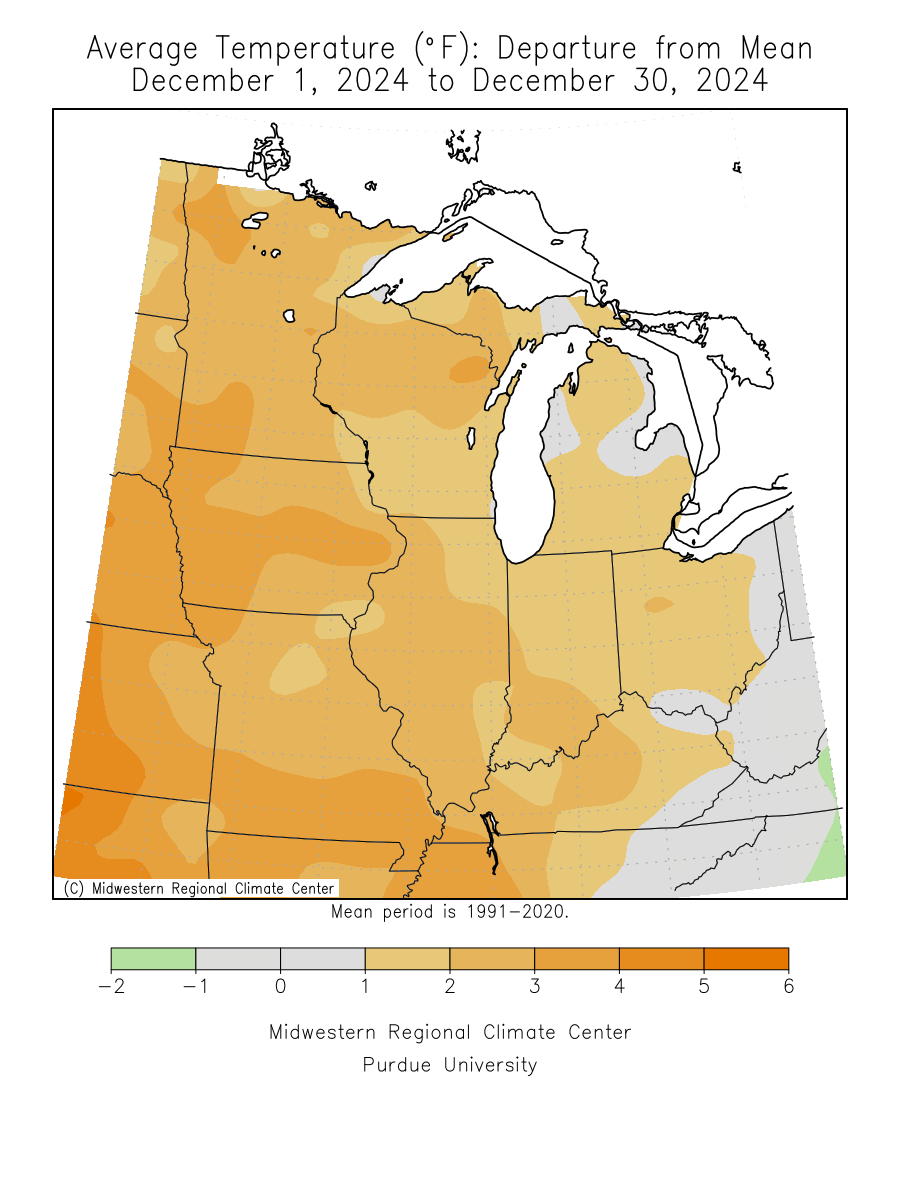
On 12/17/2024 at 5:34 AM, A-L-E-K said:
gfs with pretty relentless heat to end the month and would probably erase most if not all temp departures form the cold snaps
Good call

-
1
-
-
30 minutes ago, dmc76 said:
that storm in early 1999. Technically it missed us. We were on the wrong side of the low.
The one 17th on this list? January 2-3, 1999 i mean
-
3 hours ago, Frog Town said:
These were my college years in SE Michigan and it sucked! I remember it all ending in January of '99 with the Blizzard.
As a kid I think January 1999 is what sparked my love for winter after waiting so long for snow days. I was in Sterling Heights and I always felt like everything was missing us
-
1
-
-
15 hours ago, OrdIowPitMsp said:
Do the Michigan WFOs play a game of chicken to see who will issue a WWA first?
Does Grand Rapids just have a higher threshold for winter weather than Milwaukee or Detroit offices? For example the new cold warnings have different thresholds

-
23 hours ago, michsnowfreak said:
DT can definitely be a trip, but he is somewhat subjective unlike coldmisers like JB or some of the warmistas you'll see on the main weather forum of this board that forecast with nothing but their biases.
Ive said it many times before and will say many times again...we will have harsh winters again, but we will never have another 2013-14. It was a harsh winter for all in the midwest and northeast, but SE MI was basically ground zero.
At this point it feels like being in the top 25 coldest winters in the historical record would qualify as “harsh winter”, but we hit a top 25 warmest summer and it’s considered “who cares” by much of the board
-
2
-
-
I'm near Grand Rapids for the Thanksgiving weekend and really cashing in on lake effect around here last night and all day today
-
3
-
-
On 11/13/2024 at 2:33 PM, Danny8 said:
If it makes you feel better im always entertained how long it takes Marquette to get it's first freeze. The city station on the water not the Marquette WSO. Has gone to November quite a few times the past few years, and they are still waiting on their first freeze this year
First freeze at the lakefront Marquette station yesterday Nov 24th
-
4
-
-
7 hours ago, michsnowfreak said:
DTW had another 33 this morning. This year will technically be the latest first freeze on record (Nov 15) even though it is nowhere near the latest first 33 (Nov 15) and likely wont be the latest first hard freeze of 28 or lower (Dec 4). My opinion is that DTW is not so much UHI as it is airport runways. But we still use the phrase UHI lol. Is the thermometer/ASOS in a properly maintained, enclosed, grassy area? Absolutely. But the airport has grown exponentially the past few decades and there is so much more concrete there than there used to be. There's no other way to slice it. There's been multiple 20s in most suburbs this Fall, and I'm not just talking the most rural ones either. Thermometers in Romulus (the city DTW is in) JUST outside the airport property have been in the upper 20s on these 33° mornings.
If it makes you feel better im always entertained how long it takes Marquette to get it's first freeze. The city station on the water not the Marquette WSO. Has gone to November quite a few times the past few years, and they are still waiting on their first freeze this year
-
1 hour ago, michsnowfreak said:
Definitely quite a bit. Obviously lots of all kinds of different trees, but what always stand out to me is the high number or horse chestnut trees.
Huh I just realized I think I live by a bunch of horse chestnuts after looking them up. Always thought they were buckeye trees!
-
1
-
-
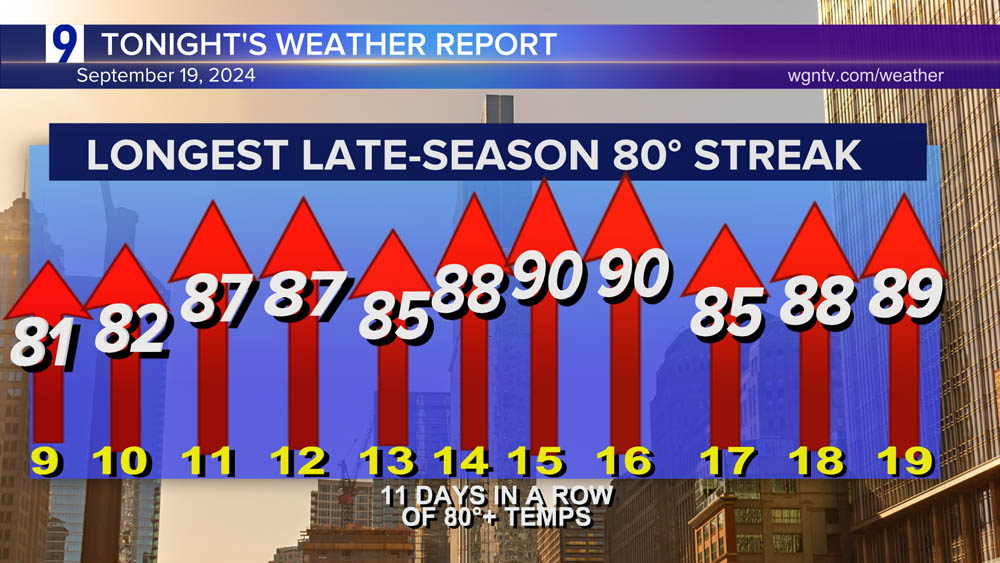
For Chicago
Looks like Detroit is also at an 11-day streak over 80 but I’m not sure if that is the longest in September
-
2
-
-
On 8/16/2024 at 2:18 AM, frostfern said:
CAD summer.

Met summer in Grand Rapids ended with above normal temperatures and precipitation… so WAW summer (warm and wet)?
-
Is there an easy way to look up historical dew point data? Monthly and daily data?
or is that something you have to back into with temp and humidity data.
-
7 hours ago, Brian D said:
Came across this site a long time ago. It has a reconstruction of temp data starting in 1820 from Ft. Snelling. Apparently it's the only reconstruction that has been done on data from early pioneer days. At least from what the article says at the time of the writing of it. Maybe that's has changed. Not sure.
Here's the link to the site, and you can access the data, and writings from there. https://www.climatestations.com/minneapolis-2/
But anyway, I got to thinking recently, what would that early data from a rural setting look like if you add more rural data to it up to the present day. The chart they present is Ft. Snelling data with Minneapolis/St. Paul threaded data.

So I found some co-op stations to use in my new, more rural revised dataset. They're about 15-20 miles outside of the MSP airport. Farmington, Rosemount, (both S) and Chanhassen NWS (W).
Farmington 3NW (212737) 1893-2009, Rosemount Research Center (217107) 1951-2023, and Chanhassen NWS (211448) 1996-2023.
Data has been time corrected for Farmington, and Rosemount. Chanhassen is 2400 readings, so no correction needed there. I then averaged them.
The threaded data for the Twin Cities: St. Paul 01/1873-04/1891, MSP downtown 05/1891-4/8/1938, and MSP airport 4/9/1938-12/2023.
Since Farmington starts in 1893, that leaves a 20 yr period with no comparative data, so I had to reduce it by using the avg difference between Farmington (early decades), and MSP which ended up being -1.5.
Here are the results of my work. You can see how much cooler it is outside an urban environment, and it's especially noticeable from the time ASOS readings started to be taken from within the runways at MSP airport in 2002.


Very interesting analysis!
Those 38 degree annual mean years in 1843 and 1875 are insane. Wouldn’t that technically qualify as like a subarctic climate??
-
1
-
-
On 6/9/2024 at 3:39 PM, mississaugasnow said:
The heat for the eastern lakes keeps getting pushed back. The hype for this summer being hottest in years in the local media means the population will lose more trust of these seasonal forecasts.
For the US side of the eastern lakes it looks like Buffalo, Cleveland, and Detroit all finished in the top 10% of warmest Junes on record (going back to the 1870s)
-
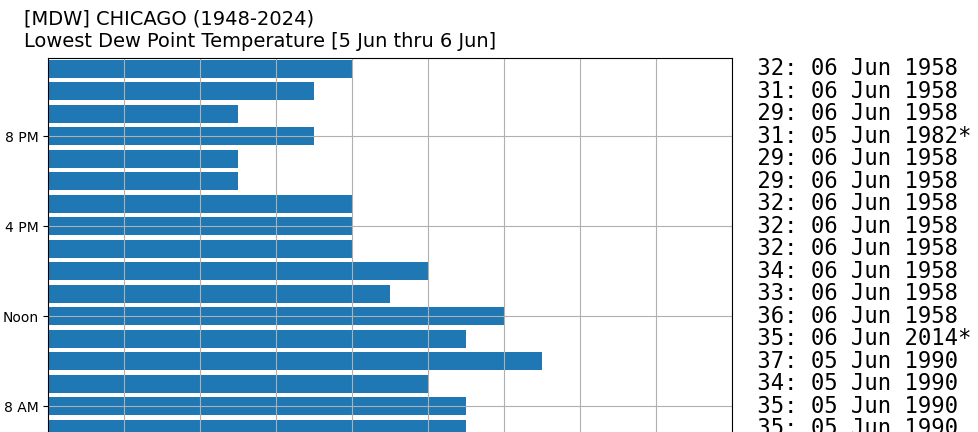
On 6/6/2024 at 12:19 PM, TheClimateChanger said:
Dewpoint of 40F at Midway, which is just 4F above the lowest noon local time dewpoint of record on the 6th of June, dating back to 1948.
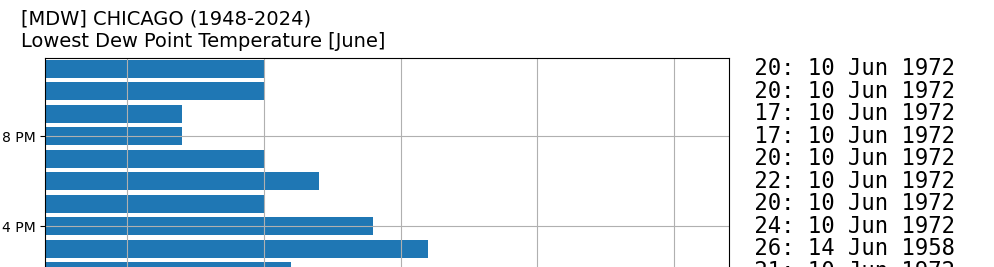
The monthly record low dewpoint in that time period is 17F, from June 10, 1972:
Where do you find historical dew point data?
-
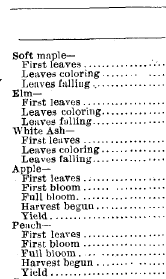
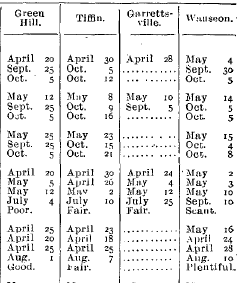
On 5/22/2024 at 2:31 PM, TheClimateChanger said:
Wow, I'm pretty shocked. I would have never thought your location in the Huron Mountains of the Upper Peninsula would have that many leaves already.
When I look at the phenological reports from the Weather Bureau's Monthly Weather Review, you seem further along than northern Ohio used to be in the early 20th century, with the first White Ash leaves not being noted until the last week or so of May into early June. Even elm were just coming into leaf. Crazy how much that's changed in the past 100 years.
1907
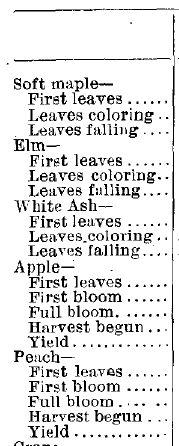
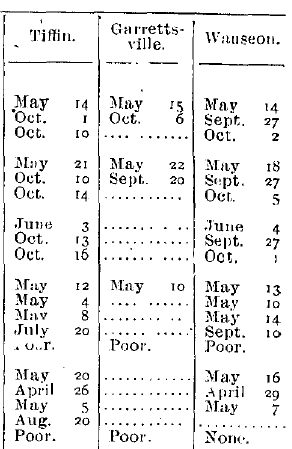
1908
That is really interesting, good find!
-
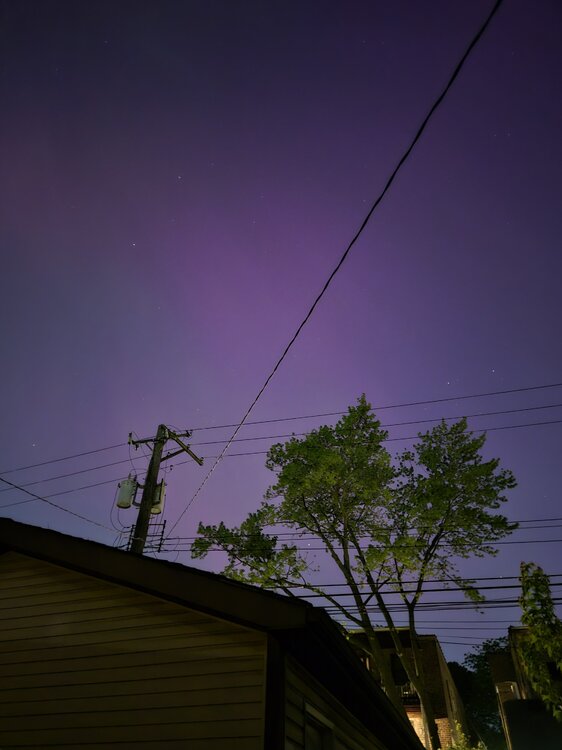
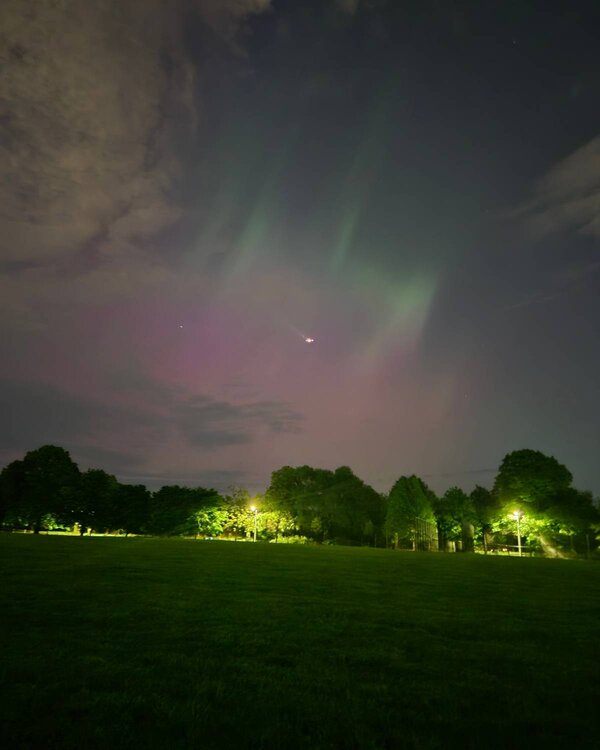
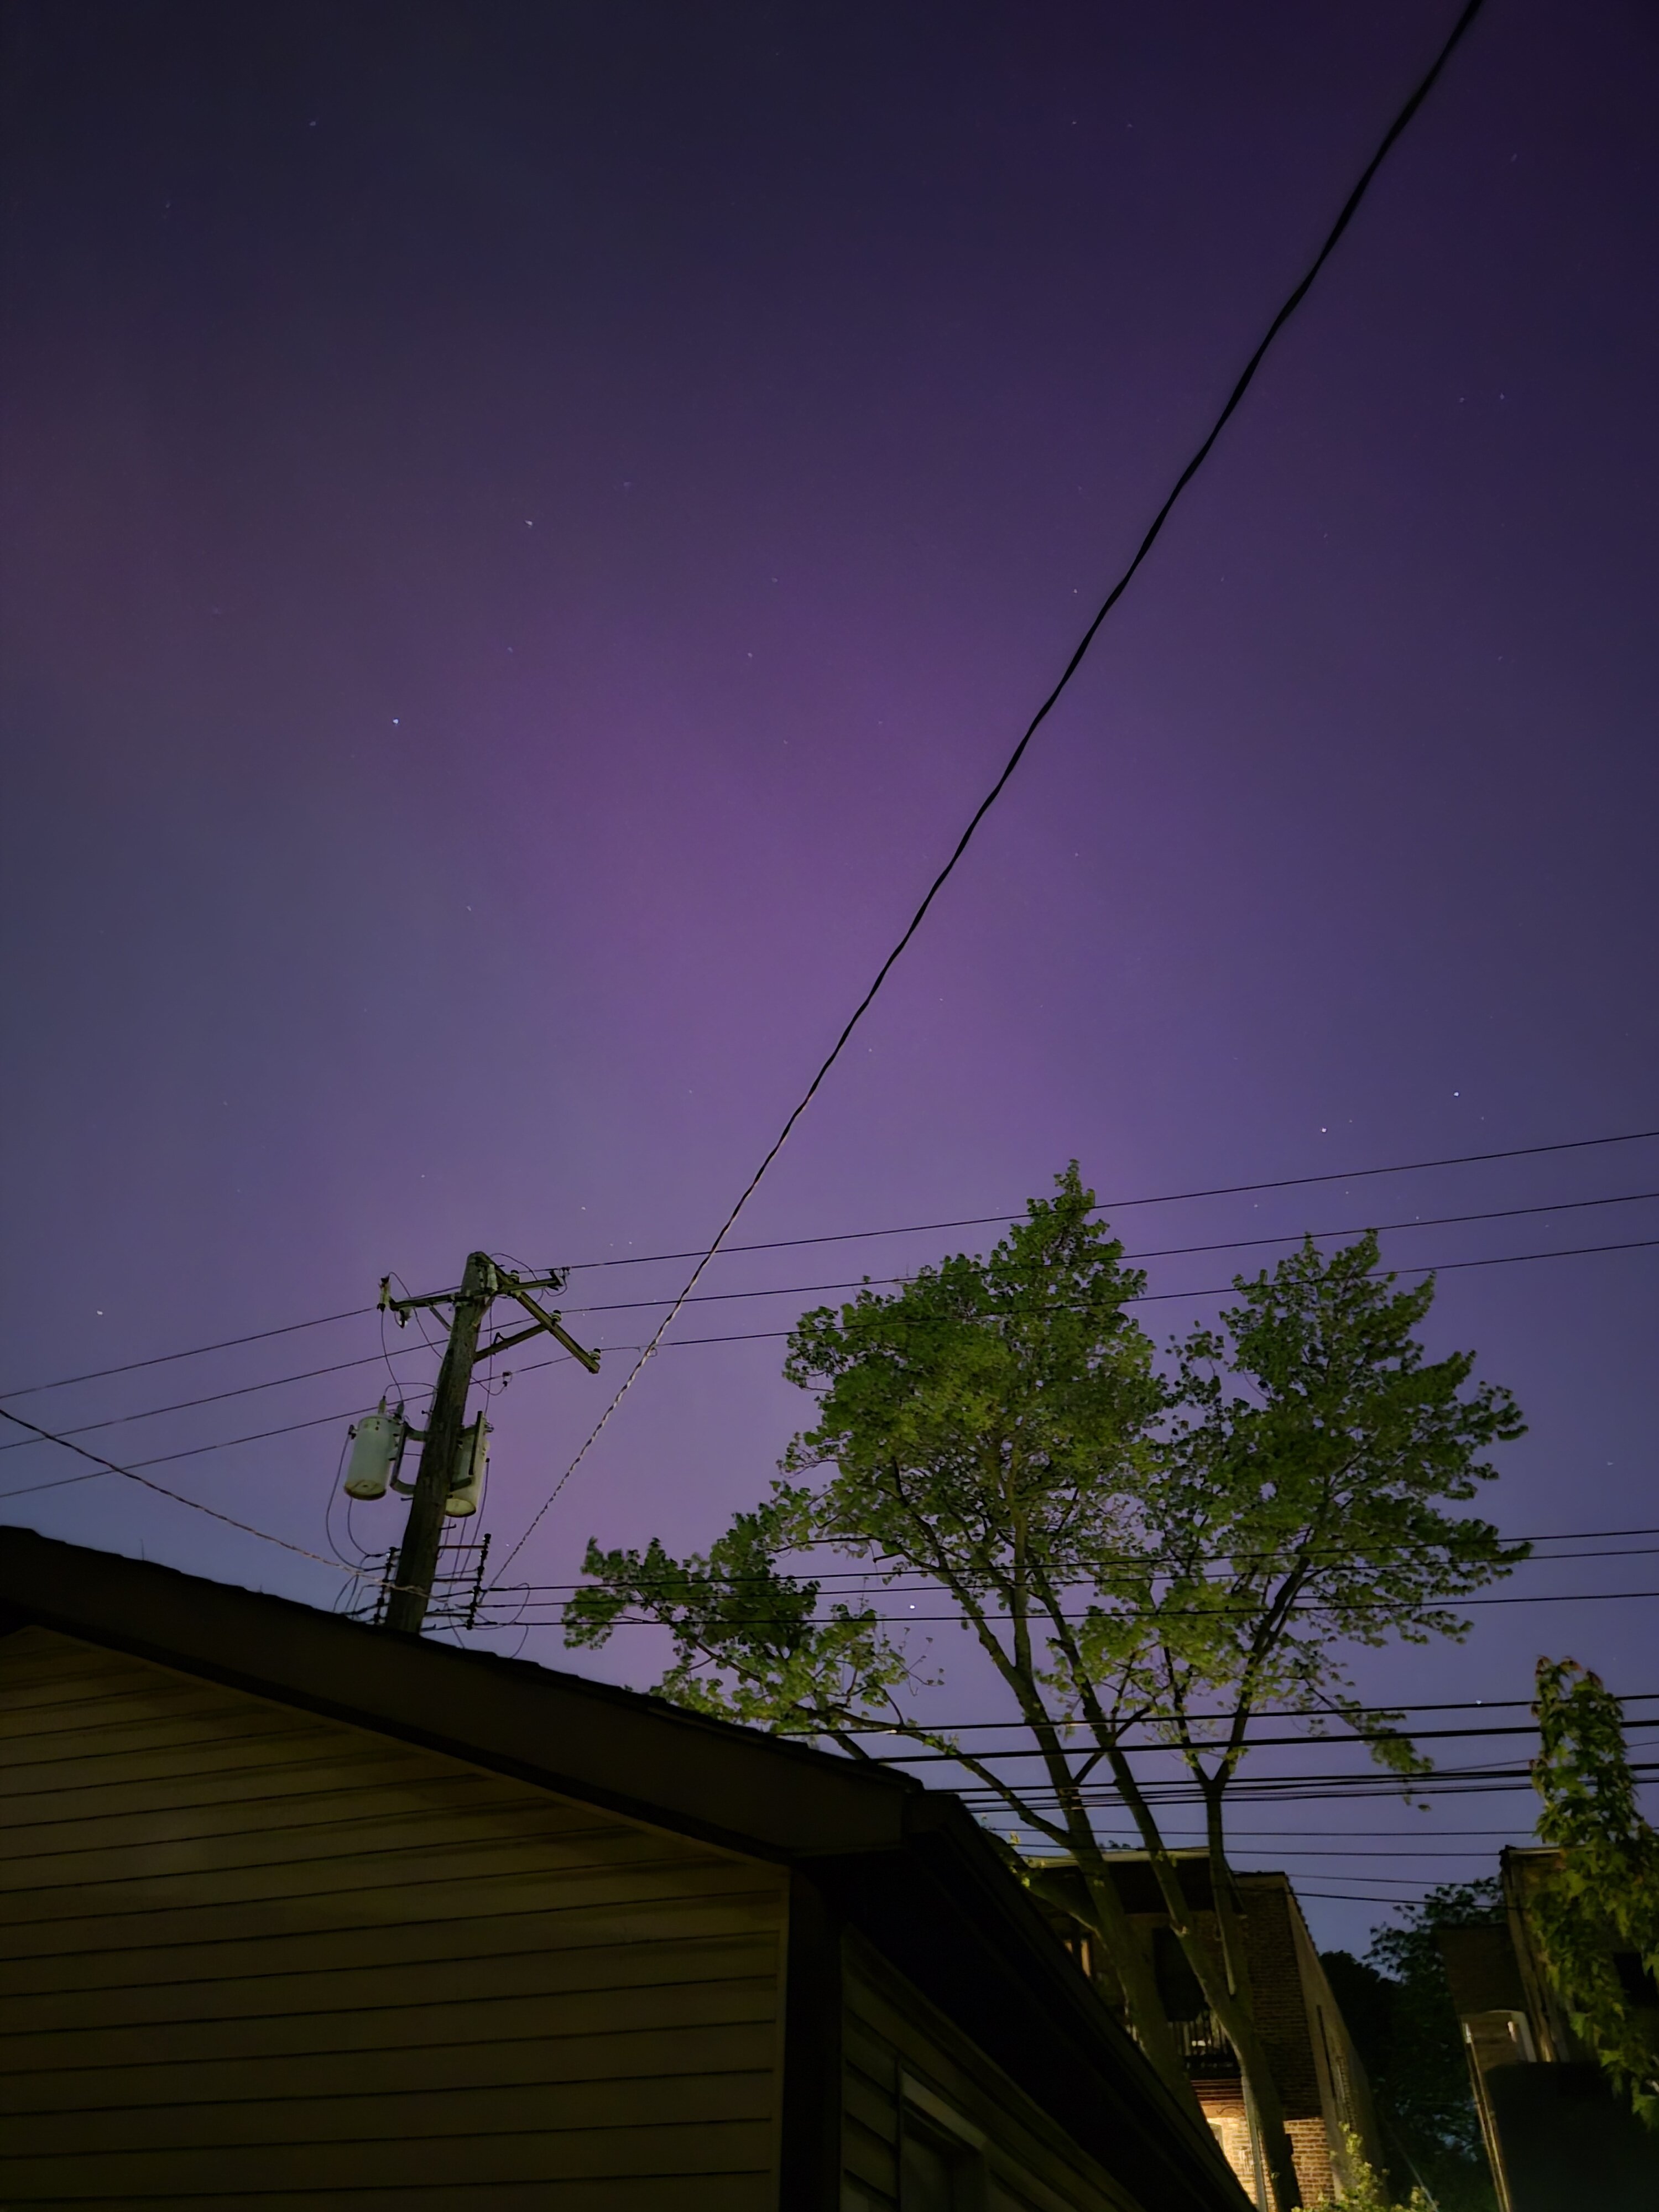
Wow they were even visible in Chicago! Didn't think I would ever see them outshine the light pollution and have them in my own backyard
-
6
-
-
On 2/1/2024 at 2:21 PM, Danny8 said:
Looking like a good thing I was in the UP mid-January this year. You'll have to give us a snowpack update in 10 days or so
So how are things looking in the UP @weatherbo and @wishforsnow? Any trails open at all?
-
1 hour ago, wishforsnow said:
It feels like early April here. Dirty snow banks everywhere. My roof is completely melted off. The animals are acting like it is April. Wonder If the snow statues will hold up for MTU winter carnival. Snowmobiling is on hold. The trails are nothing but rock. There is no base before the big snow early January.
Looking like a good thing I was in the UP mid-January this year. You'll have to give us a snowpack update in 10 days or so
-
2 hours ago, Brian D said:
At the top of that graphic is what I'm expecting in my area. LES event underway right now, especially around Silver Bay to my NE. Radar showing an area of mod/hvy snow right where that bullseye is on the storyboard below. Modelling did a good job this time around.

Interesting! Definitely not the usual lake effect snow location, see it on the northwest shore of the lake
-
2
-
-
18 minutes ago, TheClimateChanger said:
Lowest Minimum temperatures [records in bold]
31F on 5/30 - Third lowest
I think you have the date wrong? ORD was 91/59 on May 30th


July 2025 General Discussion
in Lakes/Ohio Valley
Posted
It has been quite humid and uncomfortable in my option. But I’m a couple miles off the lake. Have only had a couple days I could have the windows open since June 20th