

wxmvpete
-
Posts
29 -
Joined
-
Last visited
Content Type
Profiles
Blogs
Forums
American Weather
Media Demo
Store
Gallery
Posts posted by wxmvpete
-
-
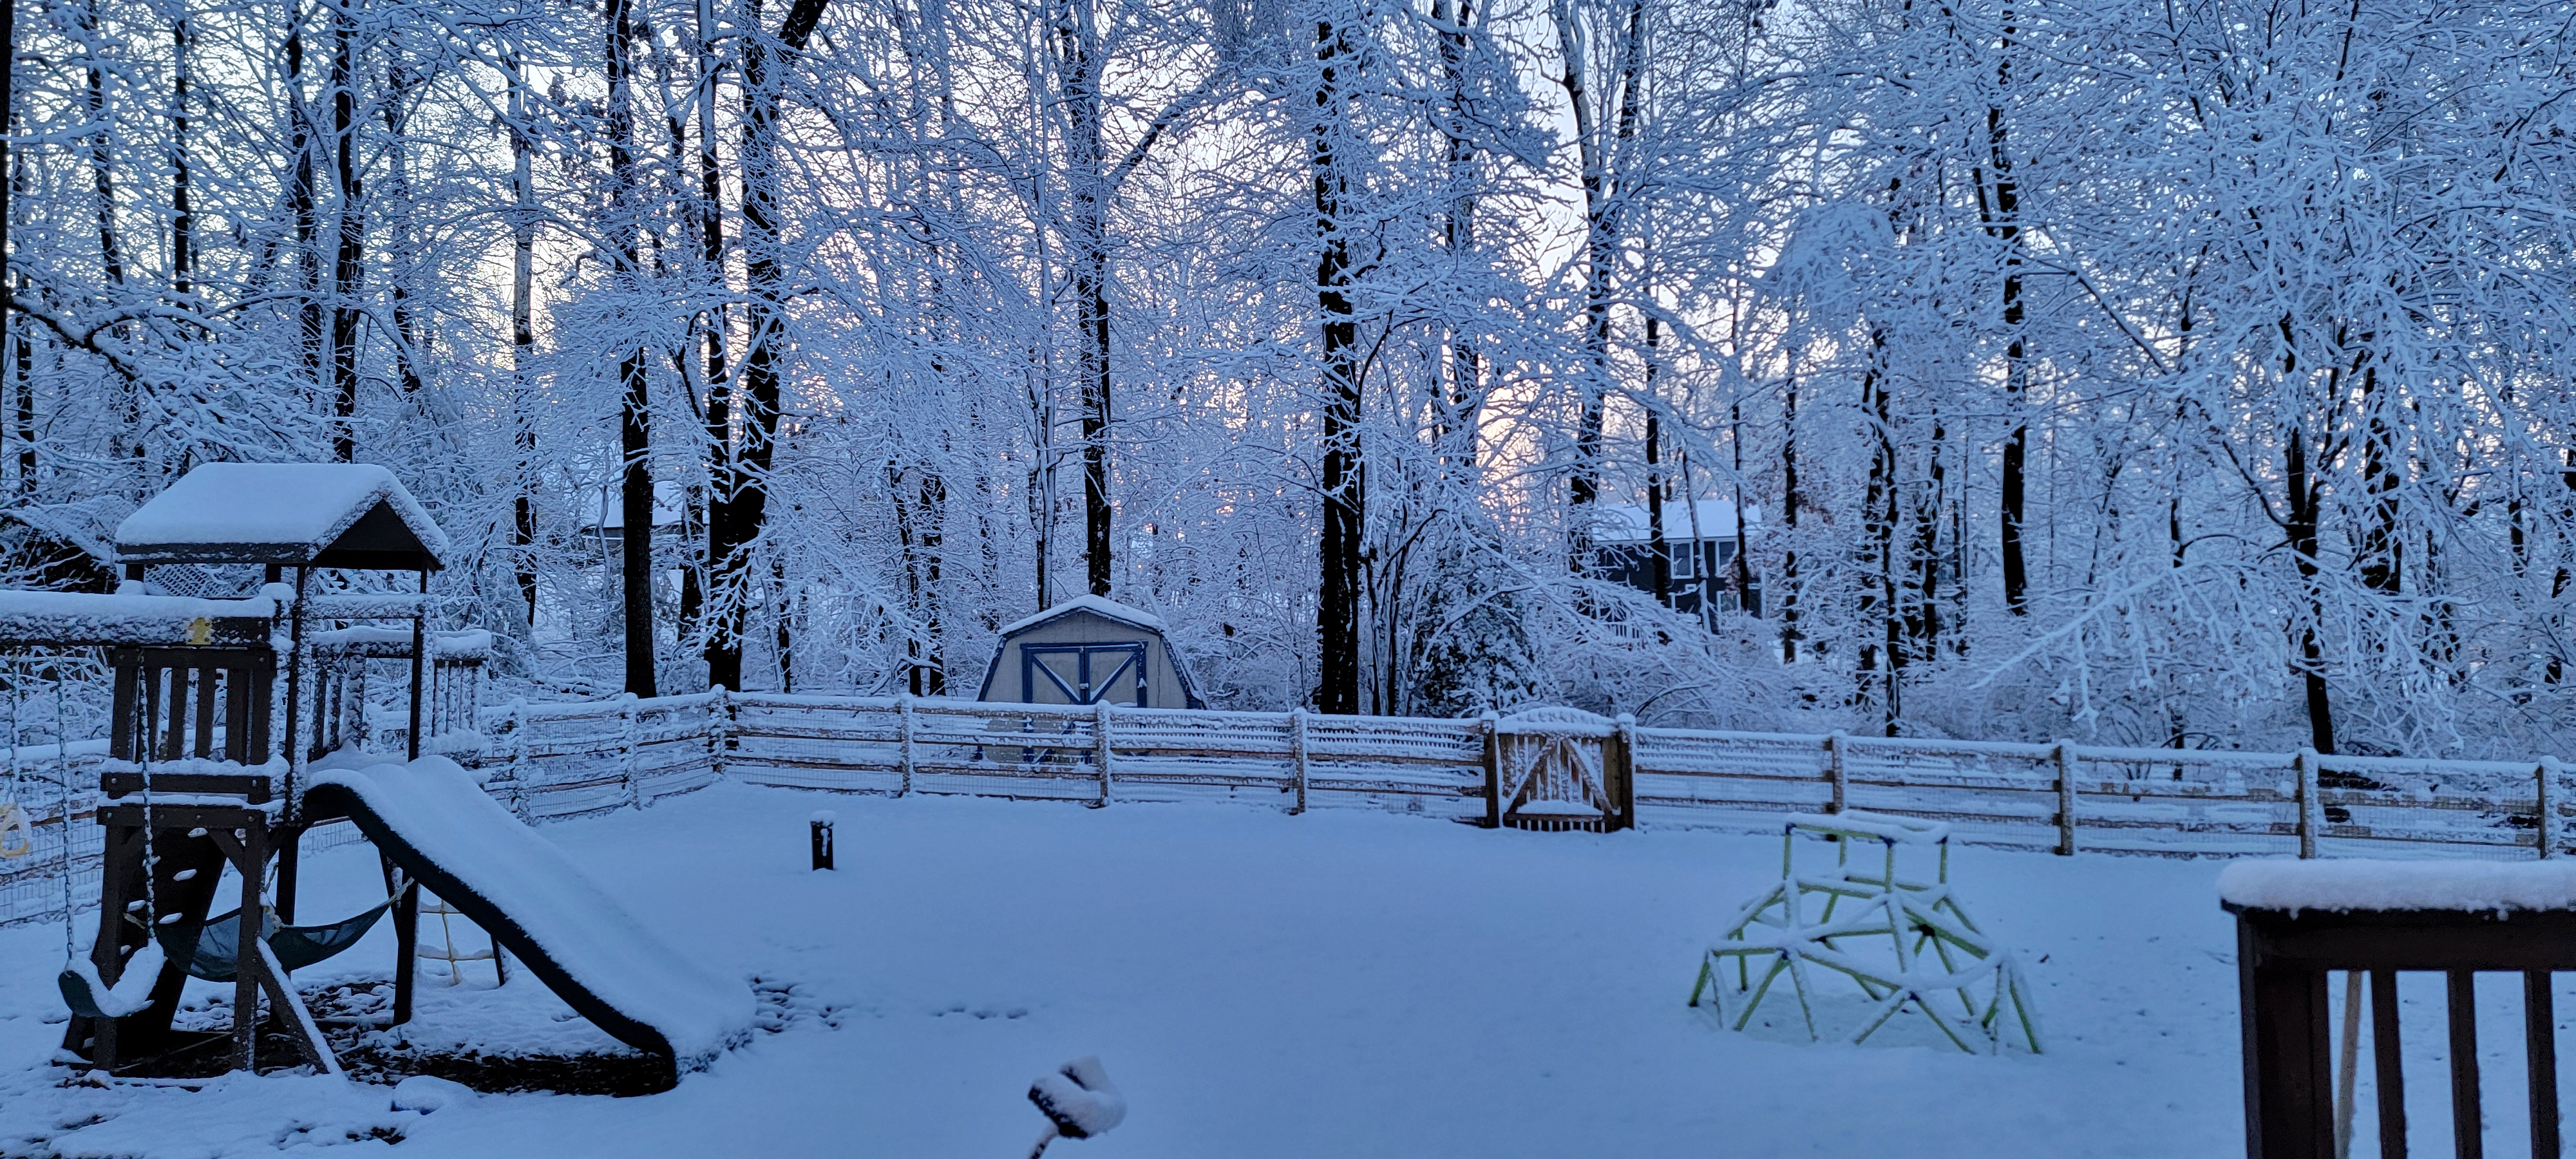
Got about 1.25" northeast of Westminster so far and sitting at 24F.
-
 2
2
-
-
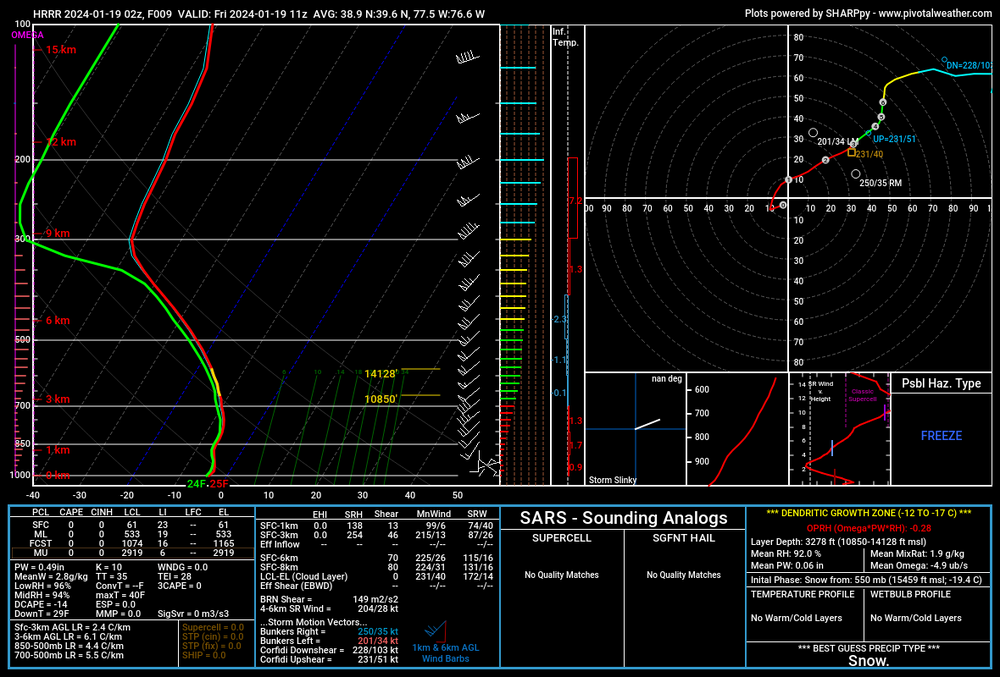
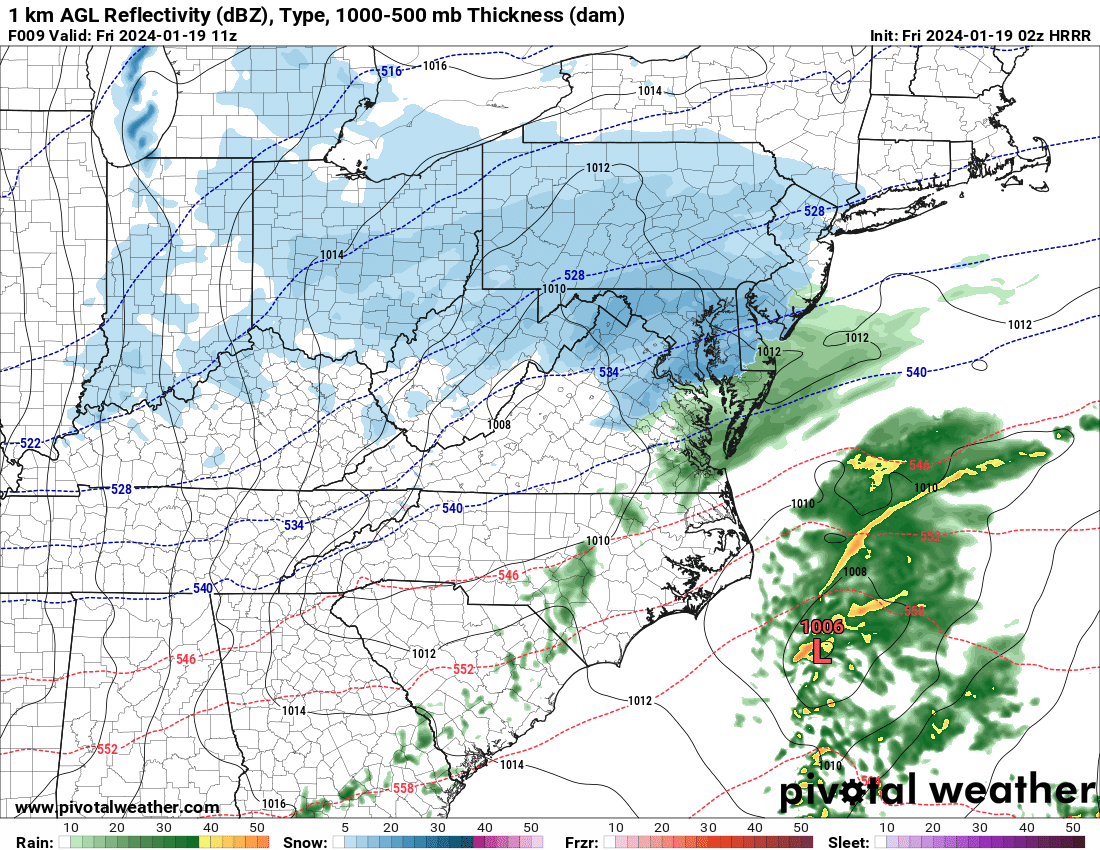
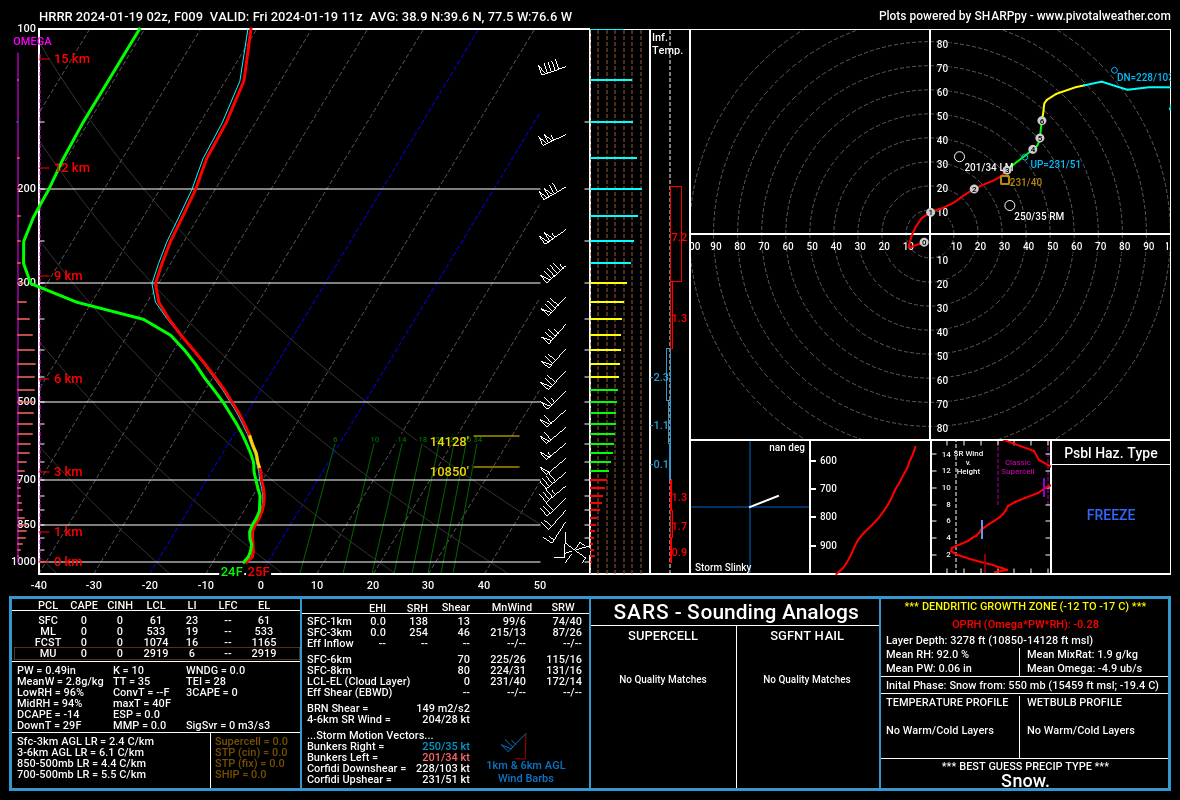
Latest 02Z HRRR at 6AM-- area averaged sounding including most of the DCA-BWI corridor shows a sufficient sounding for some great looking dendrites. We've had more saturated soundings, stronger omega, deeper DGZs in bigger events, but this will still produce some locally heavy snowfall rates and lead to some pretty tough travel conditions. Looks like snow lovers will want to enjoy this one. May not get another real good shot at this again for several weeks.

-
11
-
 2
2
-
-
9 minutes ago, WxUSAF said:
^my interpretation of 10:1 vs Kuchera going off those maps is that, like @Bob Chill was saying, any snow that falls later in the afternoon is high ratio fluff. Main round is basically 10:1.
Absolutely. For just about everyone along and west of I-95 (including the metros), WPC 6-hr averaged SLRs are 10-12:1 generally between 06-12Z, but 12-18Z are 13-15:1 (Catoctins could approach 16:1), then 18-00Z tomorrow are 15-17:1. Question becomes how much moisture & lift can stick around the region that late.
-
8
-
3
-
-
8 minutes ago, MillvilleWx said:
I like 3-5” for your hood at your elevation. I think people like you, @HighStakes @psuhoffman up there towards the M/D should do pretty well with this one! Be sure to add a max right over your house if you’re doing the Winter Desk

Josh is on the grids today and I'm the afternoon winter shift, so I'll shoot him a message
")
-
5
-
 1
1
-
-
6 minutes ago, MillvilleWx said:
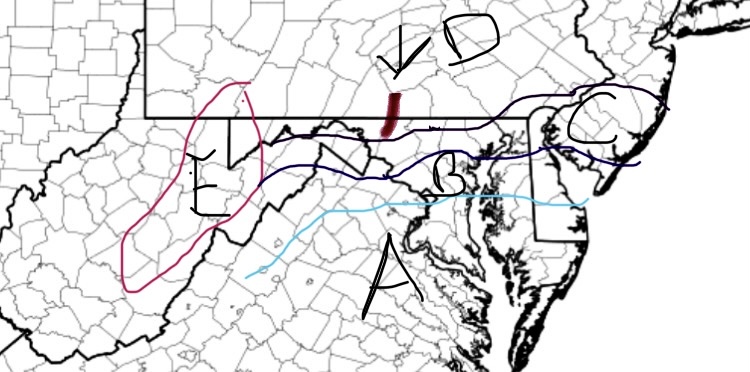
Thought this would be a good time to make a rudimentary snow map for ole times sake. Apologies for the crude map design. Doing this on my phone, but still works good enough. Each area is a zone with a first call forecast. Might have a few edits later, but this could very well be my only call.
Forecast
Zone A: Nothing-1” (Trace begins north of Potomac latitude); Up to 2” possible if everything breaks right
Zone B: 1-2” w/ max to 3” if everything breaks right
Zone C: 2-4” (Highest across Parrs Ridge; elevations >600’)
Zone D: 2.5-5” w/ local max of 6” (Highest along the M/D Line and elevations >850’. Lowest in elevations <275’ in valleys)
Zone E: 5-10”
Catoctins: 4-6” w/ max to 7”
Living on the edge of your Zone C and Zone D. I'd happily take another 3" as would my kids!
-
3
-
-
2 minutes ago, wxmvpete said:
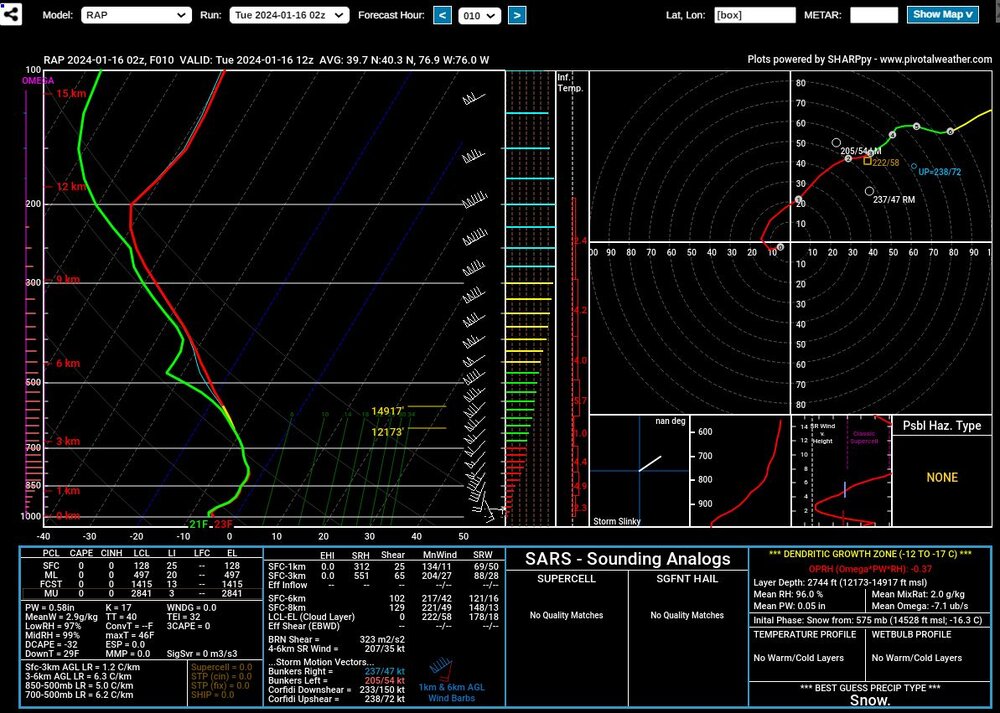
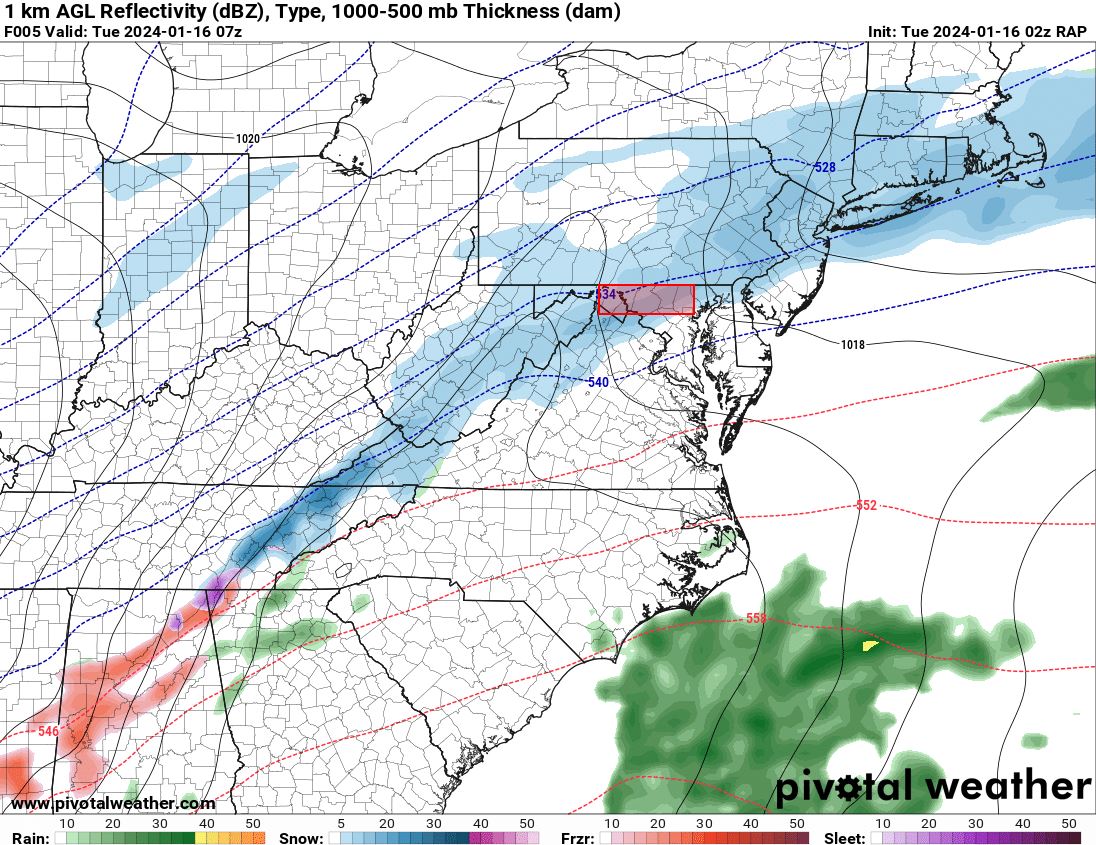
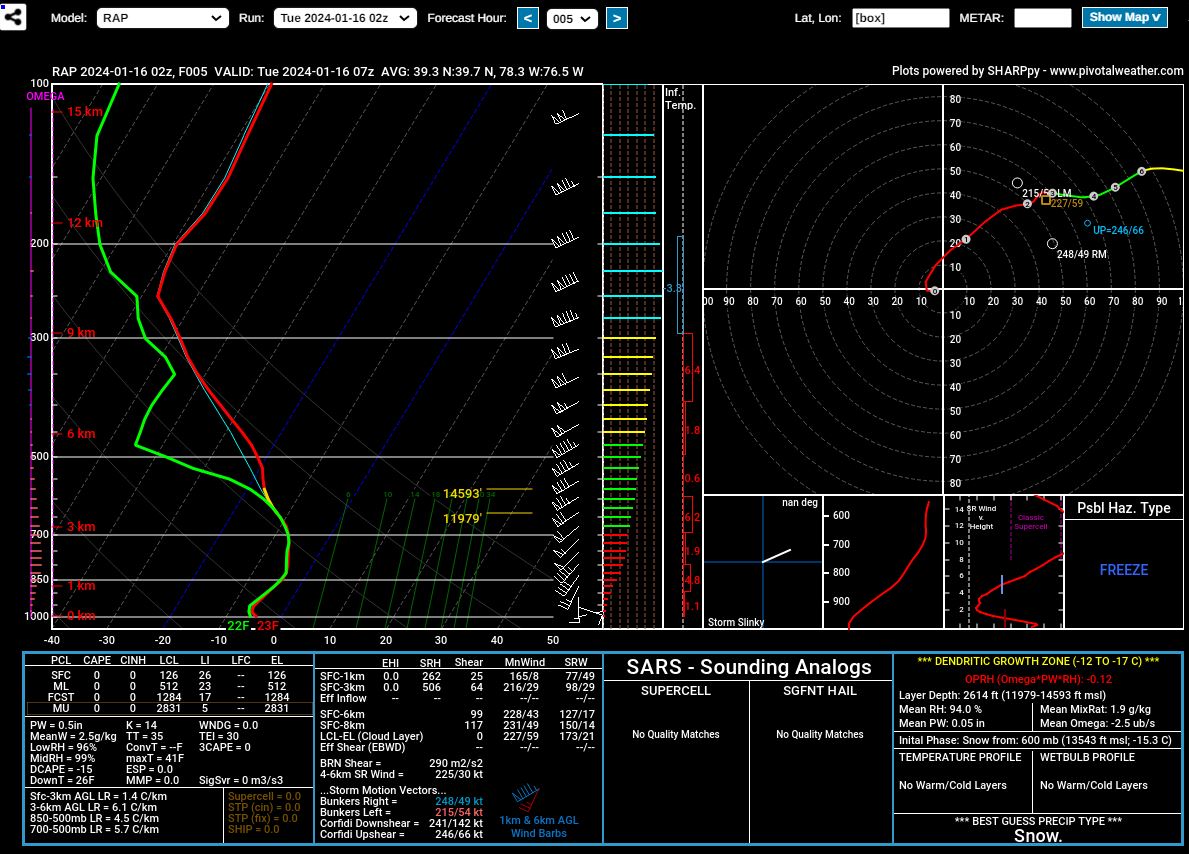
Yep good catch, that is probably the primary reason this band isn't a bigger 1-2"/hr setup. The lowest layer of the DGZ on down to the boundary layer is sufficient to give folks an advisory level event (pockets of warning criteria still possible). You want that DGZ zone layer fully saturated with strong VVs. Still, this is enough to produce a nice event here.

However, take a look at early this morning up near the Lower Susquehanna Valley- that sounding regains some of that moisture at mid-upper levels with increasing VVs through the depth of the column. That could be pretty impressive over eastern PA if that can materialize Tuesday AM.
-
3
-
1
-
-
7 minutes ago, wxmeddler said:
500mb dry slot coming in and killing the DGZ RH. Plates and columns rather than dendrites.
Yep good catch, that is probably the primary reason this band isn't a bigger 1-2"/hr setup. The lowest layer of the DGZ on down to the boundary layer is sufficient to give folks an advisory level event (pockets of warning criteria still possible). You want that DGZ zone layer fully saturated with strong VVs. Still, this is enough to produce a nice event here.
-
2
-
1
-
-
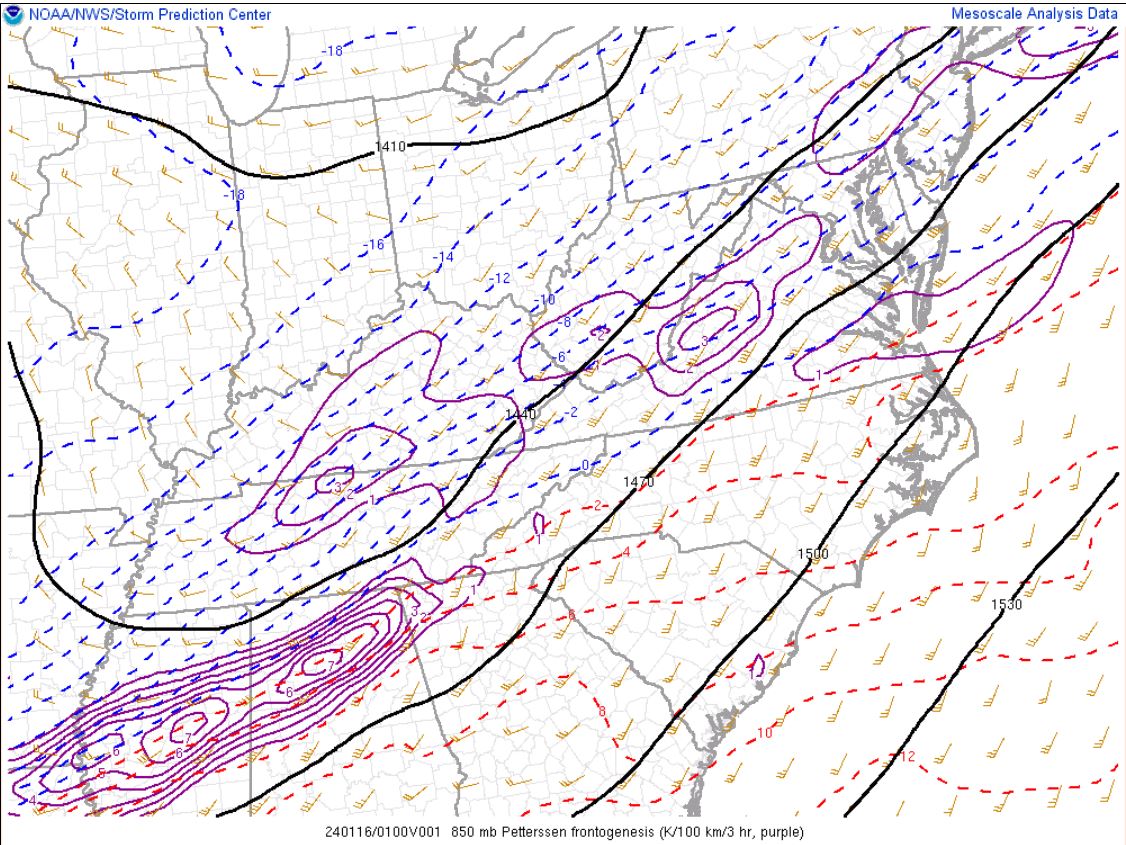
2 minutes ago, wxmvpete said:
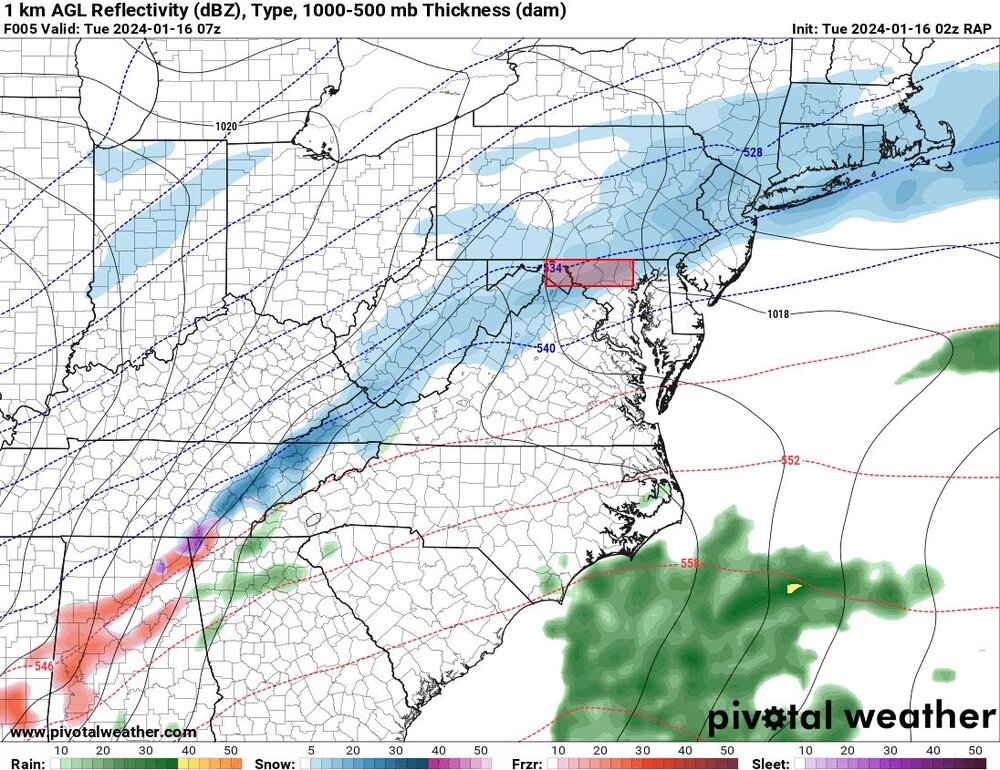
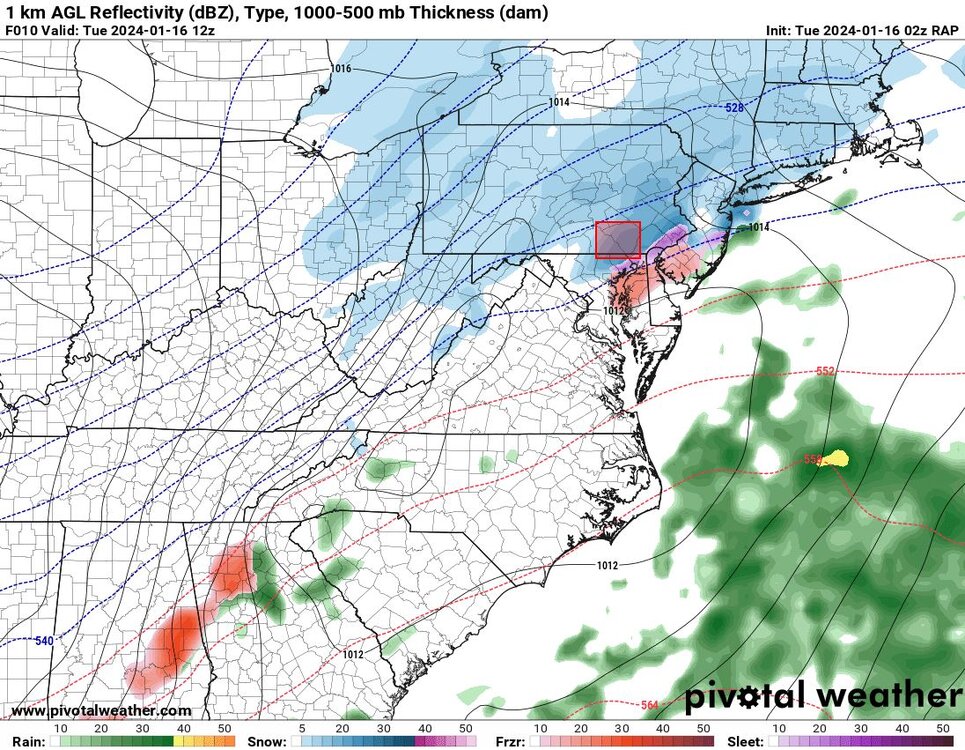
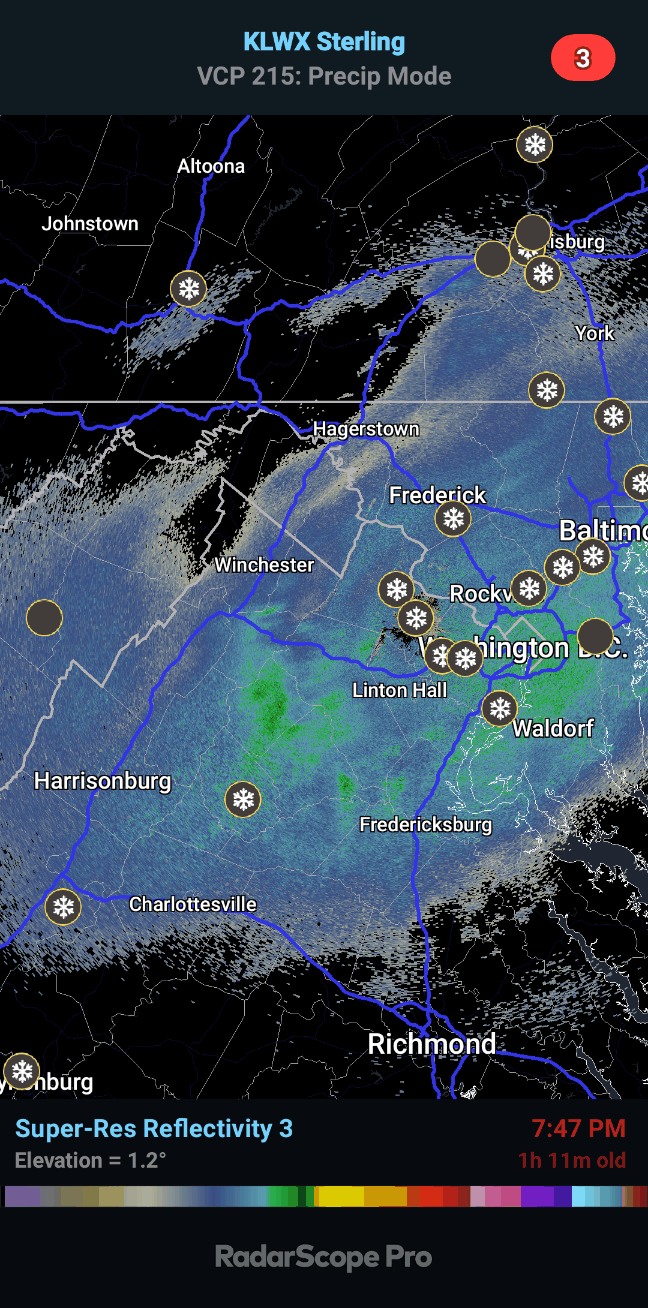
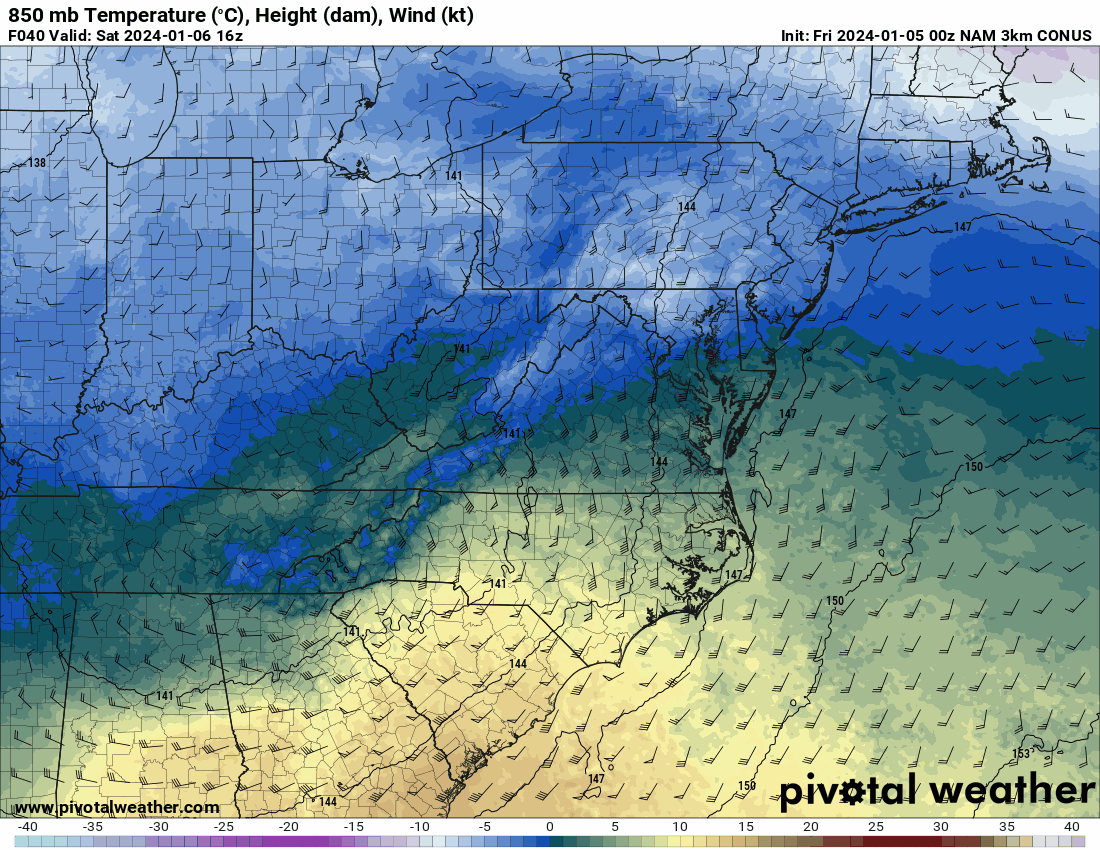
850mb warm air advection continues to increase with 850mb frontogenesis that will support a band of heavier snow N&W of DC in the coming hours. What becomes the wildcard is the approach of a 500mb jet streak over the OH Valley overnight. At the nose of the jet, divergent flow atop the atmosphere will support healthy vertical velocities 12Z Tuesday. This is driving the snowier solutions from northern MD into eastern PA. The new NAM seems to feature similar setup.

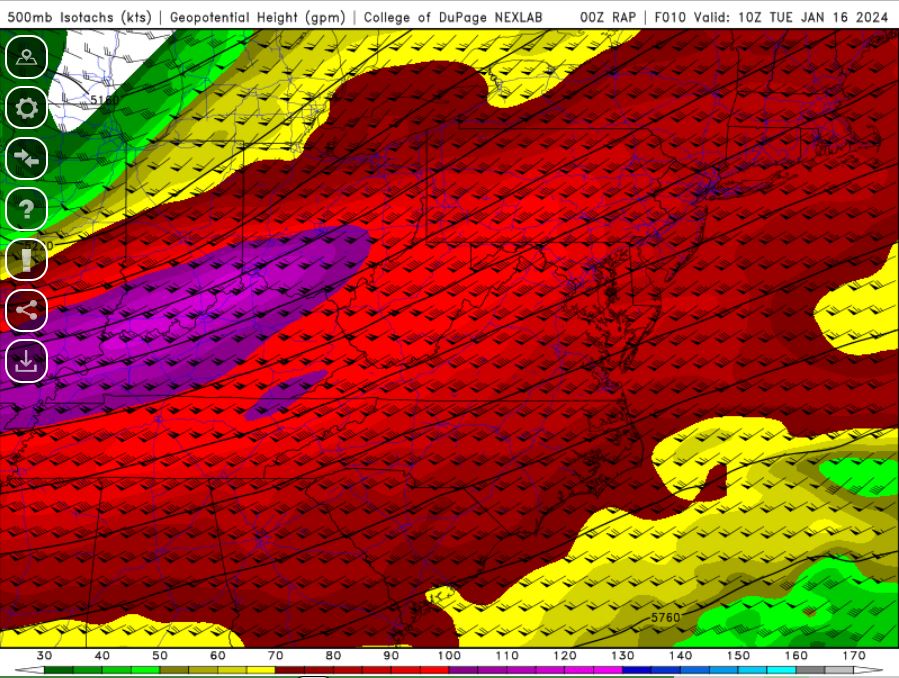
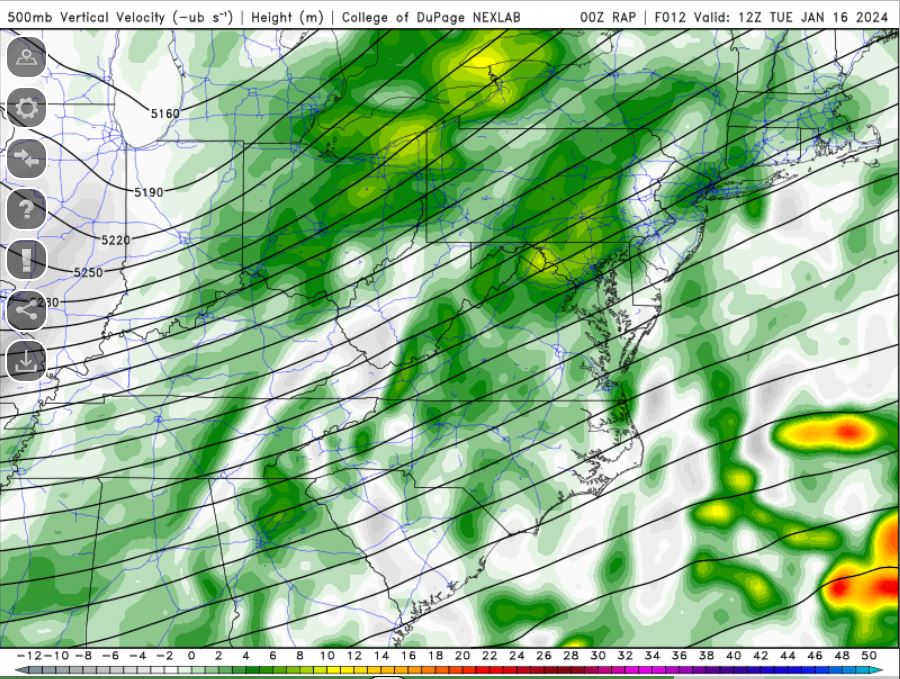
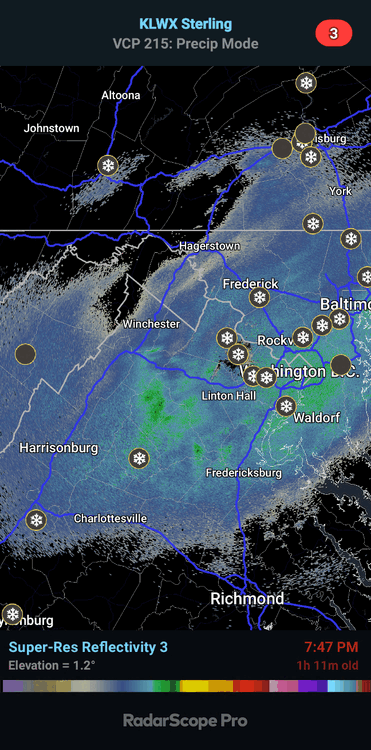
Really starting to see returns filling in at higher radar tilts in western VA. What originally featured drier returns around 4,800ft out near the I-66/I-81 merger (around 850mb) is showing brighter returns. For those who have patiently waited in Northern MD, those heavier rates will be realized soon.
-
5
-
3
-
-
850mb warm air advection continues to increase with 850mb frontogenesis that will support a band of heavier snow N&W of DC in the coming hours. What becomes the wildcard is the approach of a 500mb jet streak over the OH Valley overnight. At the nose of the jet, divergent flow atop the atmosphere will support healthy vertical velocities 12Z Tuesday. This is driving the snowier solutions from northern MD into eastern PA. The new NAM seems to feature similar setup.
-
9
-
11
-
 1
1
-
-
2 minutes ago, mappy said:
Measured a half inch in Parkton.
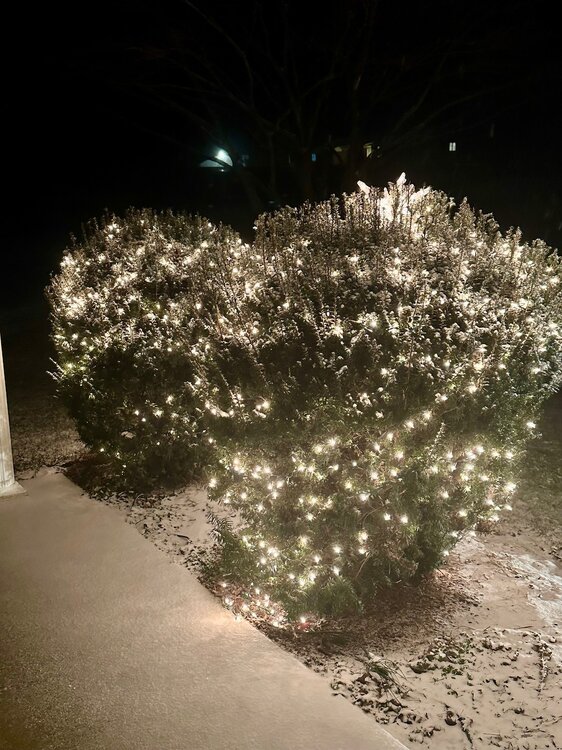
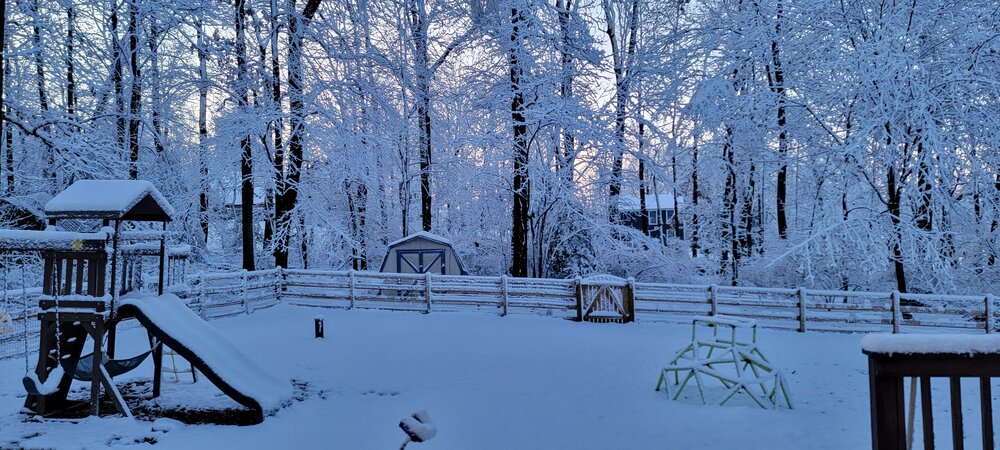
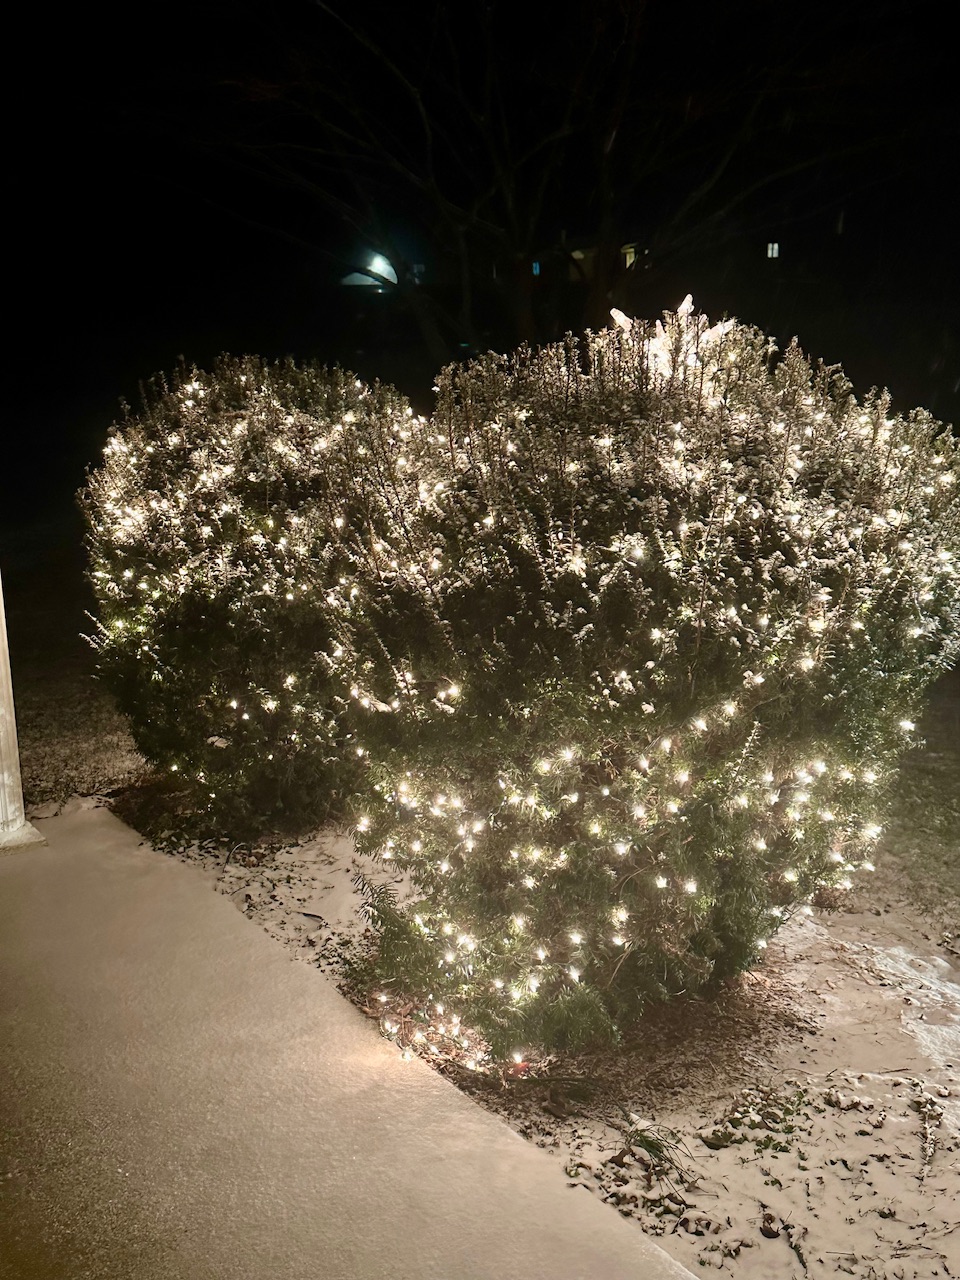
Haven’t gotten a chance to put away our outside Christmas lights. Nice to see them with some snow
I also have a half inch northeast of Westminster. Quite a few cars spun out on the road going home.
-
3
-
-
51 minutes ago, Terpeast said:
Day 5 WPC. Look at when they issued it. They had to have seen the 12z euro before issuing
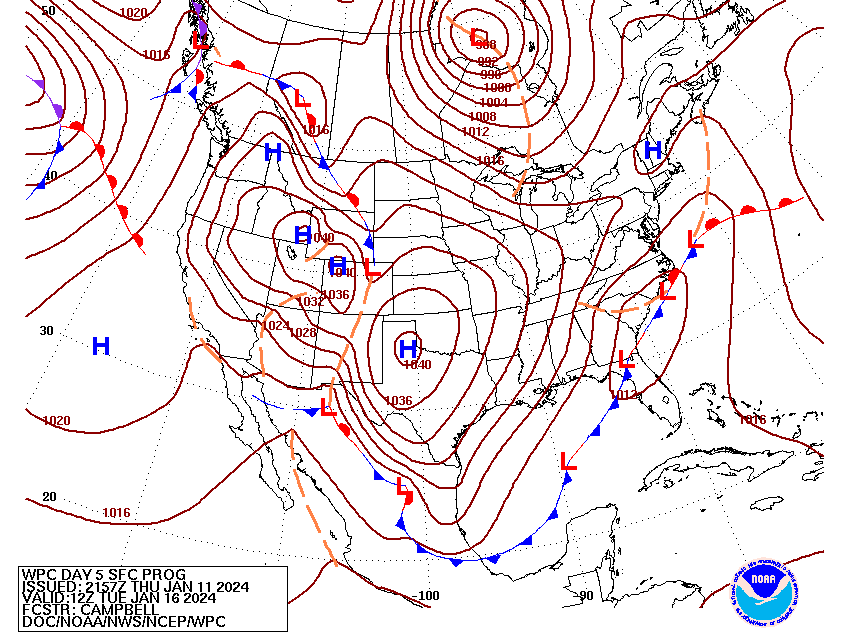
As a heads up, these maps are resent to include our hemispheric fronts created from our Alaska desk. The fronts over the CONUS by our day shift medium range forecaster (Rausch, if you look at the Fronts tab on the homepage) is identical compared to this one. The new fronts and pressure from night shift likely won't make the web for a couple more hours, and the overnight forecaster would use the 12/18Z guidance as their foundation for this next set of fronts/pressures forecasts. Usually these fronts and pressures have to be sent out before the new suite of 00Z guidance comes in.
-
5
-
7
-
-
15 minutes ago, wxmvpete said:
May be pulling up xmACIS to check what they did.
January 2014 event- the week before KIAD got 8.5". For those dates, cold with 0.3".
January 2011 dates- KIAD 1.2"
January 1992 dates-- cold and dry
March 9-10, 1960 dates-- 5.8" at DCA (Bigger storm here to open that month)
March 11-12, 1960-- cold and dry at DCA
December 11-12, 1958-- cold and a Trace at KDCA
March 24-25, 1940-- cold and a Trace in DC
January 23-24, 1940-- big storm, 9.5" in DC and cold
January 29-31, 1936-- Cold and 0.2" in DC
December 28-29, 1935-- Cold and 6.3" of snow in that period.
So we know it's cold, but it can give us a decent event based on the event.
-
1
-
3
-
-
15 minutes ago, WxUSAF said:
Hopefully this includes us
May be pulling up xmACIS to check what they did.
-
2
-
-
5 minutes ago, psuhoffman said:
It is just one run and I’m not expecting it yet BUT I was noting the NAM and euro were hinting at this at 12 and even more 18z. They’ve been trending towards starting to amplify the coastal and develop a closed mid level circulation sooner, thus cutting off that trowal that was killing us. Not sure how far it can go but there were hints it was heading this way before this run.
Ahh it did start to try to hint at it on the 18Z ECMWF. Hadn't gotten a chance to look at it. Will be curious to see if it keeps making that adjustment at 00Z.
-
2
-
-
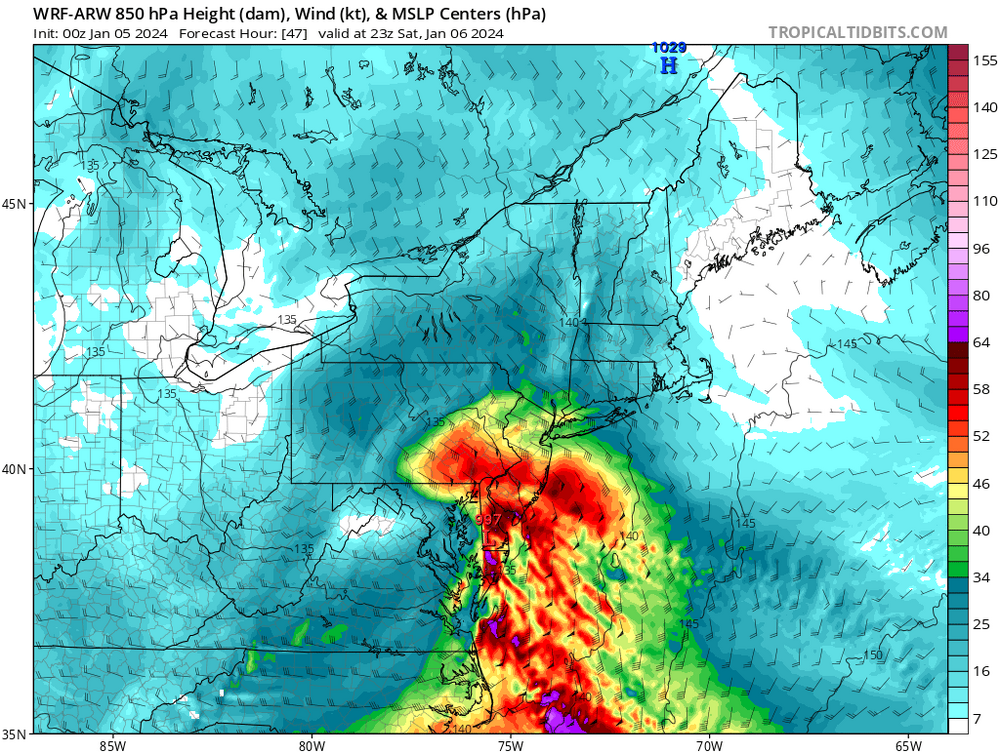
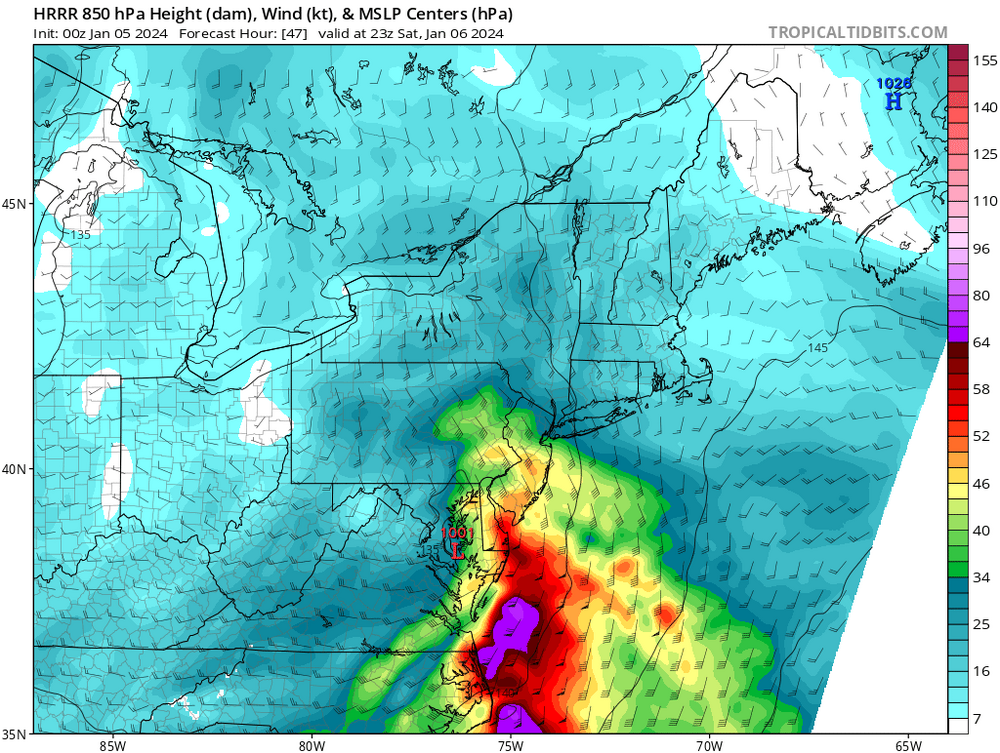
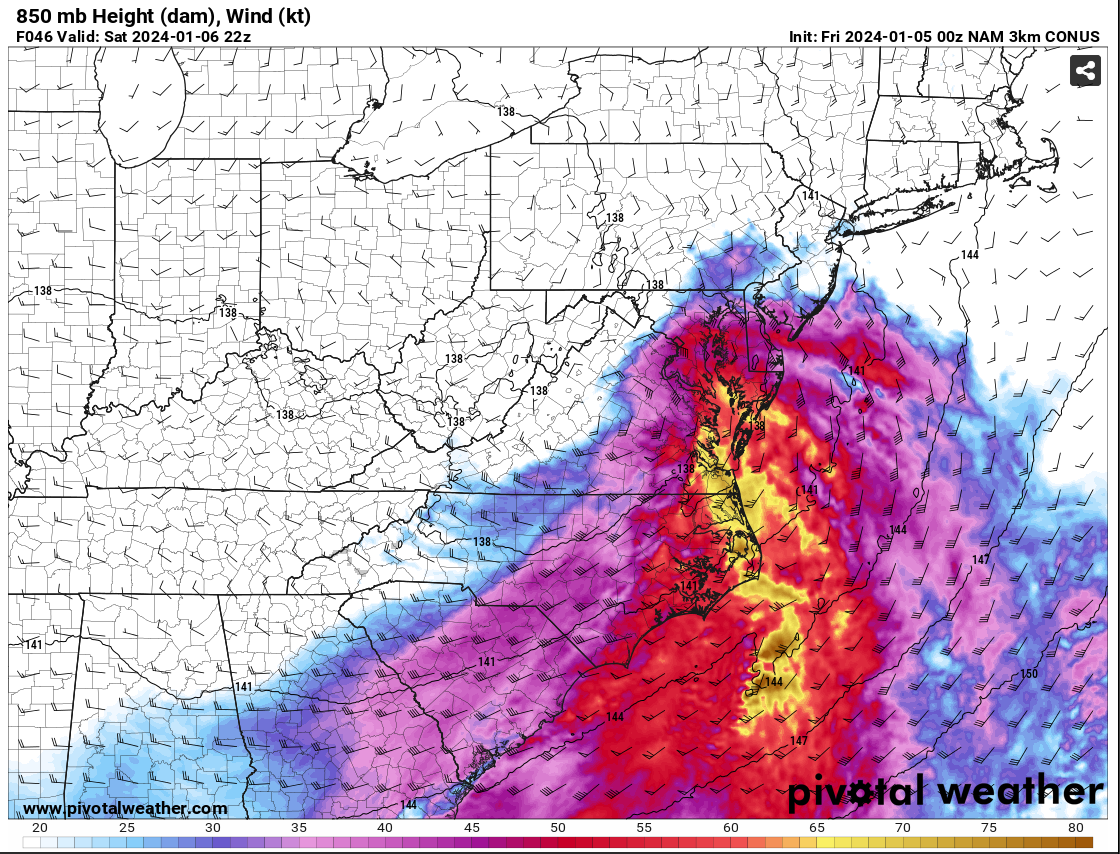
27 minutes ago, MillvilleWx said:
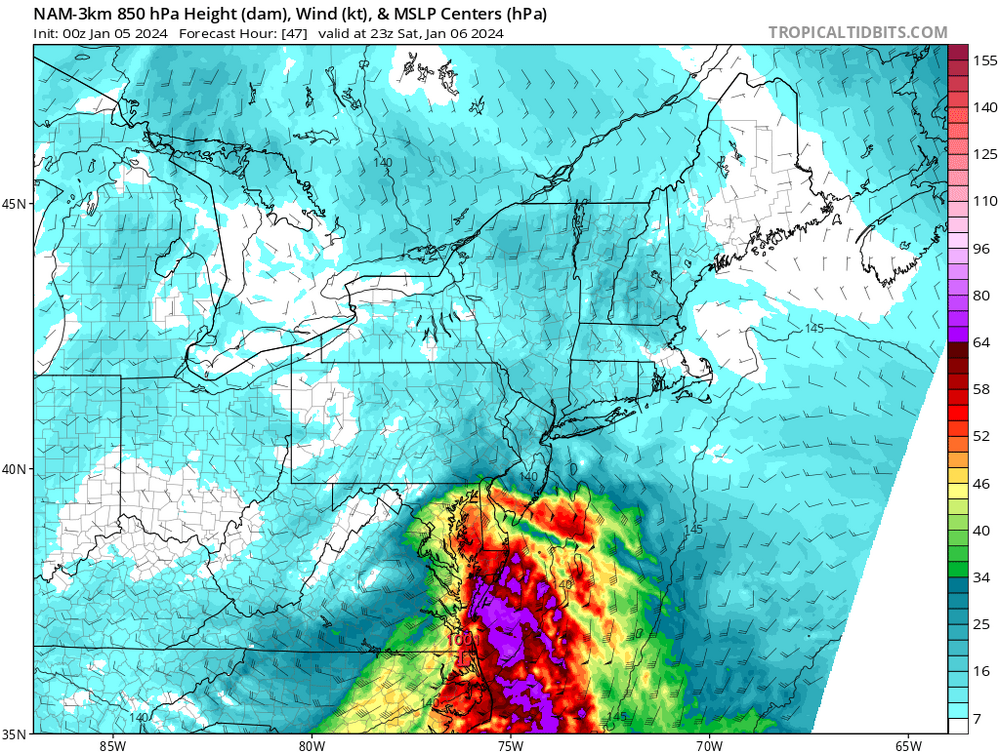
The reasoning for the shift in the colder solution on the NAM is the development of a closed 850mb low tracking south of the Potomac over north-central VA. Pay close attention to the wind barb across the northwest area and how the 850mb southeasterlies hit a brick wall over Parrs Ridge and the wind direction flips. This would allow for cold air to advect into the northern and western side of the circulation creating a more beneficial PBL and keep everything frozen, or even all snow. Check out the wind barbs to the east of RNK...
As a result, watch the 850mb temp profile as we work through time. This is actually how you get surprises and periods of heavy snow when you weren't expecting.

MAJOR CAVEAT.... THIS IS JUST ONE RUN OF ONE MODEL!!!
We are going to want to see other guidance pull this off and have it become something to watch. This could be a one run and done deal, but there is potential for this. I will not be committing anything until I see some agreement from other guidance. It was interesting to see and point out as a possibility. It would affect the forecast in a big way. These are why these marginal events are so tricky. One thing can make or break a forecast. Let's hope it's right. Right now, no changes from my current thinking.
This is a great catch. Just comping a couple other CAMs at 23Z Saturday, the HRRR and ARW remain more southeasterly and don't pinch off that 850mb low as far south as the 3kmNAM. While it isn't to say the 3kmNAM isn't on to something, there isn't any guidance showing an 850mb low evolution quite like what the 00Z 3kmNAM just did. It's something you keep in the back of your mind, but going to need to see it get more support before buying in (and that is assuming if it even still maintains this in future runs).
-
6
-
-
9 minutes ago, high risk said:
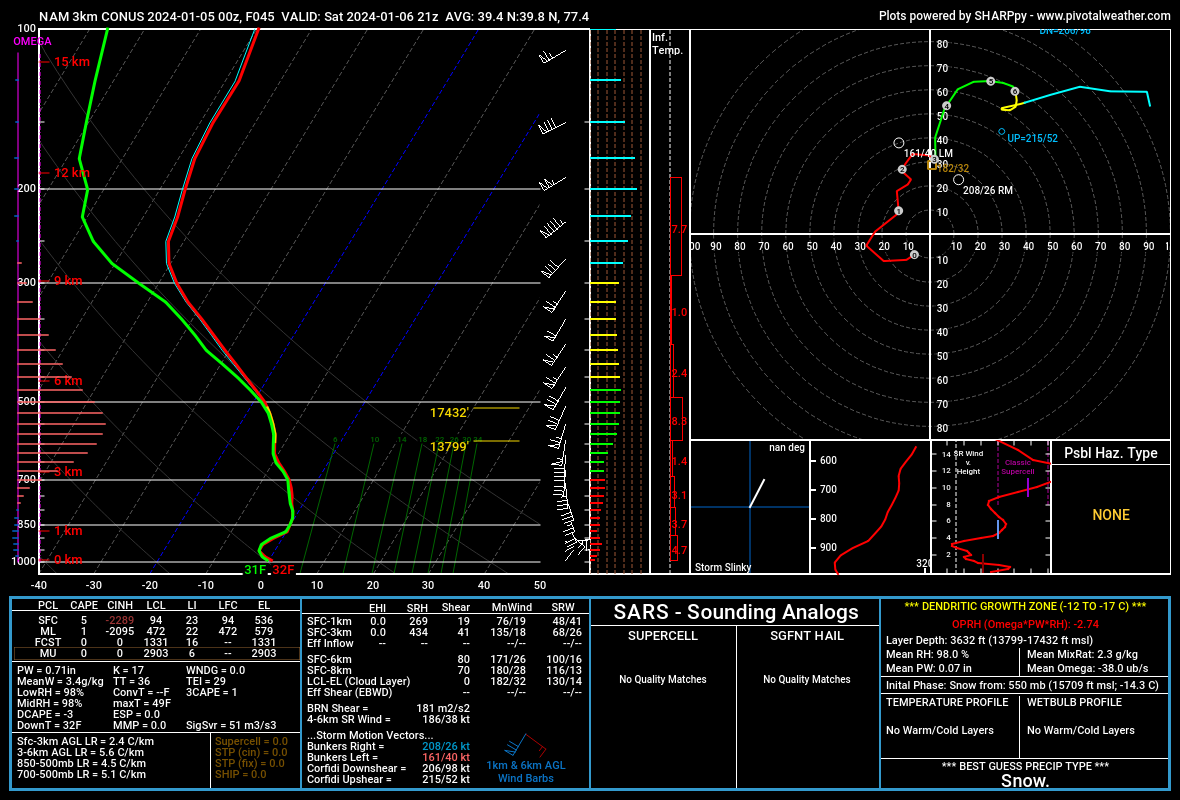
The NAM 10:1 maps look huge even along the I-95 corridor, because even after the precip type maps show rain, the model microphysics are generating sleet which is going into the snow water equivalent tally.. Here is a sounding from the "rain" area:
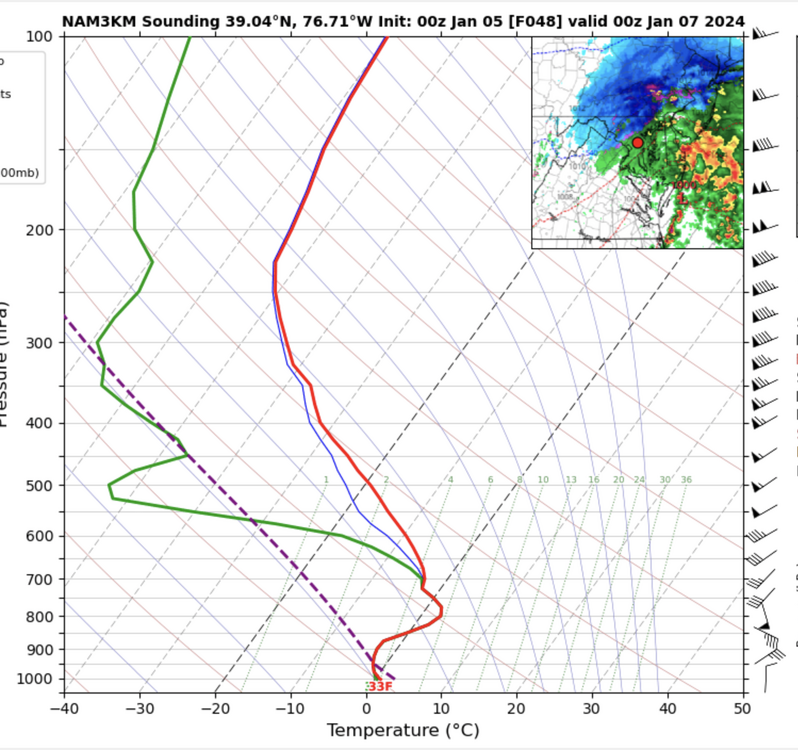
That's heavy sleet. Not saying that the thermal profile will be correct, but it explains the generous 10:1 totals.
Something that has been on my mind, especially for those to the west maybe more along Parrs Ridge, is are we seeing guidance bring that warm nose in as-advertised, but also not capturing just how cold the low levels will be once they wet bulb initially? I can see an avenue that still certainly result in a less snowy regime. But if those N-NE winds at low levels holds, some areas may end up more icy than just rain. That will be worth watching on the CAMs in future runs. And the CAMs will be more included in the WPC PWPF now that we are inside of 60 hours for this event.
-
5
-
1
-
-
5 minutes ago, SnowenOutThere said:
The 3k Nam does the @psuhoffman way to victory and keeps the 850s considerably cooler during that critical 3 hour window, just a tick or two more and even the immediate suburbs would be on the snowy side.

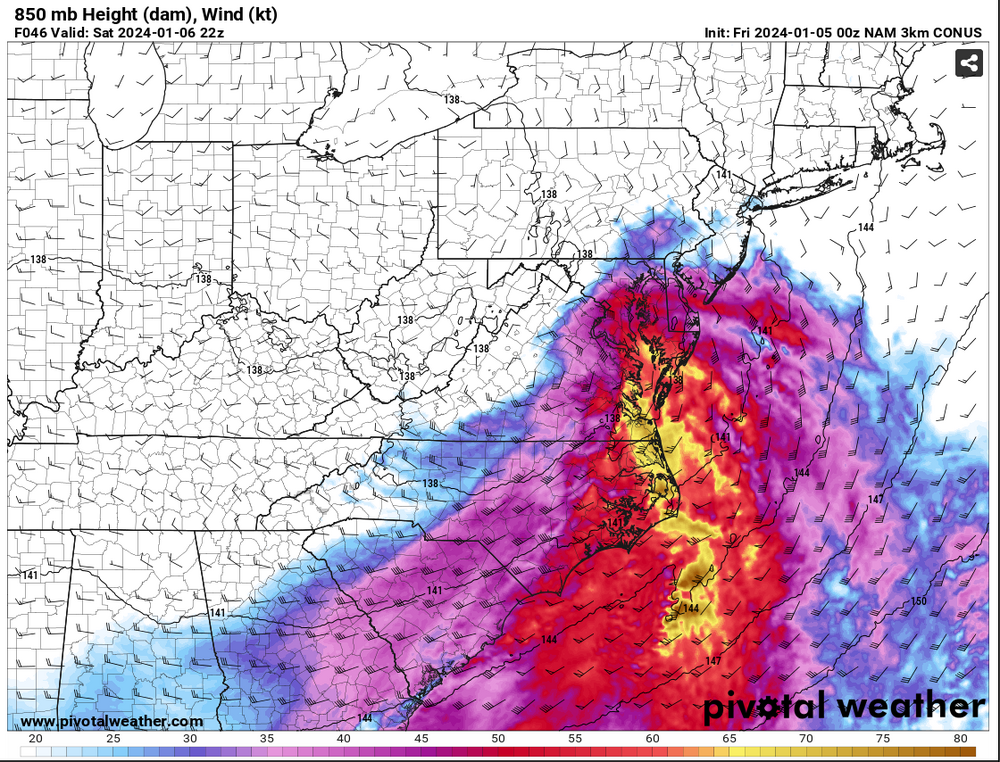
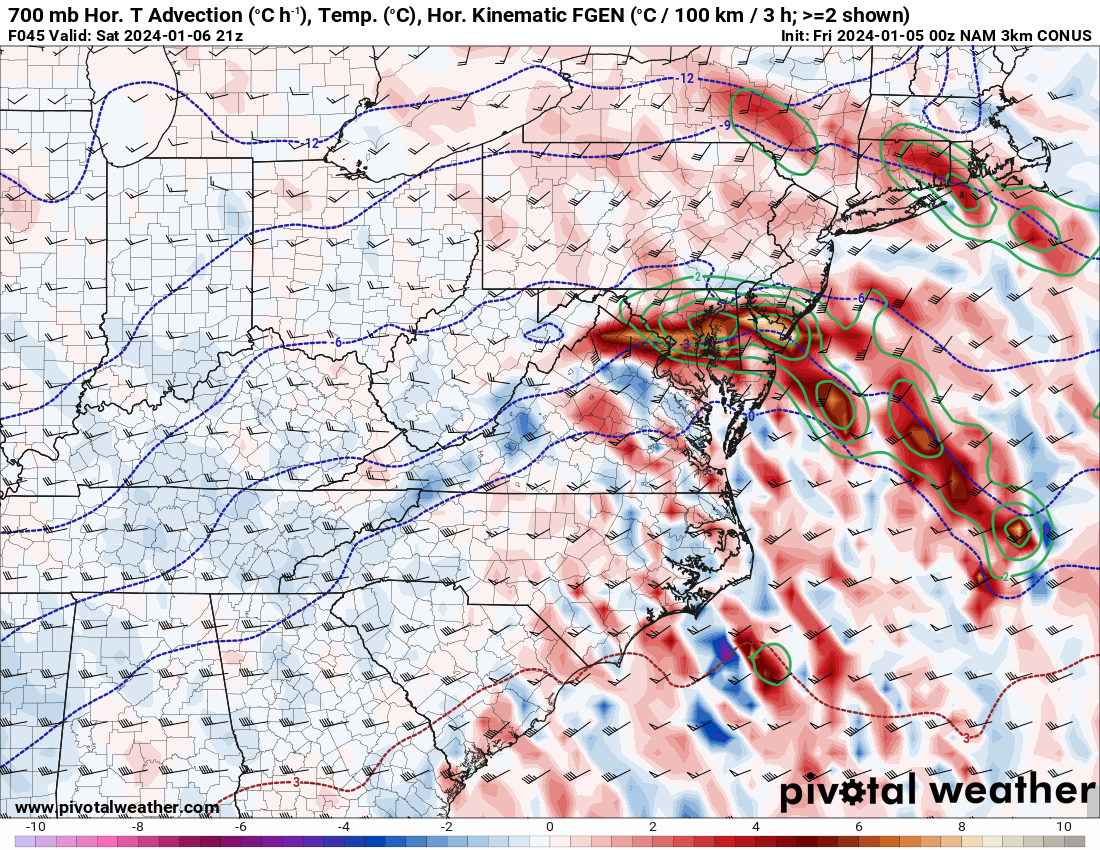
3kmNAM really went full blown NAM'd here. A notable change was the stronger frontogenesis at 850mb and 700mb (attached). Taking a sample sounding (it is basically eastern Frederick County, all of Carroll, and western Baltimore County, as far south as I-70 and on north to the M-D), the intense vertical velocities lineup well with the DGZ. This stronger FGEN held on for a good 6 hour span. This is the way to an over performer. Now, whether that actually occurs or not, well, we still have time to see.

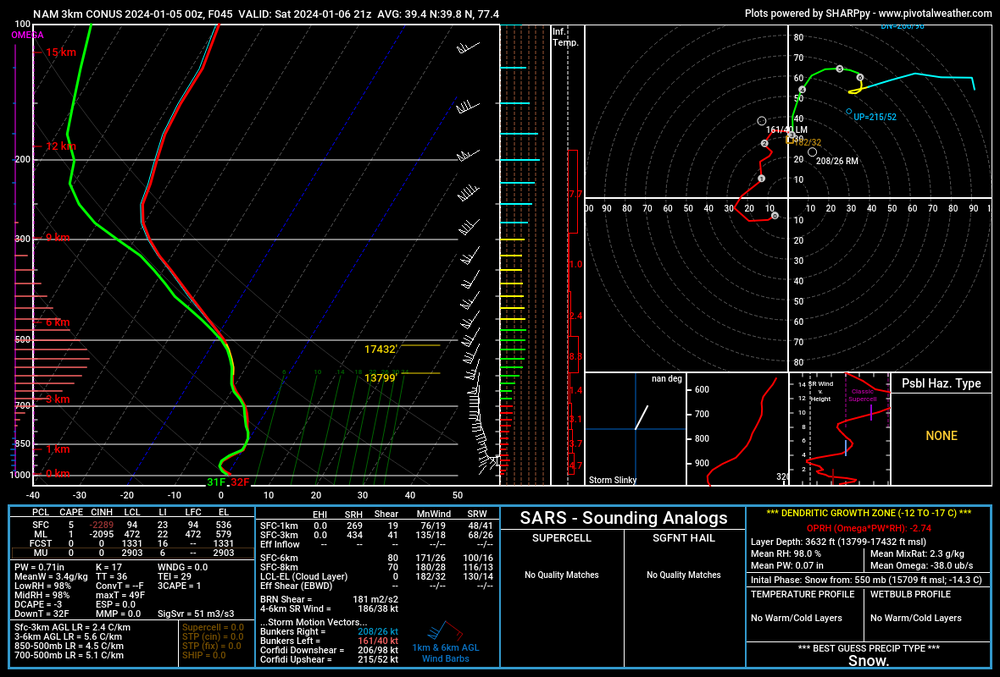
-
8
-
10
-
-
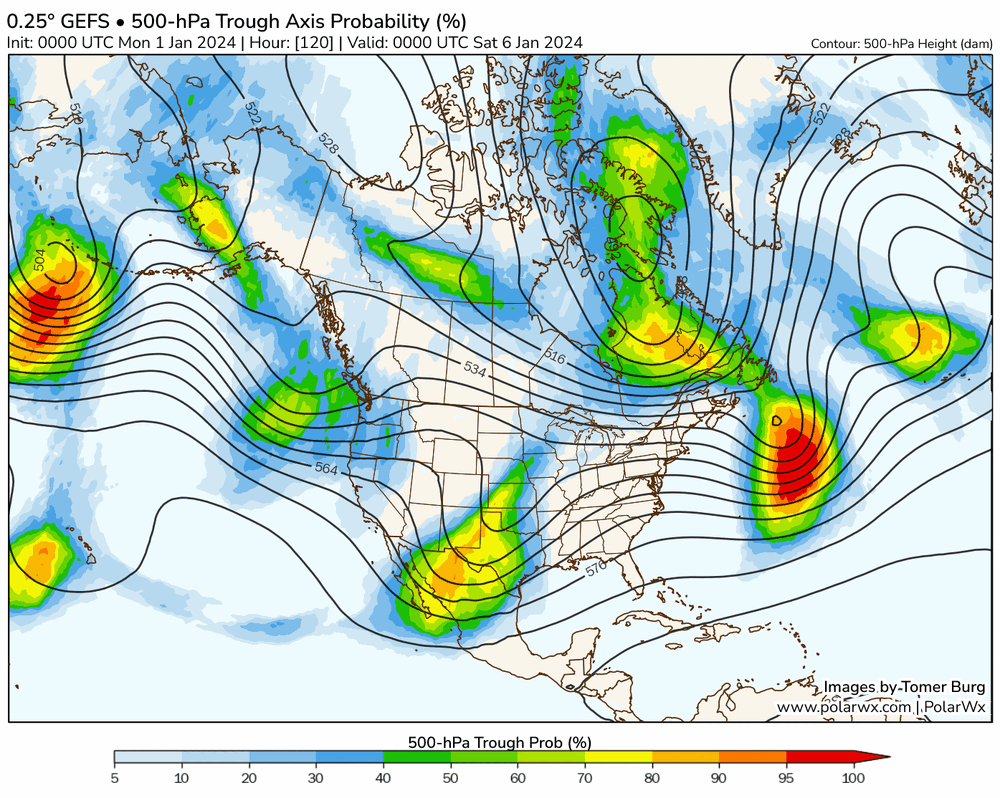
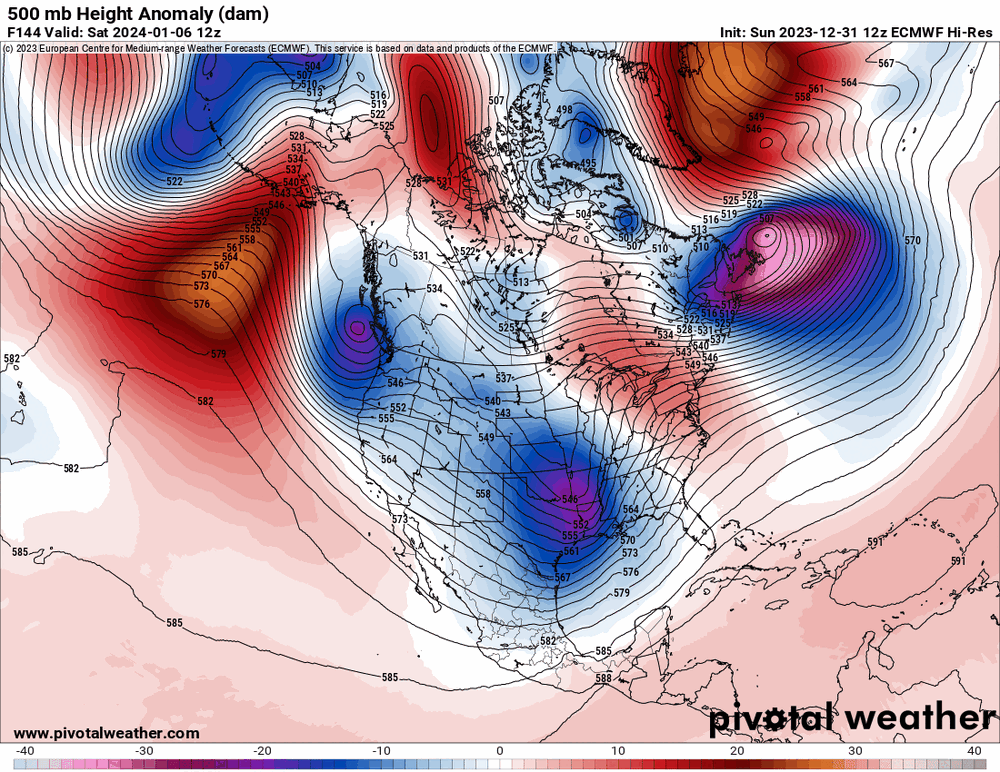
The 00Z trends on paper show a colder/more south solution for the weekend winter storm. But there's still plenty of time for more changes. Just using the GEFS for this exercise. Here is a Tomer Burg plot showing GEFS probabilities for 500mb troughs. It's a good thing to see a lack of even moderate probabilities (topping out around 20-30%) for toughing in Quebec, suggesting the higher probability for confluence there. However, note the primary shortwave trough in the Southern Plains. As was mentioned a couple times on the forum, part of this is less phasing/interaction with a northern stream shortwave. However, some of this signal could also be a signal flattening of the shortwave. Part is this is also growing dispersion in the GEFS (more ensembles showing more and more different potential amplitudes/positions of the trough drowning out the signal), but it likely includes some flatter solutions. We can get away with slightly less amplified features, particularly in an El Nino when the STJ is super charged and these southern stream disturbances are loaded with moisture. However, the need for strong upper level ascent out ahead of the trough is still important in generating both heavier snowfall rates and dynamic cooling.
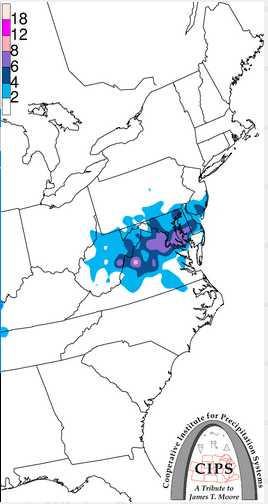
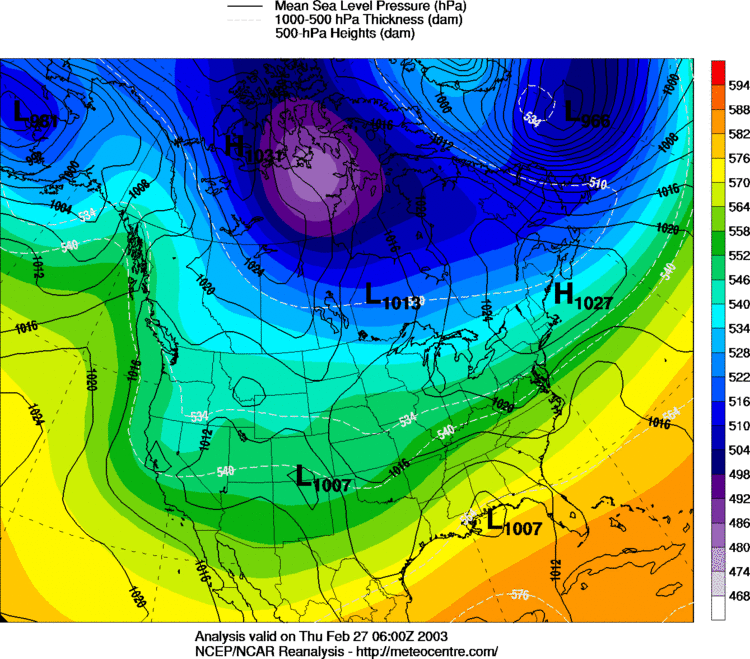
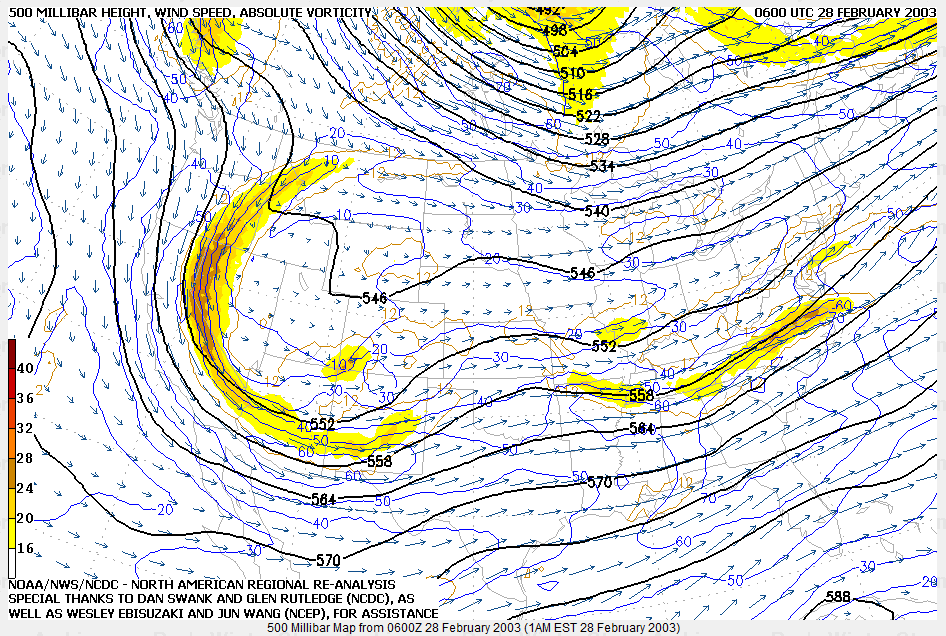
In short, there are still signs where this trough could weaken, but there are enough solutions to suggest this system remains quite strong. It is simply too early to tell. But we could get by with still a meaningful and impactful event even with a weaker shortwave. A good example was February 26-28, 2003. Note on the reanalysis image for Feb 27 at 06Z-- the surface low along the Gulf Coast is weak, but there is an anchored high to the north and some tighter 1000-500mb thickness packing over VA. On the archived 500mb chart centered on 06Z Feb 28, 2003, the 500mb trough didn't exactly look that impressive. Still, they produced a swath of 4-8" (CIPS image), which given the snow drought we've experienced, just getting an event like that would be a start. Dulles managed 6.4" from this event, DCA 5.3", and BWI 4.5". We'll see how trends go in the coming days. Seems like a storm is coming. But to what extent is still up for debate.
-
16
-
12
-
-
1 minute ago, psuhoffman said:
Do you commute all the way to DC from Westminster?
Yep. We get to work remotely a couple times a pay period. But otherwise, I commute to College Park. On a great day, I can get here in just over 1 hour. My wife works in the Hereford Zone and my in-laws live near Freeland. So it's closer to family and my wife's job which is what we wanted (originally lived near Sykesville). Farther drive for me, but I remind myself on those 90+ minute commutes home that the house/price was worth it, and living at 1,000ft will occasionally have its perks in winter.
-
8
-
-
1 hour ago, MillvilleWx said:
Yeah. He’s okay I guess

In complete agreement with @wxmvpete
I mentioned earlier today that we haven’t sorted out many of the minor details within the mid and upper pattern leading in. There’s feedback mechanisms that will lead to the storm potential and those will take time to solve.
This doesn’t even account for minute details of the thermals once we get closer, so long as there’s a storm to follow for our area. Complexities abound.
Just remember, it’s still a ways before the impact time frame. Relax, follow along, and don’t live with each model run. We have a long way to go
That MillvilleWx guy is a pretty good dude also. Knows his stuff pretty darn well.
")
P.S.A. for all the mets that contribute on here. It takes time away from their day (and nights depending on what your job is), while balancing being a significant other/spouse and possible father/mother that many of the mets make to contribute on here. I wish when I was in middle/high school that I had the kind of access to degreed mets (and even those non-mets that have learned a ton over the years on forums such as these) that younger folks have today. It's going to be a long 5-6 days for this system and still plenty of winter to go. Be courteous and treat others how you'd like to be treated. Sprinkle in a couple good snowstorms and this place ought to be fun.
")
-
26
-
7
-
-
There are many variables to watch for next weekend's winter storm. The first glaring one that stands out is northern Quebec. The ECMWF does NOT buy what the GFS is selling with the upper low aiding in stronger confluence. The CMC is more of a blend of the two. Outside of the upper level feature in the South, that upper trough the GFS is showing in northern Quebec will be something I'm monitoring in the coming days.
-
15
-
6
-
-
At 5:30, I measured 3". If I had measured maybe between 4:30 and 5, I may have sqeaked out a tiny bit more. But it compacted fast.
-
28
-
-
42/42 here between Westminster and Manchester (elevation 1,000ft). I've picked up 1.26" of rain today.
-
5
-
-
39 minutes ago, Ralph Wiggum said:
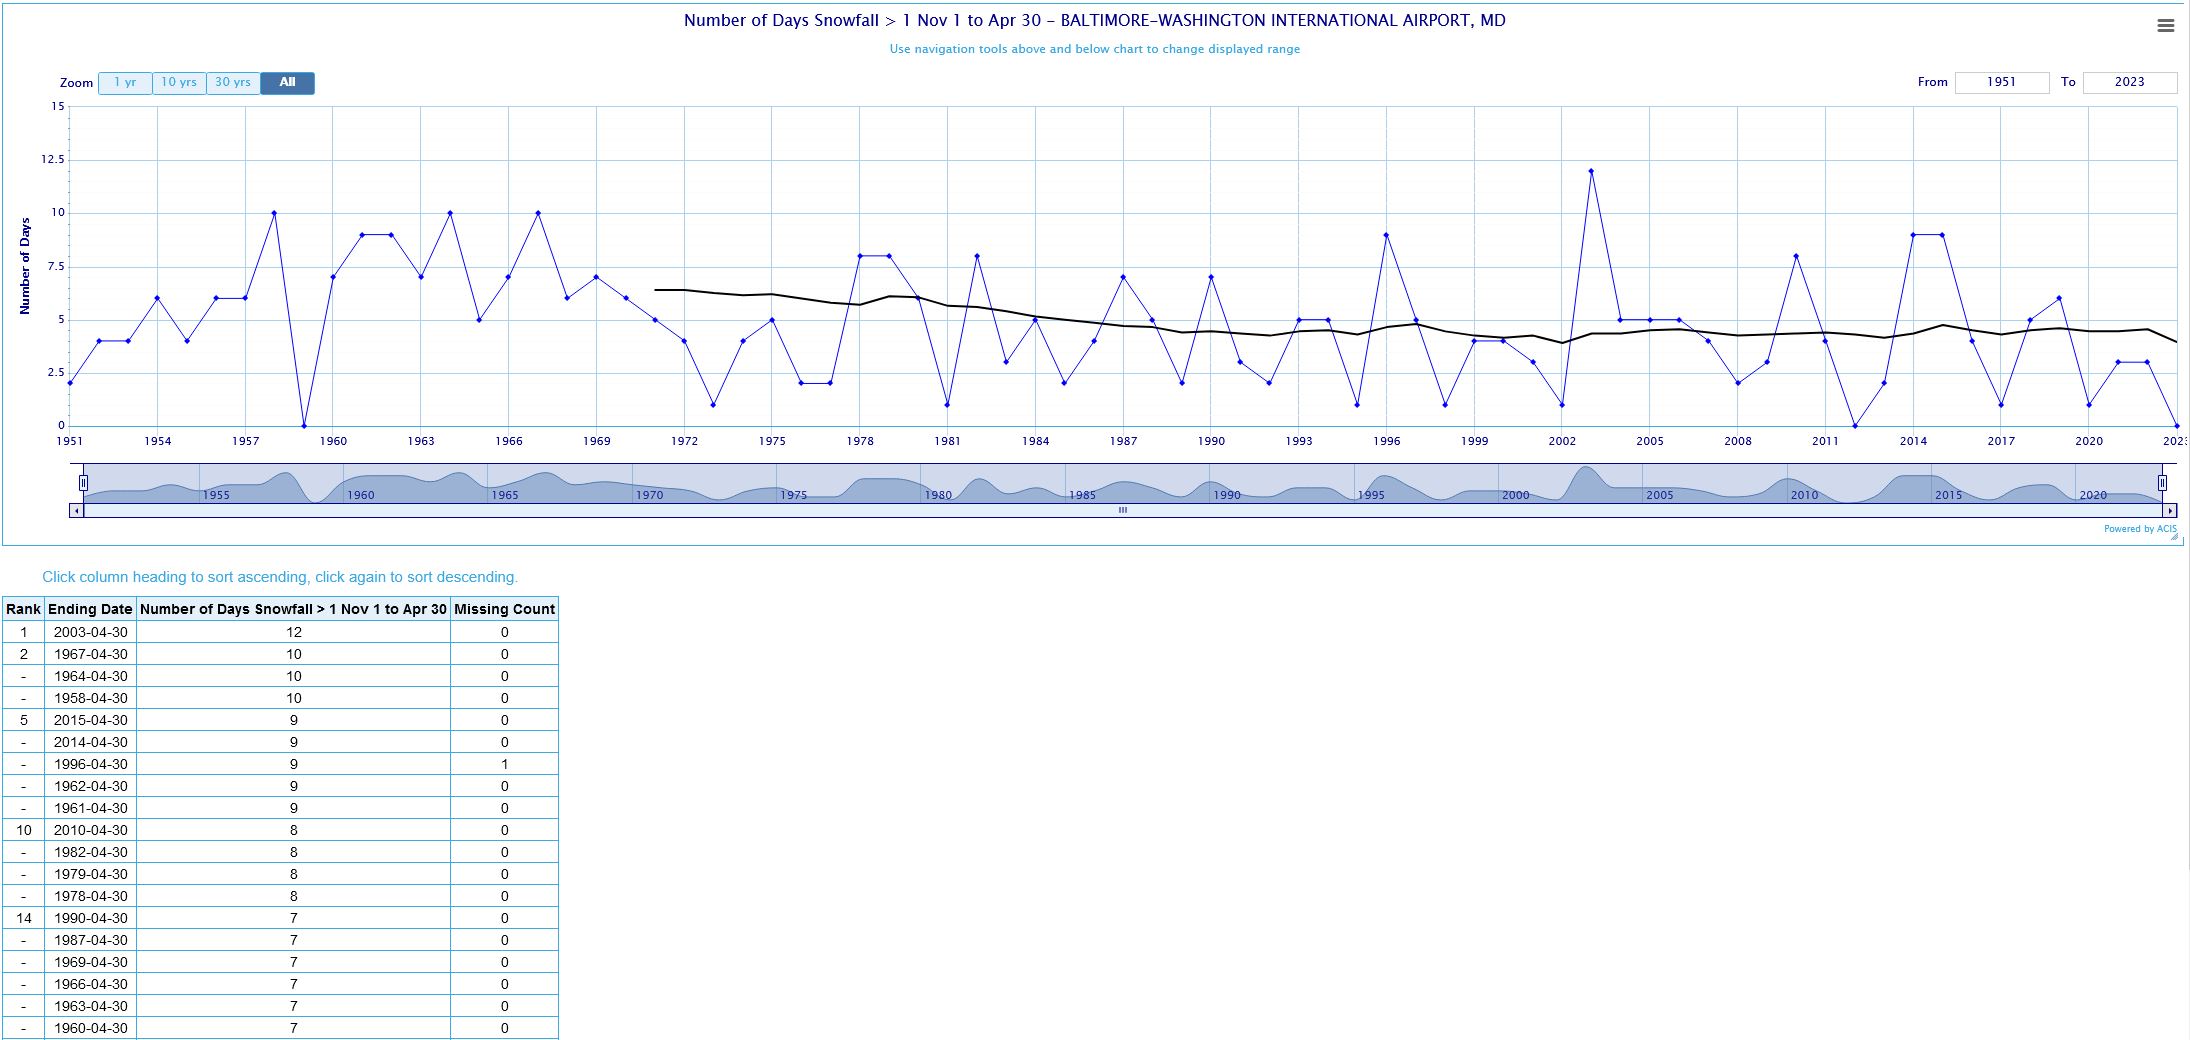
Definitely going to require alot of patience. Could strike out a few times and incur meltdowns of epic proportions. May be one of those seasons we wait til Jan into Feb which could fit alot of the backloaded analog seasons. Hopefully we don't wait that long. The panic room will be packed if that's the case.
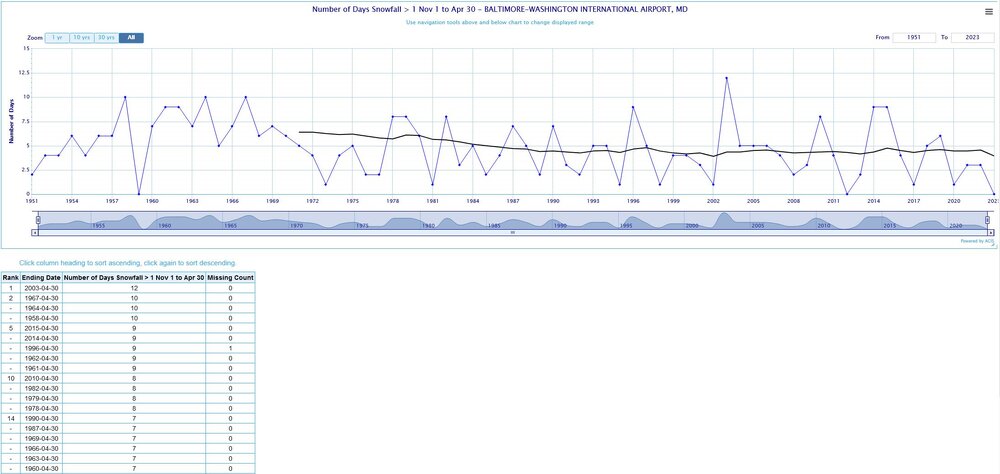
This is a great point to bring up. Here is a chart that shows the number of days where KBWI measured >1" of snow between Nov 1 - Apr 30 (PoR dates back to 1950-51). A couple disclaimers-- I added Nov since there were a handful to pick from, and April actually never measured 1" at any point at BWI, but there have been cases where the elevated terrain to the west has managed an April snow so I wanted to include April. The table I sorted shows the most days with >1" (2002-03 was the highest with 12 days, 8 of which came in Feb).
I added a 20-yr moving average to the graph. After last year's "winter", the latest 20 year moving average shows BWI only sees 4 days during that stretch with >1". Think about that. When accounting for all those months (NDJFMA), which comes out to 181 days (not including leap years), only 4 days on average does BWI see >1". Of course, the higher terrain to the west will be higher, but it speaks to how everything genuinely needs to come just right that roughly, on average, only 2.2% of the 181 days in NDJFMA see >1" along the I-95 corridor. That's why so many care. We know these opportunities don't come together often for simply 1" in many cases. That's why every inland cutter, late forming storm, or suppressed storm track can sting.
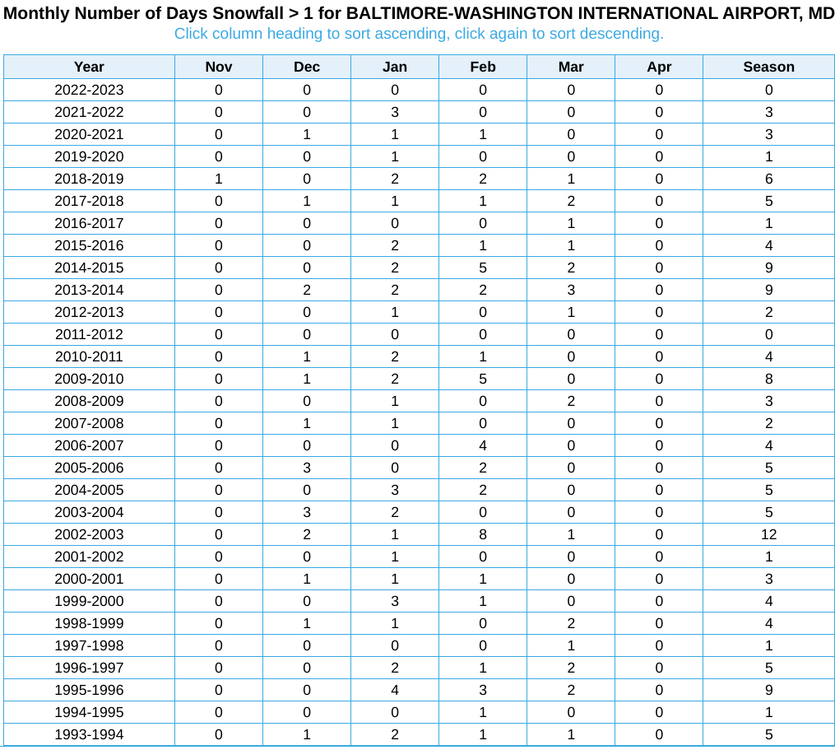
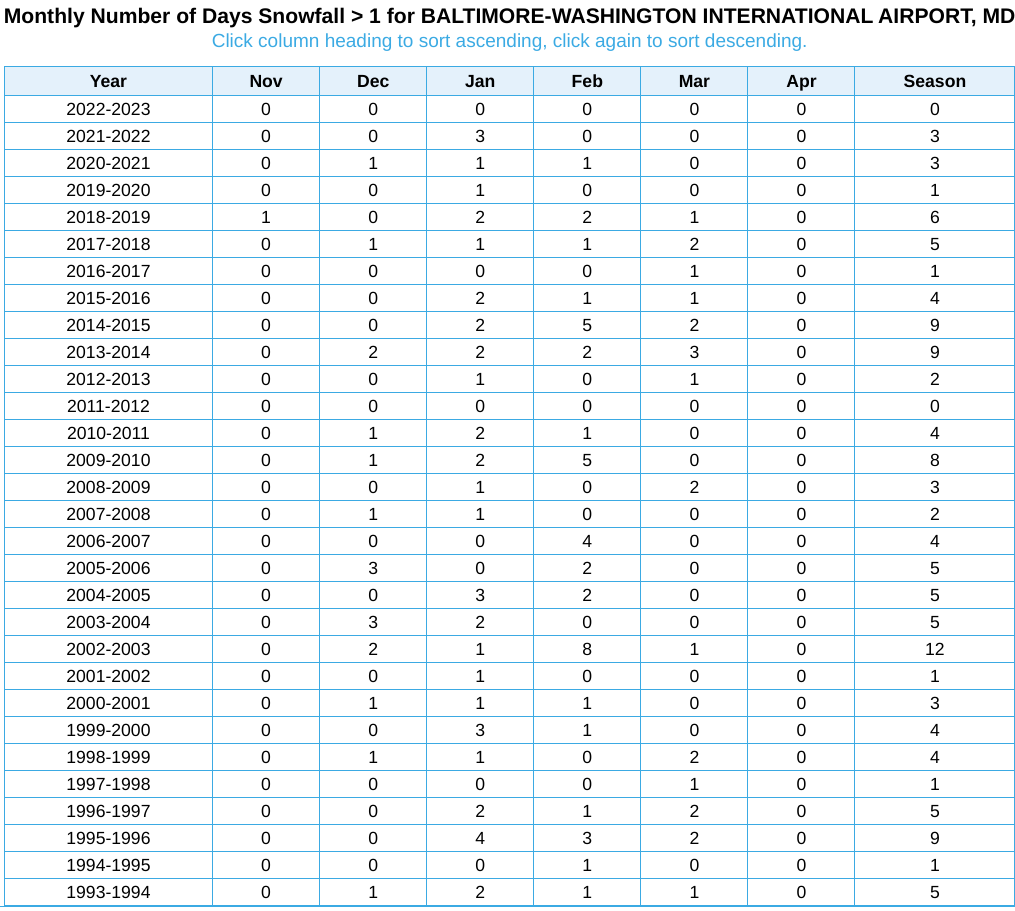
So why do I post these sad stats on this snow-starved forum? This is climo in essence. Dating back to Nov 1950, there have only been 12 November days that BWI picked up over 1" of snow. Including 2023, that's 73 Novembers, or 2,190 November days. And BWI got over 1" on 12 of those days. Which is less than 1%. December the numbers start to gradually go up from there, and March is still considerably better than November. As we know, January and February are the top months. I added a chart with the number of days BWI reported >1" going back to 1993-94 for fun.
So, patience. There's plenty of reasons to be optimistic, but a handful of other reasons to keep expectations in check. But it's early (as I'm trying to convey). There's a lot more of the season to go, and being patient, kind, and courteous to others will hopefully allow for healthy discussion for a season that should provide us with plenty of model watching.
Cheers!
-
10
-
7
-


Jan 19th Storm OBS Thread
in Mid Atlantic
Posted
Yeah I'm at 2.7" 6 miles northeast of Westminster. A light but pretty snow falling. One of the negatives with such a good band to the south is the air has to sink somewhere. Looks like northern Carroll and most of Frederick county is dealing with that at the moment.