

BucksCO_PA
-
Posts
2,136 -
Joined
-
Last visited
Content Type
Profiles
Blogs
Forums
American Weather
Media Demo
Store
Gallery
Posts posted by BucksCO_PA
-
-
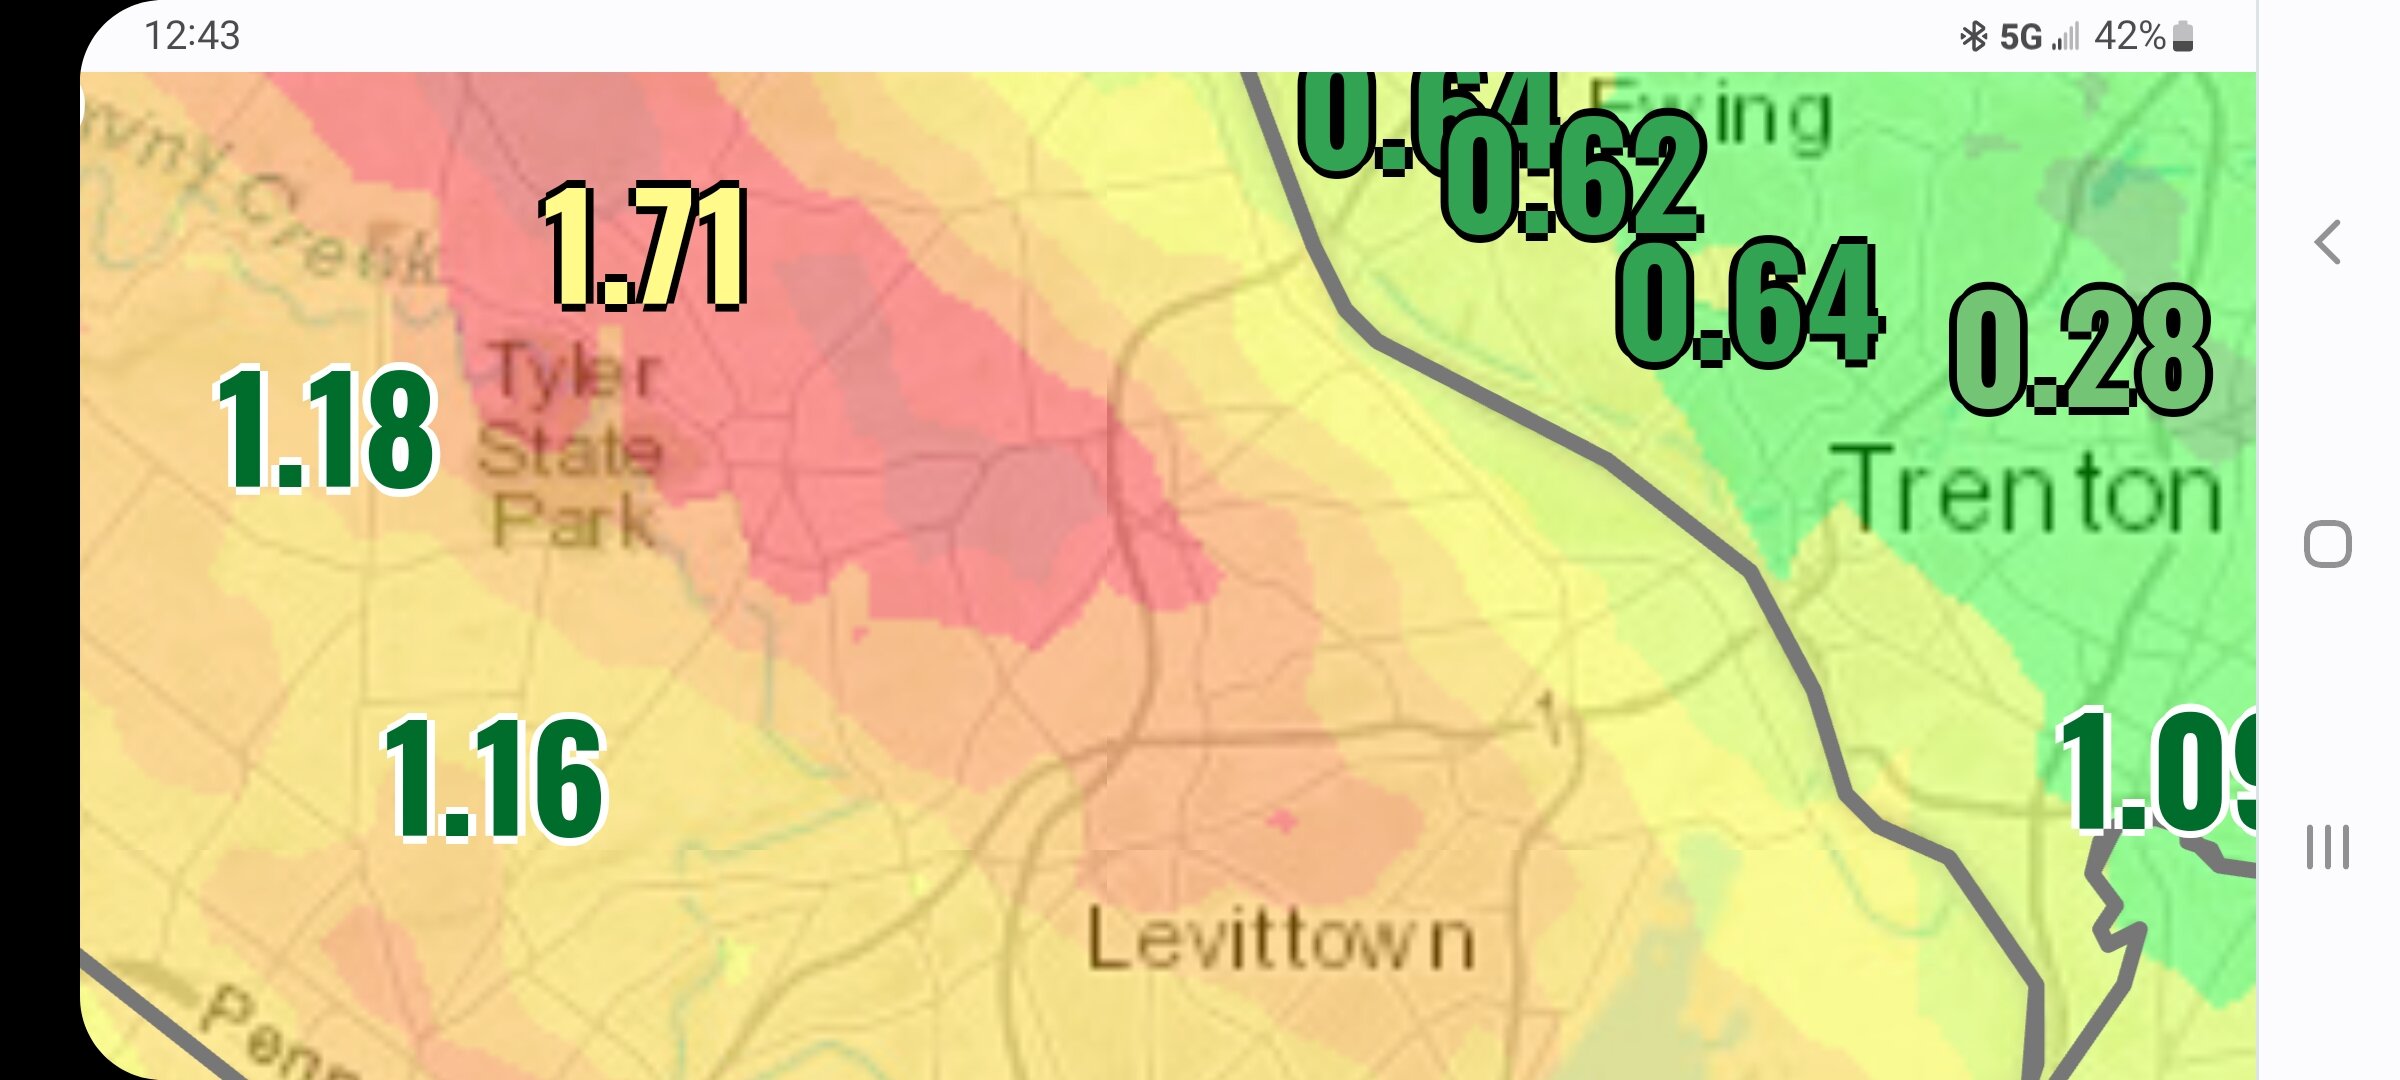
3 hours ago, Picard said:
Question. I'm looking at Air Now. Why is there such a large variability in air quality readings over such short distances? You can see green and red icons with widely different readings, within a couple miles of each other. It looks like they're all updating properly. Is it affected that much by the local geography?
Green icons are locations just reading ozone, the other ones are reading both PM2.5 & ozone. Issue is obviously the PM2.5 pollutant.
-
 1
1
-
 1
1
-
-
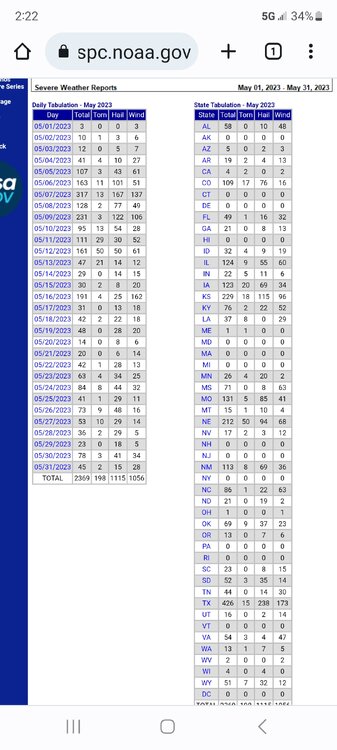
PA, NJ & NY among 11 states & DC that did not record a single severe weather report for May.
-
3
-
-
On 5/21/2023 at 11:14 AM, Wxoutlooksblog said:
I'm skeptical about much if any heat prior to the second or third week of June.
WX/PT
Great call from over a month ago for little if any heat thru at least the middle of May if I remember correctly. All the Mt. Holly PA & NJ locations are solidly below average at this point in the month. Locally & at nearby TTN only one 80 day since 4/14. Now if we could pull off a dry / cool couplet during one of the summer months that would really be something.
Speaking of dry.
PHL is currently sitting at a paltry 0.24" of precip for the month. The driest May on record is 0.47" in 1964. The last time PHL recorded any driest month on record was FEB 2002 (0.55").
Additionally should we strike out on the weekend rain opportunity you're looking at one of the driest months on record at any time of year:
0.09" - OCT 1963
0.09" - OCT 1924
0.11" - JUN 1949
0.20" - SEP 1884
0.21" - SEP 2005
0.21" - JUN 1964
0.25" - DEC 1955
0.30" - OCT 1892
0.32" - NOV 1976
0.36" - SEP 1906
-
3
-
-
1 hour ago, ILoveWinter said:
Absolute garbage, bring on the heat!
You need to hang out next to the Newark ASOS, somehow they managed 60 degrees yesterday.
 You know you have a problem when it's 2-3 degrees too warm in what should be uniform conditions.
-
2
-
1
-
-
14 hours ago, Morris said:
Colors to be erased clean in next Thursday's drought monitor update.
Climo here makes it very hard to run a legit drought for too long.
Last weekend and this weekend brought many of us to above normal YTD precipitation with 2 months worth of rain in 8 days.
From a hydrologic standpoint there hasn't been an official basin wide drought in the Delaware River Basin region since 2002. A drought emergency was issued for lower basin in late Sept 2010 however less than a week later the area received 4-8" of rain & that emergency was subsequently lifted the following month.
In the twenty years prior to the 2001-2002 drought the Delaware River Basin Commission issued drought warnings / emergencies on 6 occasions. Actual droughts were common during the 80's, 90's & the early 2000's until the fall 2002 El Nino when the faucet opened up. Any dry periods since then have been short lived.
Locally 4.09" for the 3 day event & 6.39" for the month of April.
-
1
-
-
2 hours ago, LibertyBell said:
It sounds like it could challenge some of the extreme diurnal ranges at Toms River or Westhampton!
5/21/1992:
Indian Mills, NJ
High 88 / Low 28
Millville, NJ
High 82 / Low 30
ACY (Pomona, NJ)
high 84 / Low 28
-
1
-
2
-
-
10 hours ago, LibertyBell said:
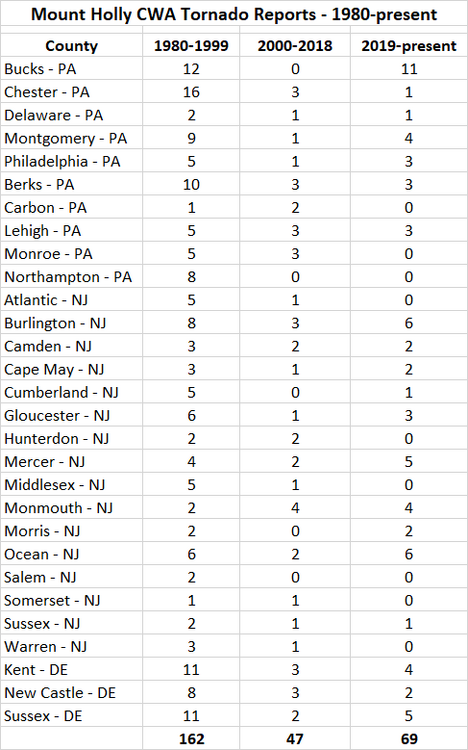
This is for overall yearly tornadoes right, not just for April?
Thanks for posting this-- I see my county in NE PA included here!
Overall totals for all months
-
1
-
-
6 hours ago, bluewave said:
Would be only the 7th April tornado in NJ.
https://climate.rutgers.edu/stateclim/climatologies/njtornado.html
We don’t know enough about this one yet for any analogs.so over the previous 47 yrs. back to 1975 there was 1 tornado recorded in NJ during the month of April, yesterday there were 4
-
2
-
-
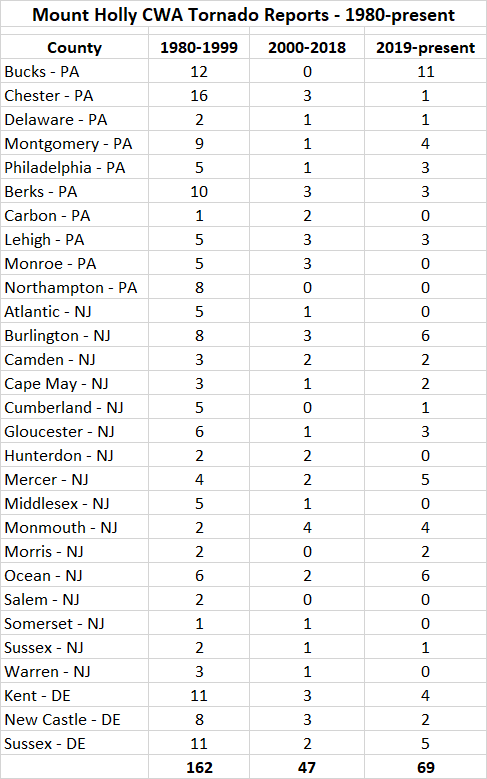
6 hours ago, SnoSki14 said:
It does appear that we've seen an uptick in tornadoes as of late but not sure.
Here's a chart for counties served by the Mt Holly Forecast Office, recent uptick for sure especially for the immediate Philly metro area. Current with yesterday's 5 tornadoes.
-
3
-
-
19 hours ago, Albedoman said:
You guys better start thinking about drought instead of cold and warm. Not having more than .50 inch of rain in weeks here at my house is worrisome. Usually the ground is so wet, I cannot even drive the mower on it. Once the tree releaf begins and the temps hit near 70, its game on as the moisture will really get sucked out of the ground. Fortunately the soil temps are below normal now but that can quickly change with a few sunny 70 degree days. I am hoping Saturday we can get an inch of rain with some t- storms but I am not holding my breath as this stagnant light shower weather pattern refuses to budge. I am so tired of either the constant cloudy cold days or sunny blowing your ass around days. It has been this way for the entire month. 50 degree sunny days with 30 mph + northerly winds is not productive.
did you have the screen name Grothar at one time?
-
1/4 record high minimum temp:
PHL - 57 (1950)
NYC - 59 (1950)
JAN record high minimum temp:
PHL - 60 (1/8/1998)
NYC - 59 (1/4/1950)
-
1 hour ago, LibertyBell said:
Wow! Did it snow everywhere that day or was it very spotty? I'm going to put Christmas 1980 on my short list for underrated and underrappreciated extreme winter days. So far it's that, the January 1985 extreme arctic outbreak and PD2 on the list. I didn't know the afternoon high was so low, that puts it up there with the elite of the late 1800s and early 1900s as some of the coldest days we have had here all time. I would love to know what kind of airmass that was and how it compares to the January 1985 extreme arctic airmass which was the only single digit high temperature at NYC I can remember (-2/7 split). I was way too young in January 1977 to remember that at all.
Yep, daytime highs for 12/25/1980 was even colder than 12/25/1983. As cold as it was during the DEC 1983 outbreak by 12/28 both PHL & NYC were in the mid 50's with over an inch of rain from a healthy clipper so those situations also occurred in the past. Wasted or unproductive cold is not unique to this day & age.
Regarding snow for Christmas 1980 that actually fell on the afternoon of Christmas Eve, 2-3" from NE Philly up thru CNJ to New Brunswick. PHL was rain & metro NYC looks to be a little less with around an inch. So a white Christmas that year for many outside NYC & PHL which are only listed as T's.
-
2
-
-
7 hours ago, LibertyBell said:
It's interesting the highs in 1980 and 1988 and 1989 don't make this list, even though the -1 low on Christmas Day in 1980 (accompanied by a coating of snow) was the last time it got below zero in December and December 1989 was the coldest on record.
NYC on 12/25/1980 recorded a midnight high of 20 degrees, by 4:00am the temp had fallen into the single digits & would remain there for the remainder of the day. The afternoon high was only 5, maybe 6, degrees. Same deal for Philly, midnight high of 24 & an afternoon high of only 8 degrees.
Christmas eve this year was really impressive given the recent warming trends but with that being said Christmas day 1980 & 1983 still say hold my beer.
-
2
-
-
18 hours ago, bluewave said:
NJ came close to the all-time record number of 90° and 100° days this summer. The average summer high temperature in NJ was 2nd warmest on record at 86.5°. The minimums were further down on the list due to the drier conditions and lower dewpoints.
Data for January 1, 2022 through October 2, 2022
Click column heading to sort ascending, click again to sort descending.NameStation TypeNumber of Days Max Temperature >= 90FREEHOLD-MARLBORO COOP 54 SOUTH JERSEY REGIONAL AIRPORT WBAN 53 HIGHTSTOWN 2 W COOP 50 NEWARK LIBERTY INTL AP WBAN 49 Newark Area ThreadEx 49 SOMERSET AIRPORT WBAN 46 HARRISON COOP 44 NEW BRUNSWICK 3 SE COOP 43 New Brunswick Area ThreadEx 43 CANOE BROOK COOP 42 ESTELL MANOR COOP 41
Data for January 1, 2022 through October 2, 2022
Click column heading to sort ascending, click again to sort descending.NameStation TypeNumber of Days Max Temperature >= 100FREEHOLD-MARLBORO COOP 6 NEWARK LIBERTY INTL AP WBAN 6 Newark Area ThreadEx 6 SOMERSET AIRPORT WBAN 5 CANOE BROOK COOP 4 HARRISON COOP 4 SOUTH JERSEY REGIONAL AIRPORT WBAN 3 LONG BRANCH-OAKHURST COOP 2 HIGHTSTOWN 2 W COOP 2 NEW BRUNSWICK 3 SE COOP 1 New Brunswick Area ThreadEx 1
201006 - 201008 86.5°F 128 202206 - 202208 86.0°F 127 201606 - 201608 85.7°F 126 199906 - 199908 85.6°F 125 202006 - 202008 85.4°F 12
202006 - 202008 65.1°F 128 201006 - 201008 64.9°F 127 200506 - 200508 64.8°F 126 202106 - 202108 64.5°F 125 201806 - 201808 64.3°F 124 201106 - 201108 64.1°F 123 201606 - 201608 64.1°F 123 201906 - 201908 64.1°F 123 202206 - 202208 64.1°F 123 Garbage in, garbage out
-
 1
1
-
-
14 minutes ago, nycwinter said:
wow 95 in the park..
OMG the tree canopy the tree canopy.....meanwhile the other side of the river Lol
-
2 hours ago, FPizz said:
For some reason everyone seems to know better than the actual Mt. Holly mets. We should tell them to cancel their investigation.
& the Doctor who's been the NJ Climatologist for 30 yrs. Unfortunately what's clearly obvious here is the warmers are just a bad at separating their personal bias as the deniers.
OMG the tree canopy the tree canopy yet they bury their heads in the sand when it comes to the garbage coming out of Newark.
-
1 hour ago, Rjay said:
But doesn't that almost prove it's not a sensor issue?
Combo sensor & the location is not suitable??? When you have numerous days like today in which day time temps are 4-5 degrees warmer compared to the immediate Newark area consensus then something's clearly wrong. 1-2 degree errors you deal with since that's not out of tolerance however 4-5 degrees renders the location useless as a frame of reference for the immediate metro area.
A retired professional from NYC indicated there have been concerns with the sensor location being abnormally dry. After a run of some very wet July's Newark if off to a bone dry start this month, is this exacerbating the situation???
In any event I'll hitch my wagon to the Dr. that's been the NJ State Climatologist for the past 30 yrs. He has been in contact with Brookhaven ad nauseum regarding Newark.
-
2
-
-
2 hours ago, bluewave said:
Newark just had a top 3 warmest July 1st. If past analogs work out, then July 1st will turn out to the warmest day of the month. 5 out of the past 6 years with a 98° to 100° on the 1st had the warmest day of a July on the 1st. Models are hinting at frontloaded warmth this month as the ridge pulls back to the west in Mid-July.
Data for July 1 - NEWARK LIBERTY INTL AP, NJ
Click column heading to sort ascending, click again to sort descending.DateMax TemperatureWarmest Day of Month 1963-07-01 100 July 1st 2022-07-01 99 ? 1964-07-01 99 July 1st 2018-07-01 98 July 1st 2012-07-01 98 July 18th 1968-07-01 98 July 1st 1945-07-01 98 July 1st
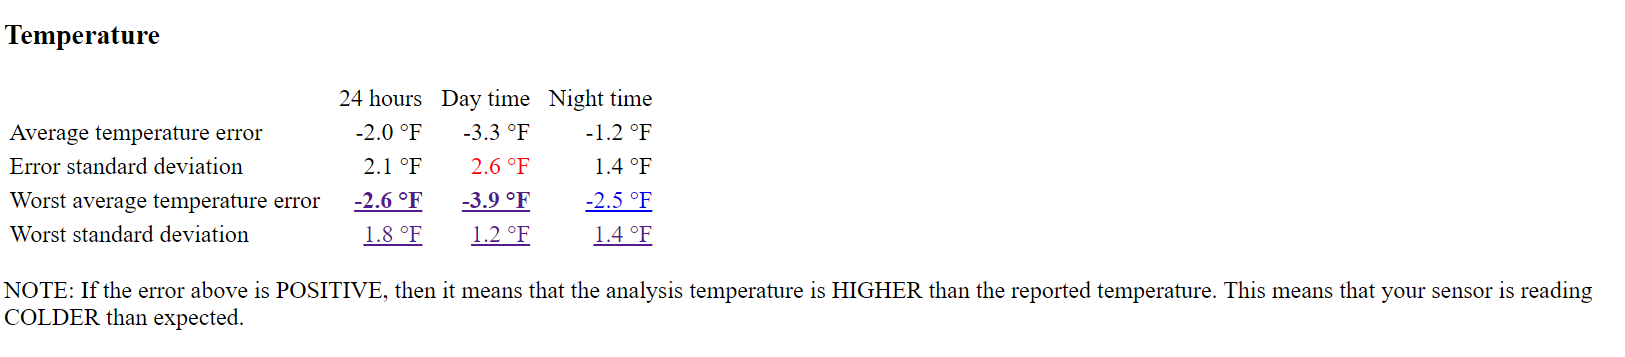
These type of post are useless given the actual high for the immediate Newark area was closer to 95 degrees. The temp error was horrendous yesterday during the peak afternoon heating.
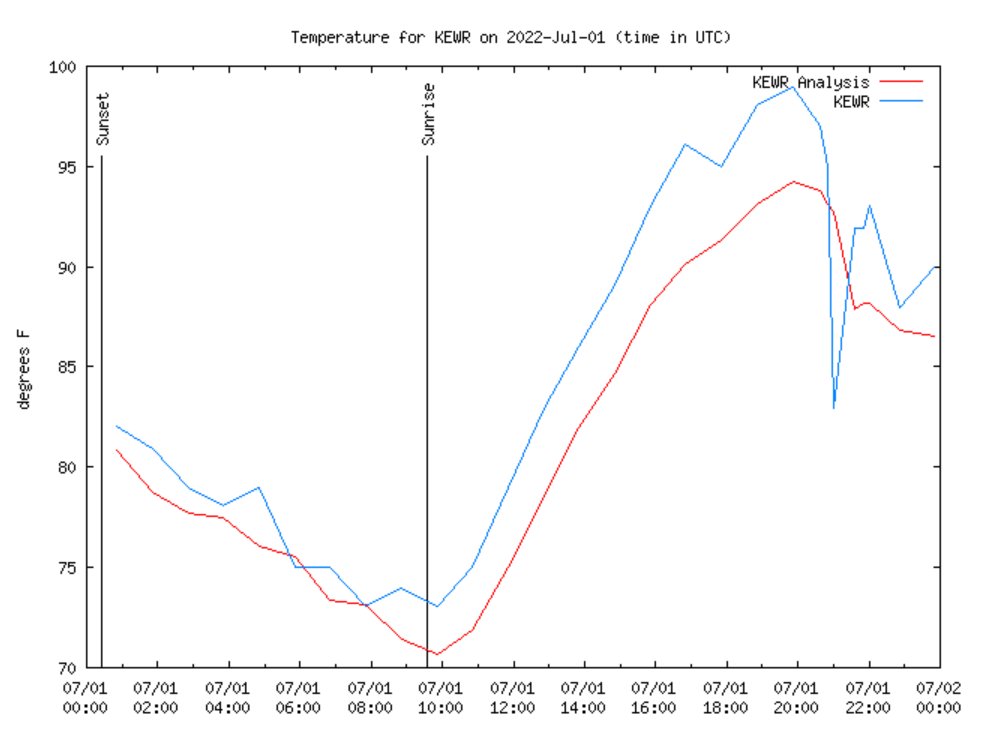
Whether sensor error, location or combo of both the end result is embarrassing at this point. The average day time error over the past 28 days was +2.7 degrees on 6/29. That figure today is now +3.3 degrees so more recent 4-5 degrees errors are showing as yesterday's graph supports.

-
2 hours ago, Stormlover74 said:
if central park ever reaches 100 again we'll all be dead
Philadelphia and Central Park haven't recorded 100 degrees since 7/18/2012. Since that date the max temp at both locations is 98 degrees. Triple digits are not easy especially with significant increase in precip & humidity. The sensor at PHL is currently reading 1-2 too warm therefore they have a better than average shot this summer.
-
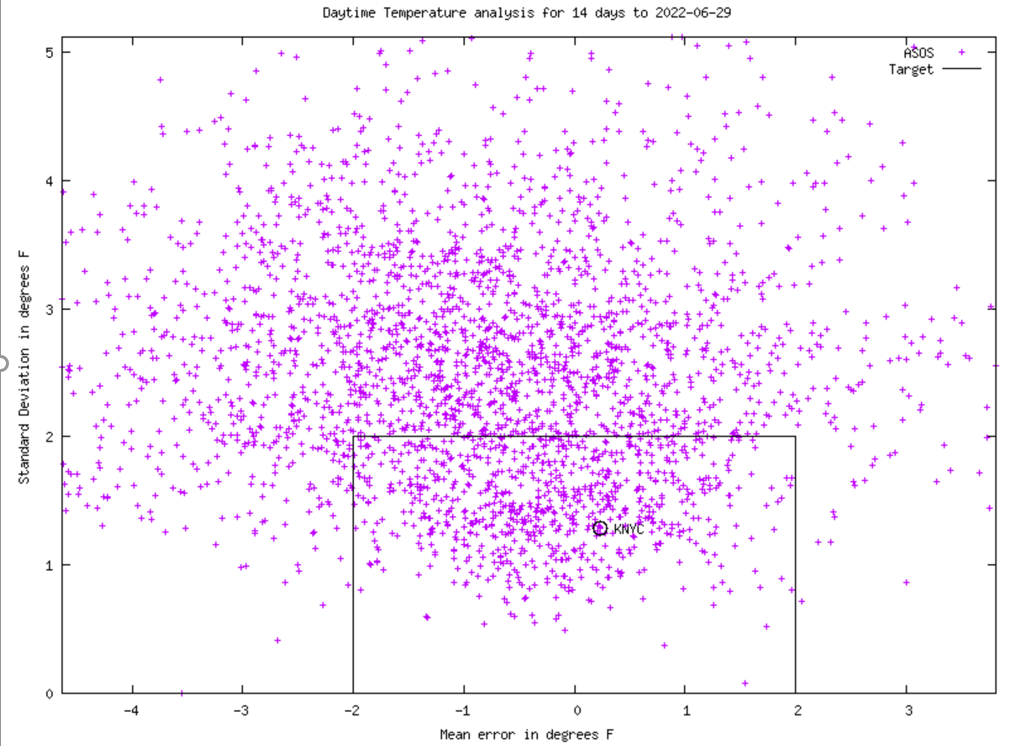
3 hours ago, bluewave said:
Central Park is wrong since the old sensor used to be out in the open instead of under the trees before the 1990s. Deep shade with leaf transpiration can shave at least 2-3° off the high temperature on sunny days. That’s why the highs used to be much warmer at Central Park before the overgrowth in the 1990s. A sensor on the Great Lawn in Central Park would be at least 2-3° warmer than under trees.
https://weather.gladstonefamily.net/site/KNYC
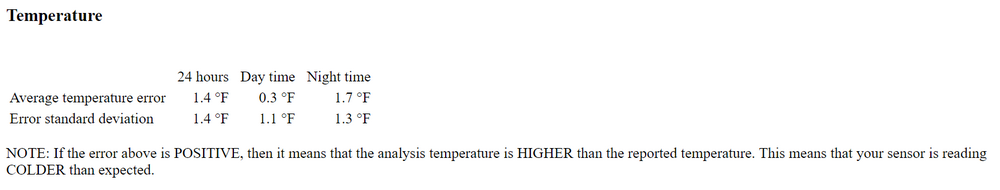
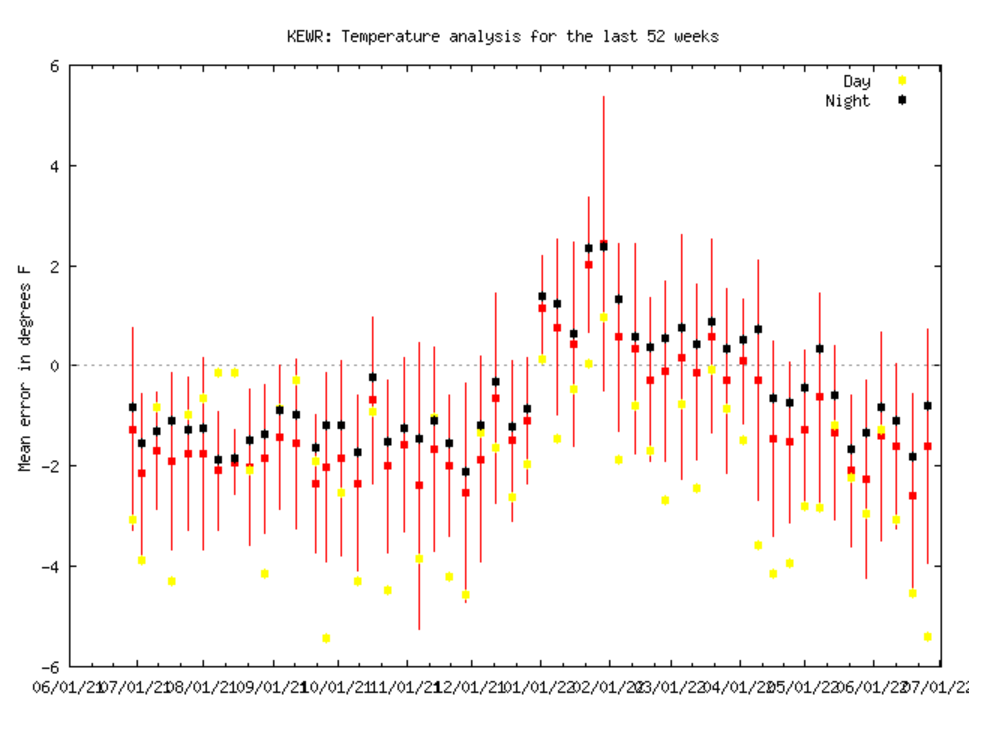
Recent temp analysis over the past year does not support this narrative. In actuality the daytime high temps at Central Park when compared to surrounding stations are solidly within the ASOS target in terms of mean error & SD.
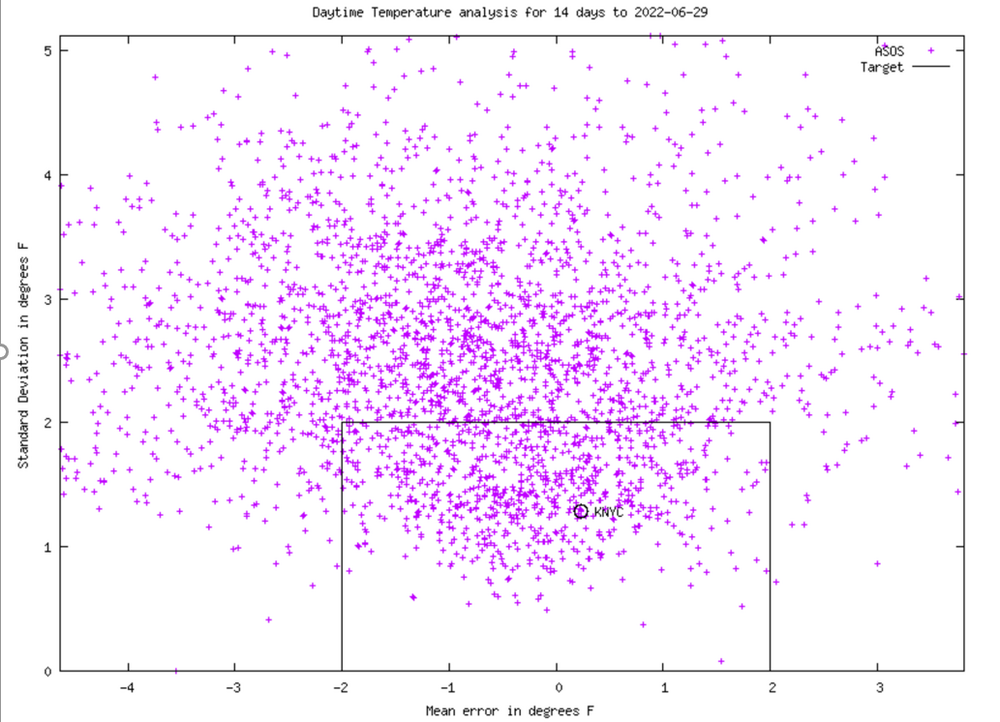
Over the past 28 days the average day time temp error at Central Park is only 0.3 degrees too cool. The issue, if there really is one, would be the night time average error running solidly cool however that's not far fetched considering the comparison to many highly urbanized sensors vs. the heavily wooded park array.
52 week day time trends are consistent
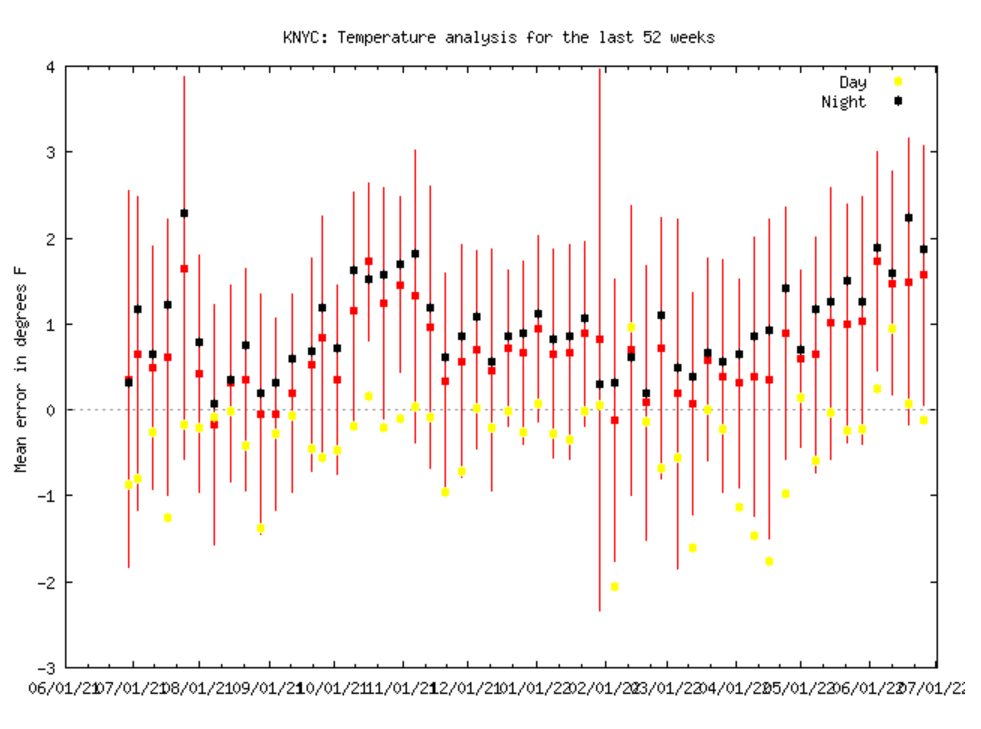
You posted a 9yr old pic of the Central Park ASOS from 2013 showing the surrounding vegetation, it should be noted that despite that growth they had no problems recording triple digits during 2010-2012 including a 104 & 103 day. Very comparable to the triple digit readings at PHL & LGA during that time.
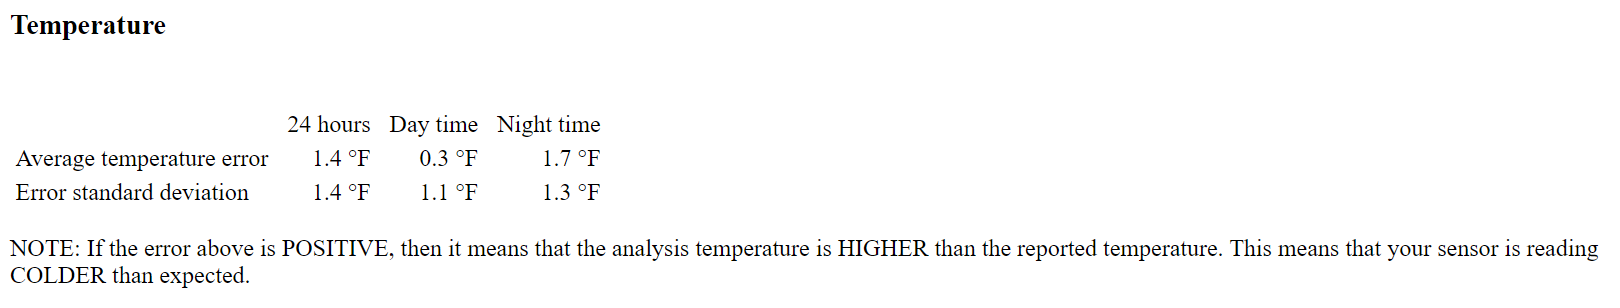
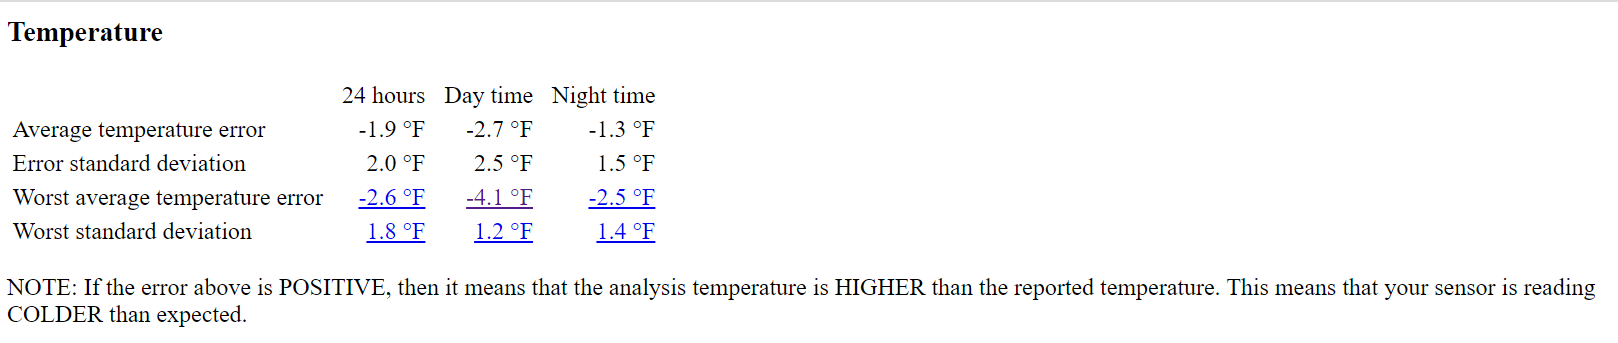
Now when you cross the Hudson you really encounter a site that currently has significant day time temp issues on the warm side. I would think the warm bias at Newark is so obvious even Stevie Wonder could see it but apparently that's not the case.....
The same data & charts for Newark, in this case the day time temps over the past 14 are well outside the ASOS target. Significant warm average day time temp error. The is how you turn 92 into 96 degrees LOL.
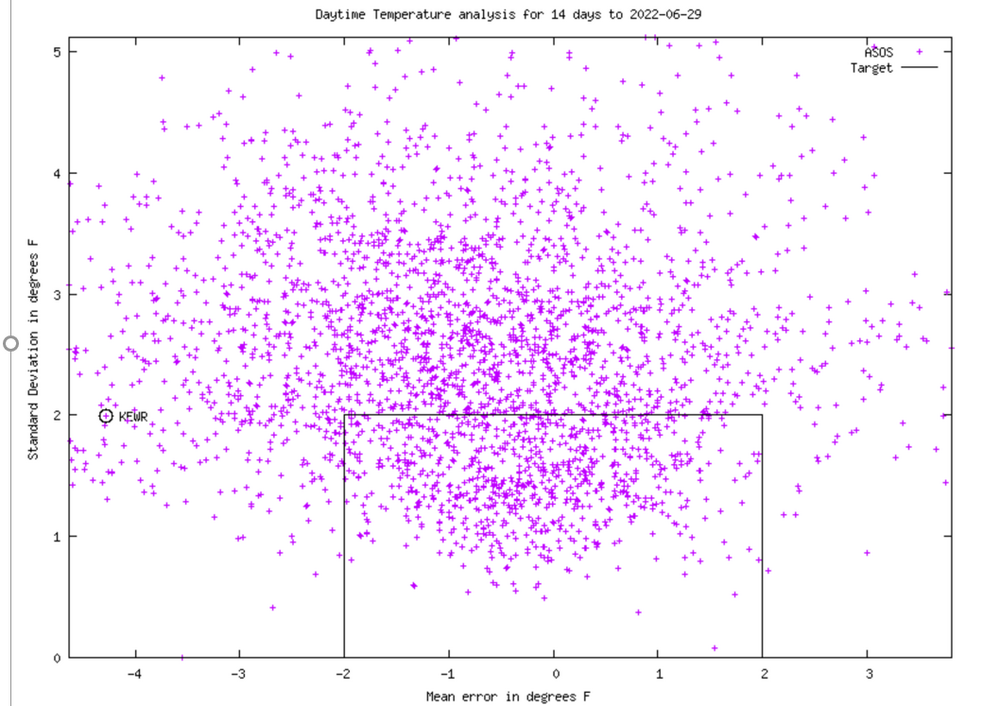
Over the past 28 days the day time error is a ridiculous 2.7 degrees too warm which is so bad you have the unacceptable error range note.
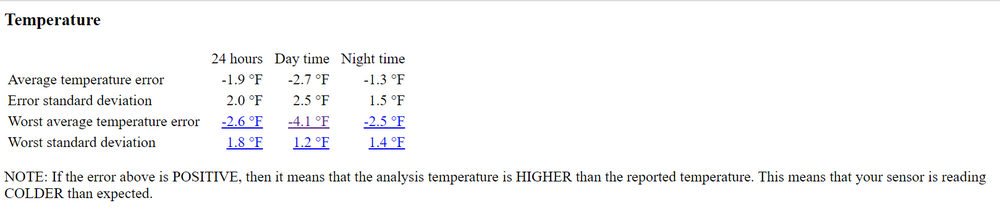

Finally the 52 week trend, something sure changed during the winter however the sensor has reverted back to it's customary nuking of day time temps.
-
5
-
-
5 hours ago, bluewave said:
The warmest departures were limited to NJ this month with the ridge axis to our west and blocking to our north.
ISP……+0.1
LGA….-1.1
JFK….+0.2
NYC….-0.6
BDR….-0.5
HPN…..-0.2
POU….-0.8
EWR….+1.8
PHL…..+1.0

TTN.. -0.8
ABE.. -2.5
MPO.. -1.5
ACY.. -0.7
N. Brunswick.. 0.0
Newark is reflective of a sensor in the middle of miles of concrete & PHL has been running 1-2 degrees warm since last fall. Vast majority of the region is not represented by those positive departures.
-
3
-
-
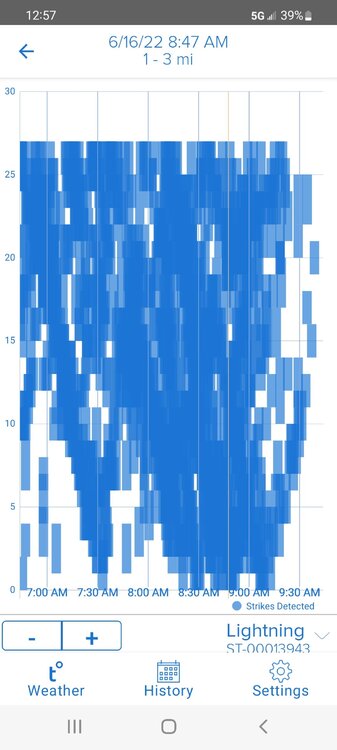
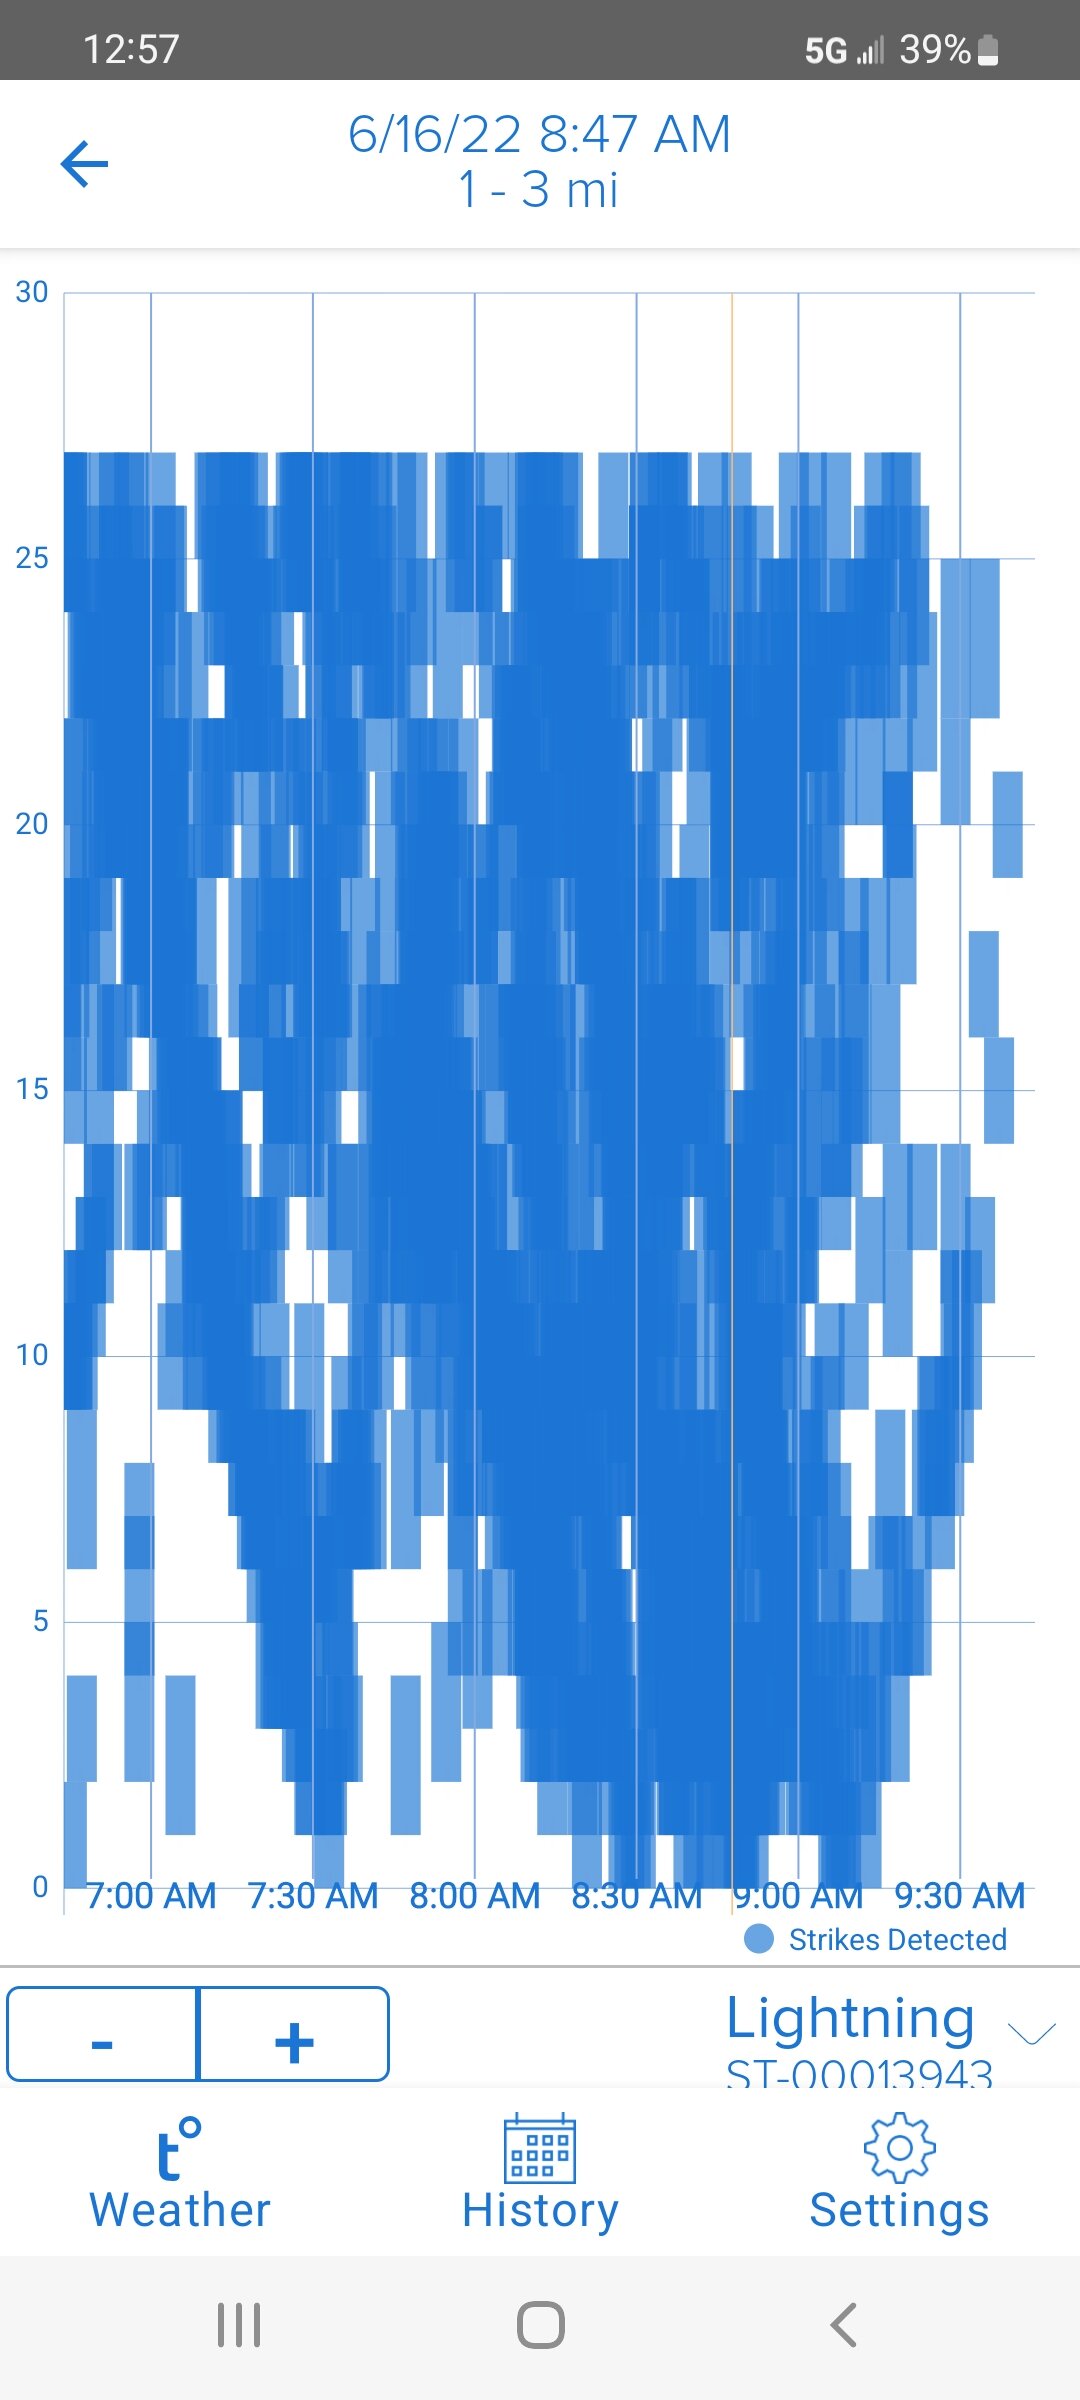
Most lightning detection I've seen on the sensor I've had for the past year & half.
-
3
-
-
1.93" this morning, monsoon between 8:30-9:00 dropped over an inch
Big dump in Bucks County just west of Trenton.

-
24 minutes ago, bluewave said:
This -AO block is the 2nd strongest on record for the month of June. It came in just behind the all-time June record of -2.921 set in 1992. Hopefully, some of this rubs off on next winter like it did after June 2009.
https://www.cpc.ncep.noaa.gov/products/precip/CWlink/pna/norm.daily.ao.nao.pna.aao.gdas.120days.csv
02Jun2022 -2.6465 https://ftp.cpc.ncep.noaa.gov/cwlinks/norm.daily.ao.index.b500101.current.ascii
-2.921….6-29-92
-2.646….6-2-22
-2.610…..6-25-87
-2.510…..6-7-55
-2.470…..6-8-51
-2.406…..6-29-09
During 1992 the highest temps of year (tied & outright) at Allentown, Newark, Central Park. Islip & JFK occurred in May. At PHL & LGA only one day, 7/14 was hotter than the May max.


June 2023
in New York City Metro
Posted
Impressive chill this morning at several locations for your neighbors to the west.
Trenton - 45 degrees, 1 shy of the record from 1932
ABE - 42 degrees, 2nd lowest for the date behind 39 also in 1932
MPO - 34 degrees, 3rd lowest for the date & the coolest since 32 degrees in 1944