

BucksCO_PA
-
Posts
2,136 -
Joined
-
Last visited
Content Type
Profiles
Blogs
Forums
American Weather
Media Demo
Store
Gallery
Posts posted by BucksCO_PA
-
-
1 hour ago, bluewave said:
There is no underrepresentation since it all depends on what time interval you use. Set it to 24 hrs and the April 2003 drop is the top one. Anytime you have an afternoon within 24-72 hours with a 30°+ difference it’s noteworthy.

it most certainly is underrepresented when you limit to a specific hour that does not capture the full scope of the temp drop
-
 1
1
-
-
4 hours ago, bluewave said:
It will be interesting to see if Newark can maintain a high only in the 40s tomorrow. It would be one of the more impressive 48-72 hr afternoon temperature drops during the month of April if they can pull it off. The last 80s to 40s in the afternoon in April over a few days was back in 2018.

4 hours ago, bluewave said:It will be interesting to see if Newark can maintain a high only in the 40s tomorrow. It would be one of the more impressive 48-72 hr afternoon temperature drops during the month of April if they can pull it off. The last 80s to 40s in the afternoon in April over a few days was back in 2018.


Since you have "exactly" 48hrs as one of the data points the full scope of the 4/16-18 2003 temp drop is missed. Question would be how many others are underrepresented on that list?
4/16/2003, 4:00pm - 87 degrees
4/17/2003, 4:00am - 49 degrees
4/17/2003, 4:00pm - 40 degrees
4/18/2003, 4:00am - 37 degrees
The actual high at Newark on 4/16/2003 was 88 degrees so that's a 51 degree temp drop in less than 36 hrs.
-
1
-
-
1 hour ago, LibertyBell said:
For a short time I think, but 2002 was one of our hottest summers on record, especially here on the south shore.
The three hottest summers here were 1983, 2002 and 2010.
During the 2002 summer PHL never got to triple digits however did reach 99 degrees on 4 occasions, once in July & 3X in Aug. At the time Aug & Sept were top 10 warm months & Jul was the 11 warmest. The onslaught of warmth since that time has moved Jul & Sept down the list, Aug remains the 7th warmest on record.
-
 1
1
-
-
25 minutes ago, Big Jims Videos said:
8 hours from Plattsburgh to Point Pleasant Beach in a drive that usually takes 5. Worth every minute.
1019 miles in 24 hrs. left MON at 1:00am for Buffalo, left Buffalo at 9:30am for Painesville, OH, left Painesville at 4:30pm & got home exactly at 1:00am this morning.
3 mins 48 secs of totality was more than worth it, spectacular event.
-
3
-
-
Heading to Buffalo tomorrow initially for business, leaving at 1:00am & hope to be finished by 10:00. Looks like that's not enough of a window to get far enough east of Watertown for prime time.
Better plan to head SW for a few hours over to Cleveland area???
-
1
-
-
27 minutes ago, golfer07840 said:
Who the heck was keeping records back in the 1700's... prior to the Revolutionary War?...
Don Sutherland's great, great, great, great.......grandfather
-
 6
6
-
-
16 hours ago, snowman19 said:
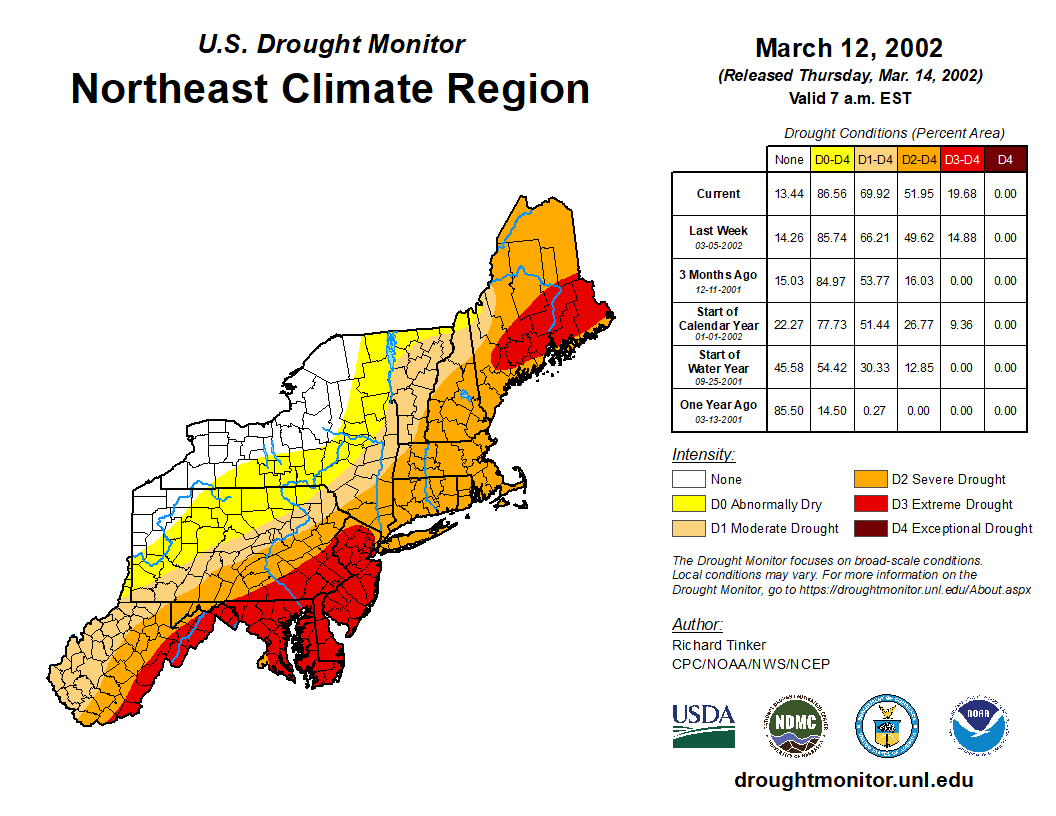
It’s hard to believe that the last true drought emergency we had in the metro area was over 22 years ago (2002). The drought/wet cycles don’t normally run this long
During the 22 years prior to 2002 the DRBC issued 5 drought warmings & 3 drought emergencies. There has much talk about the temp flip since the 15-16 Nino, the precip flip since the 2002-03 Nino has also been impressive.
-
1 hour ago, Brian5671 said:
Similar numbers up this way-just crazy...we had a drought 2 summers ago-long forgotten at this point.
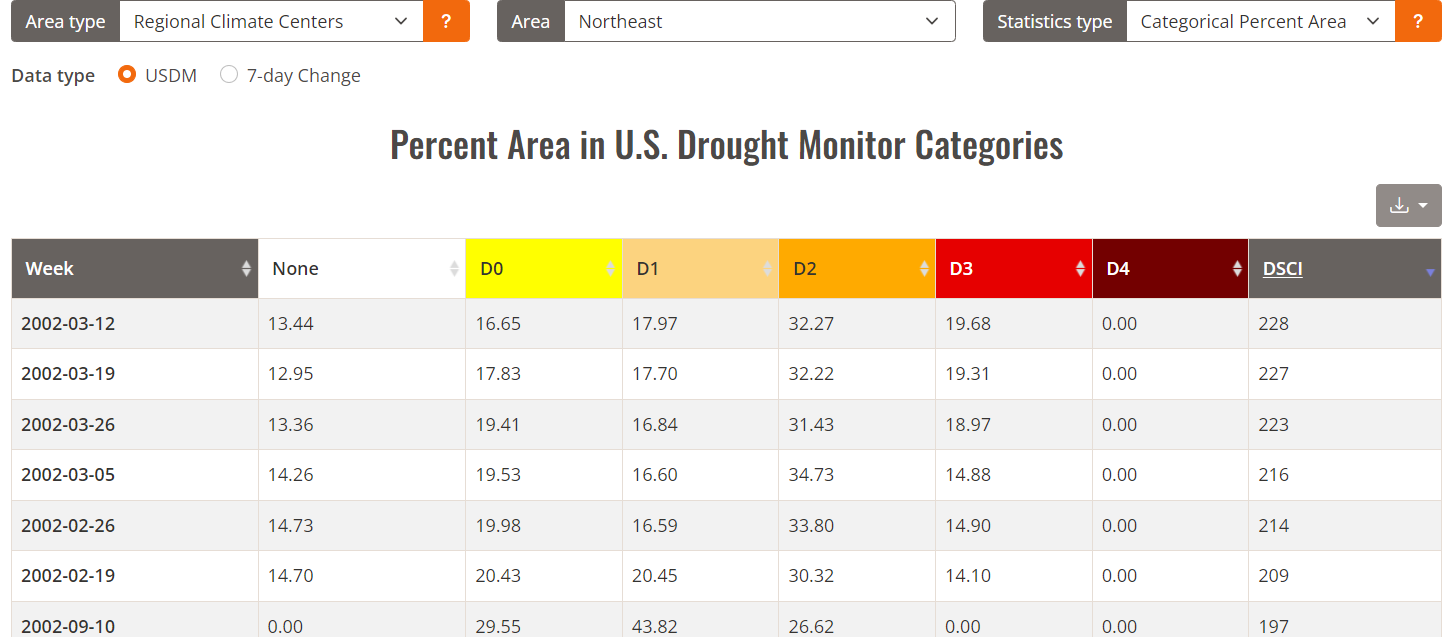
For the Delaware River Basin we haven't had a true drought since 2002. By true drought I mean from a hydrological standpoint. The last drought warning / emergency ended in NOV 2002. The highest weekly drought severity indexes for the NE back to 12/2000 were during the 2002 drought peaking on 3/12/2002 with an index of 228. For a frame of reference the fall 2016 dry period peaked at 161, fall 2020 at 131 & the summer 2023 dry period topped off at 107.
Since 2002 dry periods have been rare & when they happen they don't have a long shelf life.
https://droughtmonitor.unl.edu/DmData/DataTables.aspx


-
3.31" event total
28.87" since 12/1
-
9 minutes ago, Brian5671 said:
seems like a distant memory but April/May and into June 2023 were bone dry
from 10/1/23 - 11/20/23 Philadelphia recorded a lusty total of 0.79"
-
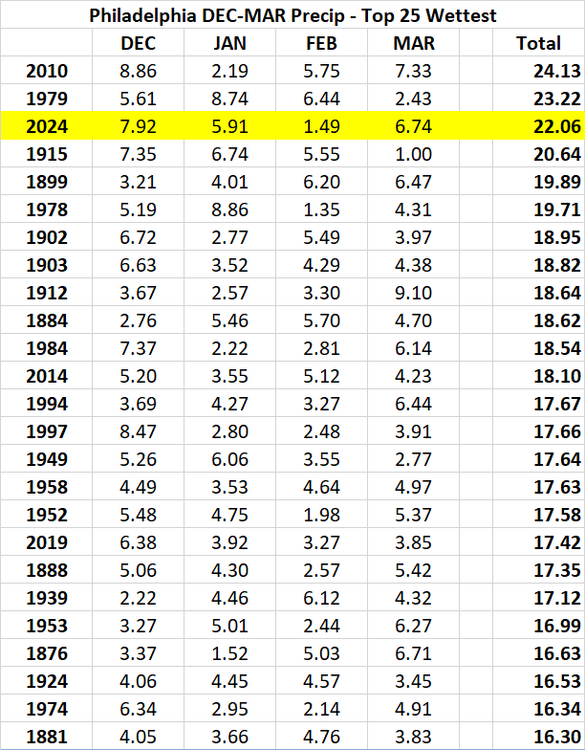
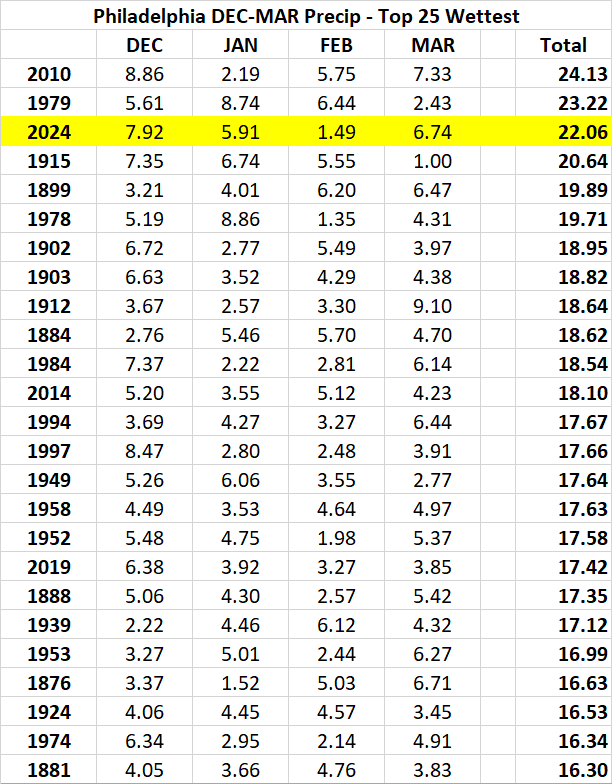
Since we transitioned to wet pattern in DEC Philadelphia has recorded:
- the 3rd wettest DEC on record
- the 5th wettest met winter on record
- wettest March day on record
- currently the 6th wettest March on record
- currently the 3rd wettest DEC-MAR period on record
Despite a top 20 dry FEB
Philadelphia precip records go back to 1872
-
1
-
1 hour ago, bluewave said:
The JAN-MAR 15 period still finished above 30.0 in NYC at 30.9. So it was comparable to DJF 14-15 at 31.4.
Decembers have warmed too much since the 70s and 80s to allow a full winter to finish below 30.0° like 76-77 did. December 14 came in at 40.5° with 60s on Christmas Day. So the cold got started too late to compete against the really cold winters like 76-77.
The cold also ended too quickly in 15 to have a memorable spring MAM cold ranking. In fact May 15 was the 2nd warmest on record in NYC.
The cold was so impressive in 76-77 that it was the 7th coldest fall and winter on record. That kind of 6 month extended cold is no longer possible from the fall into winter. These days the early to sometimes mid fall is like another summer month. Temperatures in 1977 actually rebounded for a time in the early spring like a delayed thaw. Then the historic snowstorm occurred in May.
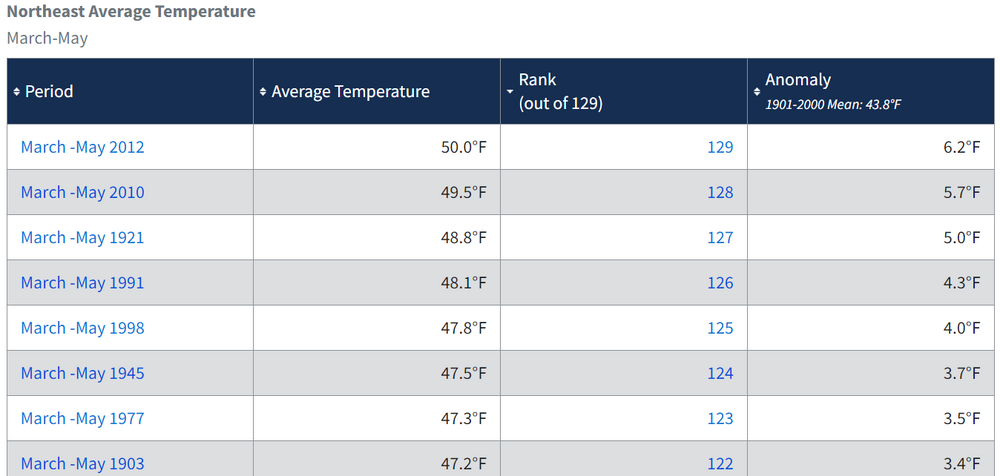
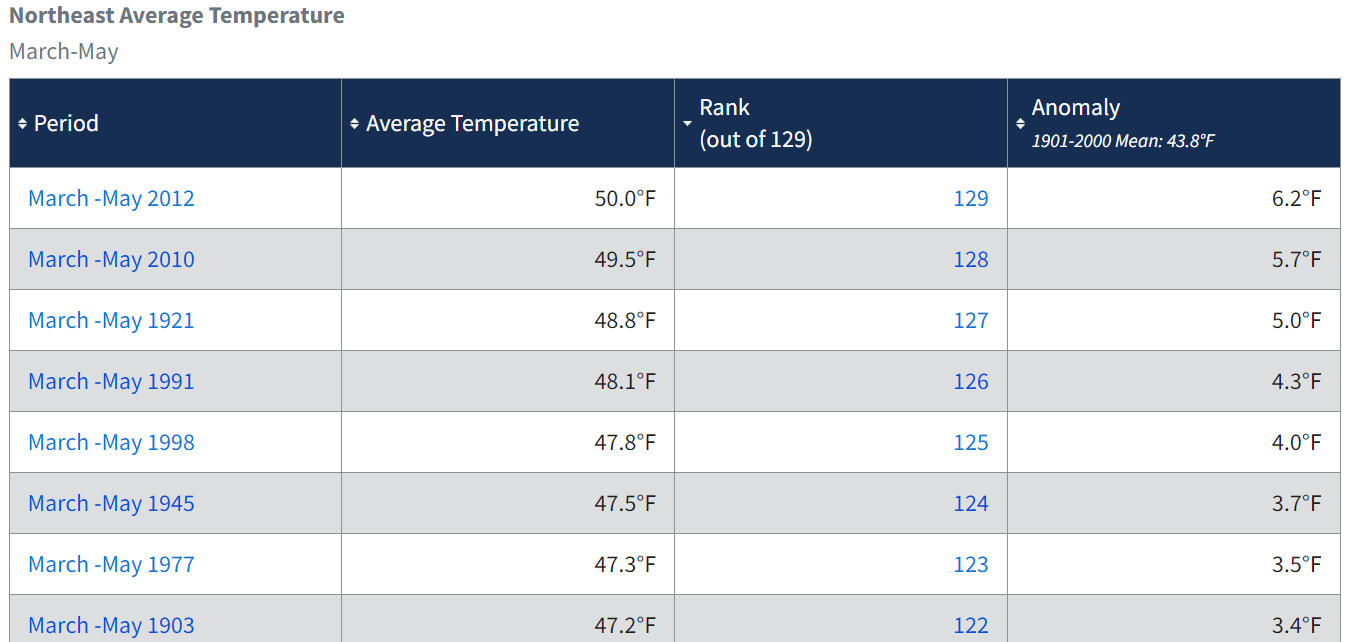
Overall the brutal 1977 winter ended rather abruptly in the NE & quickly transitioned to one of the warmest springs regionally on record. At the time it was the 3rd warmest & even in the face of the recent run of warmth it still remains the 7th warmest on record for the northeast. Pretty amazing that the monster 42" Buffalo snow cover that peaked in early FEB was gone by March 5th.
The May snow event is the ultimate late season fluke event especially for month that is still the 20th warmest May regionally. Boston was 92 degrees only a week after that event.
https://www.ncei.noaa.gov/access/monitoring/climate-at-a-glance/regional/rankings/101/tavg/197705
-
1
-
1
-
-
55 minutes ago, LibertyBell said:
Thats why 2014-2015 was such an awesome winter.... snow and cold.
1976-77 was a colossal bore, I am glad I was not aware enough to remember, cold without snow is a huge waste and energy burden and we had some huge energy problems in the 70s.
Locally here around the Philly area JAN 1977 was actually a top 10 snowiest month at that time. 21 of 31 days had at least 2" of snow cover. Problem was the rest of the season was useless snowfall wise.
Regardless given the current run of wretched winters I'd sign up for a redux in second.
-
16 hours ago, bluewave said:
The NYC 3 coldest winters since the 28.4°in 76-77 were 93-94, 02-03, and 14-15.
77-78 winter was colder than all 3 of those winters.
If you extend that out thru March 1977-78 was actually colder than that same period during 1976-77. The 2014-15 DEC-MAR period is only a tick warmer than the 1976-77 DEC-MAR timeframe.
The 2015 JAN-MAR period was the coldest since 1934
-
1
-
-
Syracuse has reached 70 degrees for only the 3rd time on record in FEB.
Rochester was 71 degrees the last hour, the all-time FEB record is 73 degrees
Edit: Rochester has reached 73 degrees today which ties the FEB max from 1997. Rochester has a long temp POR back to 1872.
-
2
-
-
23 hours ago, snowman19 said:
After all the non stop hype from some since November, around 2 weeks total of true arctic cold in mid-January and one 10+ storm (one 8-9 inch storm for my neck of the woods)…going into March…that’s all we have to show for it….pretty sad
After wk 2 the winter weeklies have been wretched going back to the 2019-2020 winter. Surprised we continue to see these plastered all over outlets by the same regarded mets every year.
The great March run we had last decade has definitely run it's course, been put to bed for several years so expectations are virtually non-existent at this point.
-
1
-
-
4 hours ago, LibertyBell said:
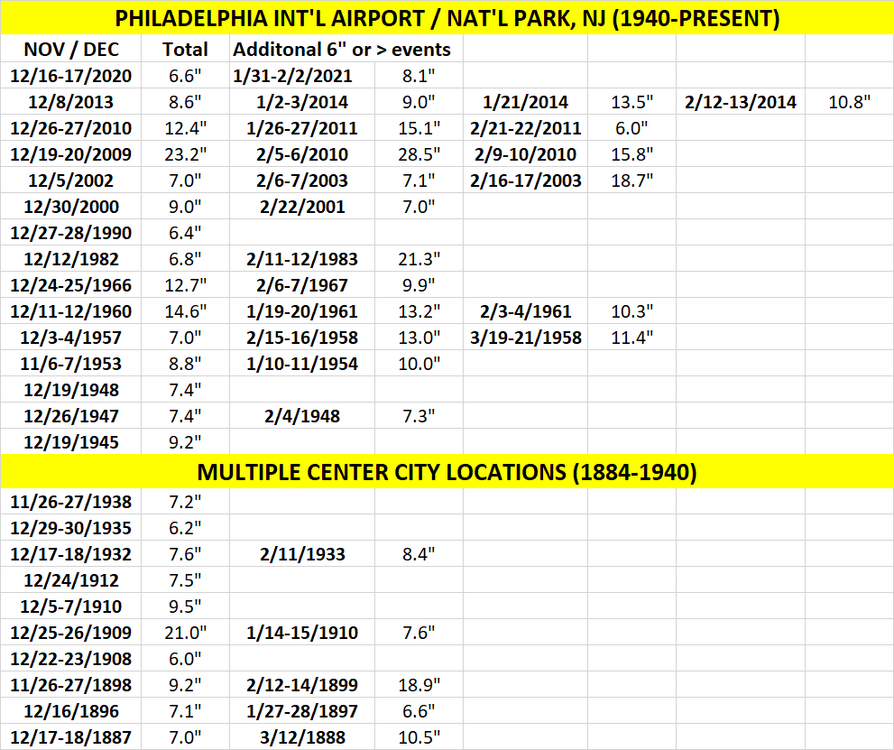
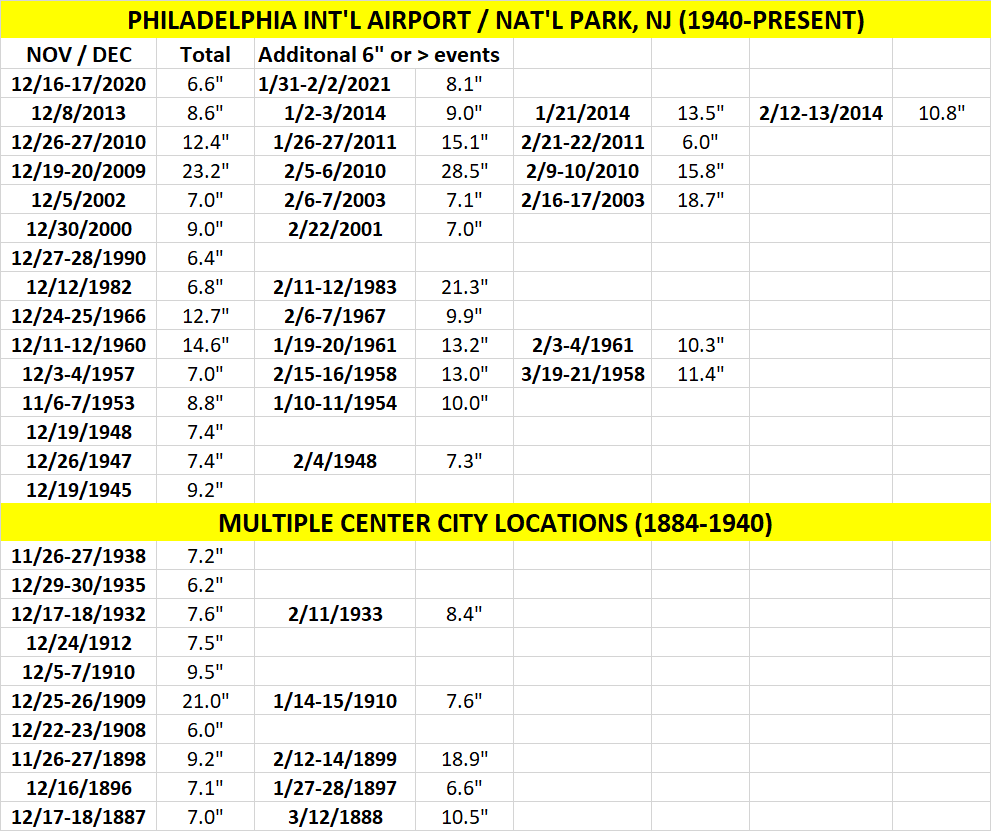
I'm curious, what did we have in 2017-18 before mid February and March? I know we had a snow event in mid February that year in the middle of a mild pattern, but didn't we also have a big storm in January? For whatever reason, it seems that getting a big storm earlier in the season increases the likelihood of getting another one later in the season even if there is a long stretch of mild weather in between-- 1966-67 is another case in point (and that was in a -PNA winter too.)
One early season trend down this way is a 6" or > event before JAN is virtually a lock for another 6" or > storm later in the season, sometimes 2 & maybe even 3. Only blemish for Philly back to the 1950's is the DEC 1990 snowstorm & even that was a close miss with a 5" event the following JAN.
-
1
-
-
The earliest 80 degree days at PHL & Central Park are 3/8 & 3/13 respectively.
-
1
-
-
7 minutes ago, mattinpa said:
I am pretty freaked out by that 80. I know there is climate change, but wow!
In another 10 yrs the people in FL are going to be coming to New England during the summer to escape the heat.
-
2
-
1
-
 1
1
-
-
What is really remarkable about DC hitting 80 today is this is over 3-1/2 wks. ahead of the earliest 80 degree day on record - 2/21/2018. The average 1st 80 day over the entire POR back to 1872 is 4/5. Since 2000 that average date is 3/25.
DC has only recorded (4) 80 degree days during the month of FEB, just wow
-
7
-
-
3 minutes ago, MJO812 said:
76 in DC now
79 degrees
-
1
-
-
6 minutes ago, donsutherland1 said:
Yes, it would break the January monthly record set on this date in 1950. We'll see when the final numbers are out.
Dulles hasn't quite got there yet, 79 degrees thru 1:40
-
1 minute ago, donsutherland1 said:
Washington, DC (DCA) has hit 80° for a high so far.
High was 76 thru 1:00pm, up 4 degrees in the past 1/2 hr?
80 would be an all time JAN record.
-
1
-
-
16 minutes ago, the_other_guy said:
DC is much warmer than us.
Normal high there for today is 45F
sometimes that gets glossed over.
Still very warm in the low 70s but it would be much warmer if it was in the low 70s here relative to normal
Since 1872 DC has recorded 75 degrees or higher on 13 occasions during the month of JAN. 9 of those occasions were before they even started keeping records at Dulles.


April 2024
in New York City Metro
Posted
Officially Philadelphia, Wilmington, Trenton, Allentown & Reading have not recorded 100 degrees since 2012, same as Central Park. A # of locations listed above are known warm bias sites, take for instance the Franklin Institute. Pic of that rooftop instrument shelter is attached. Any wonder why that location would run warm LOL. Newark is a joke and has been addressed on multiple occasions by the NJ State Climatologist. NE Philly & SJ Regional have been running out of tolerance warm for years.
You clearly lack consistency & need to treat the warm bias rooftops, helicopter pads, an ASOS next to miles of runway asphalt & 12 lanes of traffic.....garbage sites with the same degree of scrutiny as you do with the supposed vegetation issues at Central Park.